University of New Orleans University of New Orleans
ScholarWorks@UNO
ScholarWorks@UNO
University of New Orleans Theses and
Dissertations Dissertations and Theses
5-20-2005
The Kinetics of Particulate Substrate Utilization by Bacterial Films
The Kinetics of Particulate Substrate Utilization by Bacterial Films
Joshua Boltz
University of New Orleans
Follow this and additional works at: https://scholarworks.uno.edu/td
Recommended Citation Recommended Citation
Boltz, Joshua, "The Kinetics of Particulate Substrate Utilization by Bacterial Films" (2005). University of New Orleans Theses and Dissertations. 254.
https://scholarworks.uno.edu/td/254
THE KINETICS OF PARTICULATE SUBSTRATE UTILIZATION BY BACTERIAL FILMS
A Dissertation
Submitted to the Graduate Faculty of the University of New Orleans in partial fulfillment of the requirements for the degree of
Doctor of Philosophy in
Engineering and Applied Sciences
by
Joshua P. Boltz
B.S.C.E., University of South Alabama, 2001 M.S. University of New Orleans, 2003
ACKNOWLEDGEMENTS
I would like to express sincere gratitude toward Professor Enrique J. La Motta, whose
knowledge allowed for the development of this project. Professor La Motta is a teacher,
colleague, and friend. I would also like to acknowledge Professors J. Alex McCorquodale,
Adam Faschan, Bhaskar Kura, and Zhide Fang for their participation as members of the
dissertation committee. The University of New Orleans Schlieder Urban Environmental Systems
Center provided financial support of this research project.
Finally, glory to God for my accomplishments. God bless Rebeca, my life partner and
beloved wife, who endured every hardship with compassion, respect, patience, and love. God
bless David and Deborah, my Mother and Father, who always have, and always will, support,
encourage, and provide me with unconditional love. Finally, I would like to offer special thanks
to the little ones, because no hour was too early, or late, to be by my side. Thank you from the
TABLE OF CONTENTS
LIST OF FIGURES ... vi
LIST OF TABLES ... ix
ABSTRACT ... x
1. INTRODUCTION... 1
2. LITERATURE REVIEW ... 5
2.1. Physical and Biological Properties of Biofilms ... 5
2.1.1. Classification and Composition of Bacteria... 5
2.1.2. Extracellular Polymeric Substances (EPS) ... 7
2.1.2.1. Physical Properties and Spatial Distribution of EPS in Biofilms ... 8
2.1.2.2. EPS and Biological Flocculation ... 9
2.1.2.3. EPS and Biofilm Attachment... 11
2.1.3. Soluble Substrate Production from Biodegradable Particulate Organic Matter ... 14
2.1.3.1. Deposition of Particles on Biological Films... 15
2.1.3.2. Hydrolysis of Organic Particulates ... 16
2.1.4. Biofilm Thickness... 19
2.1.5. Biofilm Density ... 20
2.2. Dissolved Substrate Utilization by Biological Films ... 22
2.2.2. Internal Diffusion and Reaction of Substrate in a Biological Film ... 28
2.2.3. Growth Kinetics in a Biological Film System... 31
2.3. A Comparison of Bench Scale Reactors... 32
2.3.1. The Radial Flow Reactor ... 33
2.3.2. The RotoTorque... 34
2.3.3. The Submerged Rotating Disc Reactor: Theory and Analysis... 35
2.4. Existing Substrate Utilization Models ... 37
3. RESISTANCE TO EXTERNAL MASS TRANSFER OF MACROCOLLOIDAL PARTICULATES IN A BIOLOGICAL FILM REACTOR... 38
3.1. Experimental Design and Setup ... 39
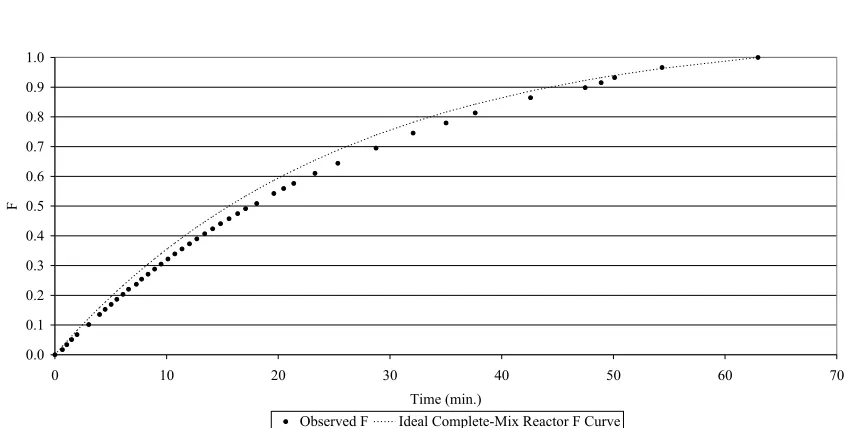
3.2. The Tracer Test ... 42
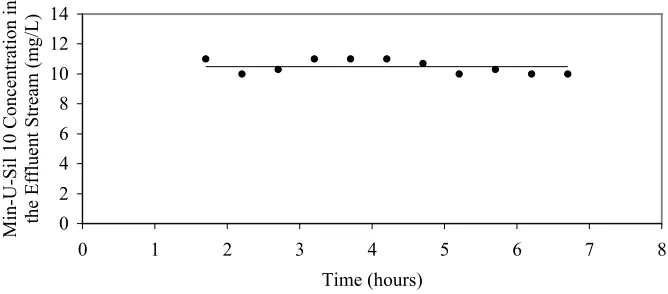
3.3. Confirmation of Steady State ... 45
3.4. Results and Discussion ... 47
4. KINETICS OF PARTICULATE AND DISSOLVED SUBSTRATE REMOVAL BY AEROBIC FIXED-FILMS... 49
4.1. Experimental Design and Setup ... 49
4.2. Confirmation Studies on Dissolved Substrate Removal... 53
4.3. Kinetics of Organic Particle Removal in the RDBR ... 56
4.4. Kinetics of Inorganic Particle Removal in the RDBR... 62
5. A MODEL FOR SIMULTANEOUS PARTICULATE AND DISSOLVED
SUBSTRATE REMOVAL BY BIOLOGICAL FILMS... 70
5.1. Experimental Design and Setup ... 72
5.2. Mixed-Order Model Confirmation Studies... 73
6. CONCLUSIONS AND RECOMMENDATIONS ... 78
7. REFERENCES ... 81
APPENDIX A... 90
APPENDIX B ... 93
APPENDIX C ... 95
APPENDIX D... 98
APPENDIX E ... 100
APPENDIX F ... 103
APPENDIX G... 105
APPENDIX H... 108
APPENDIX I ... 110
APPENDIX J ... 114
LIST OF FIGURES
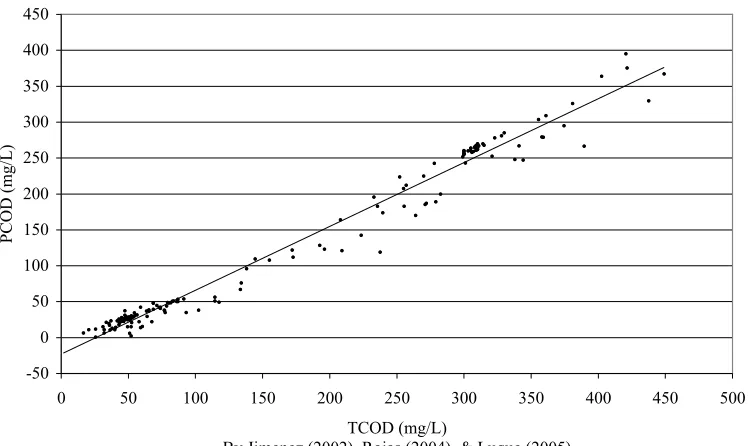
Figure 1. PCOD and TCOD Correlation observed at the UNO UWMRC Pilot-Plant ... 2
Figure 2. Biofilm Dissolved Substrate Concentration Profile... 23
Figure 3. RDBR Schematic ... 40
Figure 4. F Curve for RDBR Step Input Tracer Test... 45
Figure 5. Effluent Min-U-Sil 10 Concentration as a Function of Time... 46
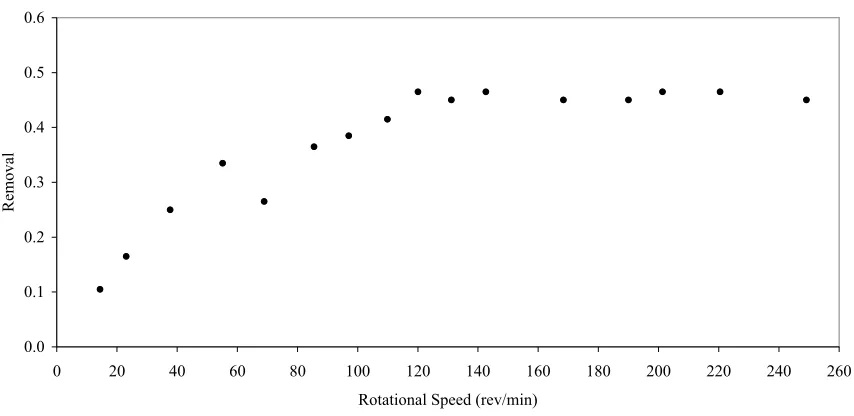
Figure 6. Min-U-Sil 10 Removal vs. Rotational Speed ... 47
Figure 7. Effluent Methanol Concentration vs. A/Q, Si = 4.41 mg DOC/L, δ = 40 µm .. 53
Figure 8. Methanol Uptake Rate Coefficient vs. Influent Methanol Concentration... 54
Figure 9. Intrinsic Methanol Uptake Rate vs. Biofilm Thickness ... 55
Figure 10. Effluent Corn Starch Concentration vs. A/Q when Si = 21.43 mg POC/L ... 56
Figure 11. Intrinsic Corn Starch Removal Rate vs. Biofilm Thickness... 58
Figure 12. Bioflocculation Rate Coefficient vs. Influent Corn Starch Concentration... 59
Figure 13. Organic Particle Asymptote, a, vs. Influent Corn Starch Concentration ... 61
Figure 14. Flocculated Native Corn Starch Particles at the Biofilm Surface (4x) ... 61
Figure 15. Flocculated Native Corn Starch Particles at the Biofilm Surface (10x)... 62
Figure 16. Effluent Min-U-Sil 10 Concentration vs. A/Q when Si = 20 mg TSS/L ... 63
Figure 17. Intrinsic Min-U-Sil 10 Removal Rate vs. Biofilm Thickness ... 64
Figure 18. Bioflocculation Rate Coefficient vs. Influent Min-U-Sil 10 Concentration ... 65
Figure 19. Inorganic Particle Asymptote, a, vs. Influent Min-U-Sil 10 Concentration.... 66
Figure 20. TEPC/Unit Biofilm Area vs. Biofilm Thickness Grown from Methanol ... 68
Figure 22. Effluent TOC vs. A/Q with 90% POC-10% DOC... 74
Figure 23. Dissolved Substrate Rate Coefficient, kv, vs. fd...75
Figure 24. Asymptote, m vs. f... 77
Figure 25. kp vs. f... 77
Appendix A-1. RDBR Profile Appendix ... 91
Appendix A-2. RDBR Plan Appendix ... 91
Appendix A-3. RDBR Elevation Appendix ... 92
Appendix A-4. Experimental Setup ... 92
Appendix C-1. Effluent Methanol Concentration vs. A/Q when Si = 9.91 mg DOC/L .... 96
Appendix C-2. Effluent Methanol Concentration vs. A/Q when Si = 17.93 mg DOC/L .. 96
Appendix C-3. Effluent Methanol Concentration vs. A/Q when Si = 60.00 mg DOC/L .. 97
Appendix C-4. Effluent Methanol Concentration vs. A/Q when Si = 128.13 mg DOC/L .... ... 97
Appendix E-1. Effluent Corn Starch Concentration vs. A/Q when Si = 48.88 mg POC/L ... ... 101
Appendix E-2. Effluent Corn Starch Concentration vs. A/Q when Si = 101.32 mg POC/L ... 101
Appendix E-3. Effluent Corn Starch Concentration vs. A/Q when Si = 205.78 mg POC/L ... 102
Appendix G-1. Effluent Min-U-Sil 10 Concentration vs. A/Q when Si = 50 mg TSS/L ...
... 106
Appendix G-2. Effluent Min-U-Sil 10 Concentration vs. A/Q when Si = 100 mg TSS/L .... ... 106
Appendix G-3. Effluent Min-U-Sil 10 Concentration vs. A/Q when Si = 200 mg TSS/L .... ... 107
Appendix G-4. Effluent Min-U-Sil 10 Concentration vs. A/Q when Si = 400 mg TSS/L .... ... 107
Appendix I-1. Effluent TOC vs. A/Q with 79% POC-21% DOC ... 111
Appendix I-2. Effluent TOC vs. A/Q with 70% POC-30% DOC ... 111
Appendix I-3. Effluent TOC vs. A/Q with 61% POC-39% DOC ... 112
Appendix I-4. Effluent TOC vs. A/Q with 51% POC-49% DOC ... 112
Appendix I-5. Effluent TOC vs. A/Q with 40% POC-60% DOC ... 113
LIST OF TABLES
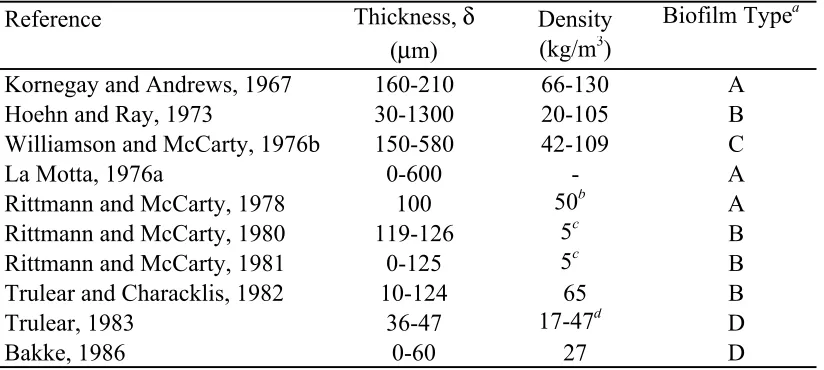
Table 1. Reported Biofilm Thickness and Density... 20
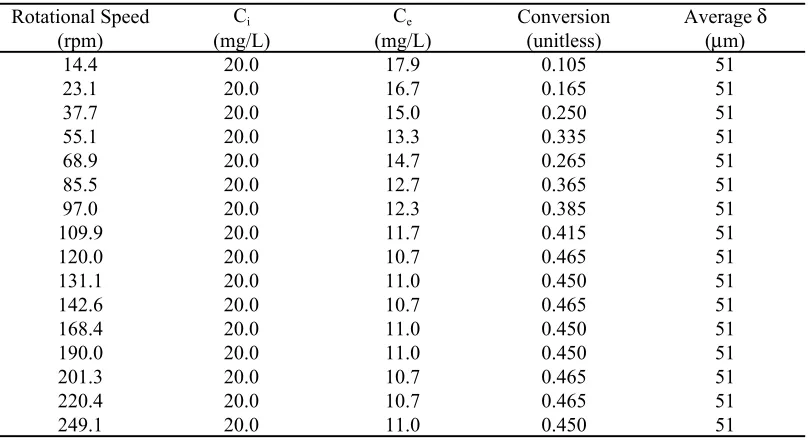
Table 2. External Mass Transfer Data... 43
Table 3. Steady State Assumption Confirmation... 46
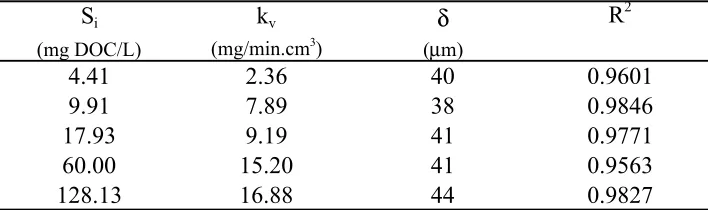
Table 4. Methanol Experimental Data Linear Regression Analysis... 54
Table 5. Corn Starch Nonlinear Regression Analysis Parameters... 57
Table 6. Min-U-Sil 10 Nonlinear Regression Analysis Parameters ... 63
Table 7. Influent Parameters for Mixed-Order Model Confirmation Studies ... 73
Table 8. Nonlinear Regression Parameters for Mixed-Order Model Confirmation ... 75
Appendix B. Tracer Test Data ... 94
Appendix D-1. Methanol Internal Diffusion ... 99
Appendix D-2. Native Corn Starch as a Function of Biofilm Thickness Worksheet ... 99
Appendix D-3. Min-U-Sil 10 as a Function of Biofilm Thickness Worksheet... 99
Appendix F-1. Bioflocculation Rate Data – Organic Particles ... 104
Appendix F-2. Bioflocculation Rate Data – Inorganic Particles ... 104
Appendix F-3. Methanol Rate Data – Reactors in Parallel ... 104
Appendix H-1. Methanol EPS Worksheet ... 109
Appendix H-2. Organic Particle EPS Worksheet ... 109
ABSTRACT
There is a need to develop a mathematical expression capable of describing the removal
of particulate chemical oxygen demand (PCOD) from wastewaters in biological film systems. In
this context, organic particles that are maintained in suspension (i.e., not removed during normal
settling) are the focus of experimentation, modeling, and discussion. The goal of this research
project is to study the kinetics of PCOD removal from wastewaters by bacterial films, or
biofilms. To achieve this objective, a bench-scale rotating disc biofilm reactor (RDBR) was
operated using methanol (dissolved substrate), Min-U-Sil 10 (inorganic particulates), and
Maizena corn starch (organic particulates) dissolved/suspended in the influent stream. The effect
of the ratio of biofilm area to volumetric flow rate passing through the RDBR on the
concentration of substrate remaining in the final effluent was determined, and the kinetic
relationship was established for both dissolved substrate and particle removal. Exocellular
polymeric substances (EPS) were extracted and quantified in order to explain the role of
biological flocculation, or bioflocculation, in particulate removal.
In the literature, Fick's first law and zero-order kinetics have described the diffusion and
biochemical reaction of soluble substrate within the bacterial film matrix (when completely
penetrated), respectively. The present study confirms this kinetic behavior for various influent
methanol concentrations. On the other hand, the removal of particulates, organic and inorganic,
adheres to first-order reaction kinetics. These findings, coupled with the identification of EPS,
A mass balance on the biofilm reactor allowed for the development of a comprehensive
rate expression for substrate consumption by biofilms when both dissolved and particulate
substrates are available. Total chemical oxygen demand (TCOD) is comprised of dissolved
chemical oxygen demand (DCOD) and PCOD, each of which can be readily determined through
laboratory analysis. An equation was developed that accurately describes the disappearance of
1. INTRODUCTION
Several mechanistic models have been developed to describe the kinetics of dissolved
substrate utilization by bacterial films, or biofilms. There are two “schools of thought” regarding
the kinetics of dissolved substrate utilization by biofilms. Researchers such as Williamson and
McCarty (1976a, 1976b) and Rittmann and McCarty (1978, 1980a, 1980b, 1981, 2001) have
applied Monod type kinetics to describe biochemical reaction of soluble substrate by biofilms.
Another group, including La Motta (1976a), Harremoës (1978) and Trulear and Characklis
(1982), have observed that zero-order kinetics accurately describes the intrinsic rate of dissolved
substrate utilization by thin (completely penetrated) biofilms. These models, however, have
limited application whenthe primary constituent of chemical oxygen demand (COD) in domestic
wastewaters is organic particulates.
Recent research has demonstrated that frequently a small fraction of the total COD
(TCOD) in raw sewage and primary effluents is dissolved. Metcalf and Eddy (2003) state that
only 20-50% of the TCOD in municipal sewage is dissolved and Levine, et al., (1985, 1991)
have pointed out that a major fraction of the organic matter in municipal wastewater is in
particulate form. The University of New Orleans (UNO) Urban Waste Management and
Research Center (UWMRC) demonstrated that municipal wastewaters in Jefferson Parish, LA,
on the west bank of the Mississippi River, contain approximately 15% of dissolved COD
(DCOD) and 85% of particulate COD (PCOD) (La Motta,et al., 2003). In this context, DCOD
is defined as the COD remaining after the chemical flocculation laboratory method described
compiled by several researchers within the UWMRC, and indicates that, in fact, a major fraction
of COD in wastewater samples taken from the UNO UWMRC pilot-plant located at the Marrero
Wastewater Treatment Plant, Marrero, Louisiana, is in particulate form.
-50 0 50 100 150 200 250 300 350 400 450
0 50 100 150 200 250 300 350 400 450 500
TCOD (mg/L)
By Jimenez (2002), Rojas (2004), & Luque (2005)
PCOD (mg/L)
Figure 1. PCOD and TCOD Correlation Observed at the UNO UWMRC Pilot-Plant
A linear regression analysis provided a best-fit equation of PCOD = 0.889.TCOD – 22.85. The
coefficient of determination, R2, is 0.979.
Boltz (2003) demonstrated that the removal of organic and inorganic particulate matter in
a pilot-scale trickling filter (TF), located at the aforementioned UWMRC pilot-plant, adheres to
first-order reaction kinetics regardless of the amount of DCOD available in the influent stream.
This consumption in the pilot-scale TF is well described by a dispersion model, whose solution is
more efficient at removing PCOD than DCOD. There is a significant paucity of experimental
data pertaining to the kinetics of particulate removal by aerobic fixed-film wastewater treatment
processes or the flocculation of particles by the said films. Therefore, there is a need to develop
a mathematical expression capable of describing the removal of PCOD from wastewaters by
aerobic, biological films.
The primary goal of this research project is to study the kinetics of PCOD removal from
wastewaters by biofilms. In this context, organic particles that are maintained in suspension (i.e.,
not removed during normal settling) are the focus of experimentation, modeling, and discussion.
To achieve this objective, a bench-scale rotating disc biofilm reactor (RDBR) is operated using
methanol (dissolved substrate), Min-U-Sil 10 (inorganic particulates), and Maizena corn starch
(organic particulates) dissolved/suspended in the influent stream. The transport of dissolved
substrate from the bulk of the liquid to the wastewater/biofilm interface has been well
documented. The literature has used Fick’s first law and zero-order kinetics to describe diffusion
and biochemical reaction of soluble substrate within the biofilm matrix, respectively. Since
particulate, organic and inorganic, removal in the aforementioned pilot-scale TF adheres to
first-order reaction kinetics, and La Motta, et al., (2003) have described bioflocculation in the
activated sludge system as a first-order process, then the removal of dissolved and particulate
substrates by biofilms can, theoretically, be differentiated by their removal kinetics.
Consequently, the rate of removal of each substrate can be measured when the system is fed
This research project was designed to implement a mass balance approach, utilizing the
RDBR, to develop a comprehensive expression capable of describing overall substrate
consumption by biological filmswhen both dissolved and particulate substrates are available.
Assuming that TCOD is comprised of DCOD and PCOD, each of which can be readily
determined through laboratory analysis, an equation will be developed that accurately describes
the disappearance of TCOD by the bioflocculation of PCOD and consumption of DCOD. This
research also identifies the role extracellular polymeric substances (EPS) play in the removal of
2. LITERATURE REVIEW
2.1. PHYSICAL AND BIOLOGICAL PROPERTIES OF BIOFILMS
A biofilm is a complex community containing bacterial cultures. Algae, fungi,
protozoan, and metazoan, such as worms, insect larvae, and snails, may also be present in the
ecosystem. The composition of biofilms is generally dictated by the conditions under which they
are grown. The physical properties of biofilms are directly related to those of their primary
constituents, namely microbial cells and EPS. Macroscopic properties generally dictate the rate
and extent of biofilm internal processes. Physical, chemical, and biological properties are
dependent upon the environment in which the biofilm was grown. The physical and chemical
components of the aquatic and substratum environment affect the predominant biofilm
organisms. It is convenient to analyze biofilm as the sum of its constituents. Therefore, a
discussion of the physical and biological properties of biofilms will be developed in this section.
2.1.1. Classification and Composition of Bacteria
Bacteria are of primary importance for adequate performance in biological treatment
processes (Metcalf and Eddy 2003). Archaea and bacteria are microscopic and prokaryotic.
Each lack a nuclear membrane, whereas Eucarya have a nuclear membrane and vary in size from
microscopic to macroscopic. Bacteria oxidize dissolved carbonaceous organic matter into simple
end products, namely carbon dioxide and water, and additional biological mass, or biomass.
The following equation (1), presented by Metcalf and Eddy (2003), describes the aerobic
νi
(
organic matter)
+ν2O2+ν3NH3+ν4PO43−⎯microorganisms⎯⎯⎯⎯→ν
5
(
new cells)
+v6CO2 +ν7H2O (1)Here, νi is a stoichiometric coefficient. Oxygen, ammonia, and phosphate are representative
nutrients necessary for the conversion of organic matter into the aforementioned simple end
products. Usually, bacteria are smaller than 5 µm in diameter. Facultative bacteria decompose
organic material in wastewater along with aerobic and anaerobic bacteria. Aerobic bacteria exist
near the external surface of the biological film. Dissolved oxygen (DO) consumed in the liquid
layer is readily replenished by reoxygenation from ambient air. However, as the microorganisms
continue to grow the biological film becomes thicker. Therefore, as the biological film
approaches the growth medium, the bacteria may become anaerobic. This is due to the
consumption of DO near the biofilm's surface.
Appropriate nutrients must be present in order to sustain microbial growth. An
understanding of the composition of bacterial cells provides a basis for the nutrients needed for
growth. Prokaryotes are about 80% water and 20% dry material, 90% of the dry material is
organic and 10% is inorganic. Major cellular material reported as percent of dry weight is 55%
protein, 5% polysaccharide, 9.1% lipid, 3.1% DNA, 20.5% RNA, 20.5% other, and 1% inorganic
ions. Cellular elements reported as percent of dry weight is 50% carbon, 22% oxygen, 12%
nitrogen, 9% hydrogen, 2% phosphorus, 1% sulfur, 1% potassium, 1% sodium, 0.5% calcium,
0.5% magnesium, 0.5% chlorine, 0.2% iron, and 0.3% other trace elements (Madigan, et al.
In biological wastewater treatment, microorganisms use an electron-donor substrate for
synthesis. Initially, a portion of its electron is transferred to the electron acceptor to provide
energy for conversion of the other portion of electrons into microbial cells. The portion that is
initially converted into cells provides a basis for partitioning the substrate between energy
generation and synthesis (Rittmann and McCarty 2001). Aerobic organisms need to send
relatively few electrons from their donor to oxygen in order to generate the energy required to
synthesize a given amount of new biomass (Rittmann and McCarty 2001).
2.1.2. Extracellular Polymeric Substances (EPS)
Most bacteria produce EPS (Characklis and Marshall, 1990). Bacterial polymers are
primarily composed of polysaccharides and protein (Lazarova and Manem 1995).
Polysaccharides are carbohydrates that can be decomposed by hydrolysis into two or more
molecules of monosaccharides. Exocellular biopolymers are excreted by bacteria and can be
attached to the cell in a capsule, or excreted onto surrounding medium as slime (Higgins and
Novak 1997). The attachment of microorganisms to surfaces, and other microorganisms, can be
found throughout nature and engineered systems (Logan, et al. 1986). Biopolymers provide
bacterial microorganisms with a mean of anchoring to medium in order to feed (Zhang, et al.
1999). The interaction between a bacterial cell and the substratum leading to irreversible
adhesion is determined by the physical properties of the macromolecules at the cell surface.
Furthermore, electron microscopy has revealed that EPS are the extracellular matrix responsible
for biofilm integrity. This section will explain the spatial distribution of EPS throughout
biofilms, the role of EPS in bioflocculation, and the role of EPS in bacterial attachment and
2.1.2.1. Physical Properties and Spatial Distribution of EPS in Biofilms
Proteins and polysaccharides are the primary extracellular macromolecules in biofilms
(Laspidou and Rittmann 2002). Traditionally, proteins and nucleic acids are termed higher order
structures. Physical properties of polymers are greatly influenced by their shape. Alterations to
the solvent (in the case of aerobic wastewater treatment, the solvent is water) composition
including pH, temperature, or the addition of inorganic salts may alter a polymer’s physical
properties (Characklis and Marshall 1990). EPS are a primary component of a biofilm’s organic
mass. Typically, 95% of the mass of a biofilm is water, and 5% is dry material; approximately
90% of a biofilm’s organic carbon is comprised of EPS (Characklis and Marshall 1990). During
previous kinetic studies (La Motta 1976a; Williamson and McCarty 1976a; Rittmann and
McCarty 1978), researchers have assumed that biofilms contain a homogeneous distribution of
bacteria. Zhang and Bishop (2001) demonstrated that biofilms are heterogeneous structures.
The researchers cut an intact piece of biofilm with a thickness greater than 3500 microns, the
biofilm sample was frozen and subjected to “microslicing” (Zhang and Bishop 2001).
Subsequently, the researchers divided the sample into 200-micron subdivisions, which were
analyzed for EPS. The bacteriological configuration of the biofilm varied along its
cross-sectional depth. Zhang and Bishop (2001) demonstrated that anaerobic bacteria replace aerobic
bacteria as the organisms approach the growth medium. This is due to transfer limitations in DO
and substrate. However, the physical properties of biofilms are dependent upon the conditions
under which they are grown. Therefore, specific characteristics vary from treatment system to
treatment system. The presence of nutrients and DO promotes the growth of viable biomass
(Zhang and Bishop 2001). The outermost layer of a biofilm is subjected to the highest DO and
of the biofilm. Zhang and Bishop (2001) also demonstrated that the EPS yields were directly
related to the amount of viable biomass present. Therefore, the most dominant presence of EPS
is in the outermost layer of the biological film. This layer has the greatest exposure to organic
and inorganic particulates in influent wastewater.
True intrinsic kinetics is masked by thick biological films (the definition of thin and thick
biofilms shall be presented in a later section) and has been described by half-order kinetics (La
Motta 1976a). In order to observe the intrinsic substrate utilization rate, experiments must be
conducted in the absence of external diffusional resistances with thin biological films (La Motta
1976b). A close inspection of Zhang and Bishop’s data reveals that EPS yields remain
practically constant in the outermost layers (within 500 microns of the biofilm surface).
2.1.2.2. EPS and Biological Flocculation
Bioflocculation promotes physical removal of particulate organics. The EPS on the
biofilm’s surface act as a flocculating agent for both organic and inorganic particulates (Boltz
2003). Bioflocculation is a physical-chemical process whereby growing and reproducing
suspended bacterial cells adhere to each other in a floc formation (Schuyler, et al., 2001).
Tenney and Stumm (1965) have described bioflocculation as “an agglomeration of cells resulting
from specific adsorption of polymer segments and from bridging of polymers between cells.”
Friedman, et al., (1969) have presented microscopic evidence that floc-formation of bacteria was
caused by exocellular polymers. The aforementioned researchers’ data suggested that bacteria
that have been selected on the basis of their characteristic flocculent growth habit all possessed
fibrils is a plausible explanation of the flocculation phenomenon. The physical and chemical
properties of the specific exocellular polymer will determine the extent to which water is bound
to the polymer and will also determine the solubility properties of the polymer. Liao, et al.,
(2001) have demonstrated that filamentous microorganisms, in fact, do not control the
bioflocculation process. The researchers determined that activated sludge floc formation in
laboratory sequential batch reactors, with glucose as the carbon source, was dependent upon
inorganic salt concentration, particularly Ca2+
and Mg2+
. Higgins and Novak (1997) also
demonstrated that the addition of divalent cations, Ca2+
and Mg2+
, to the feed of laboratory
activated sludge systems increased the bound protein content, which was also associated with an
improvement in settling. The researchers applied a cation bridging model, which explained that
divalent cations act as a bridge between negatively charged sites within biopolymers. The
interaction between the negatively charged biopolymers and the zeta-potential associated with
the surface of organic and inorganic particles provides sufficient explanation for the removal of
particulates in fixed-film processes by the bioflocculation phenomenon.
La Motta, et al., (2003) have described bioflocculation as a first-order process in an
activated sludge unit operating under optimum environmental conditions. An adaptation of the
first-order bioflocculation equation for biofilms is (2):
r=−kp
(
Ce−a)
(2)where r describes the rate of flocculation (kg/s.m2
), kp is a first-order rate constant (m/s), Ce is the
concentration of particles remaining in the effluent stream after time t (kg/m3
minimum concentration of particles that could be obtained in the effluent by bioflocculation in
the reactor (kg/m3
).
Boltz (2003) demonstrated that the removal of organic and inorganic particulate matter,
expressed as total suspended solids (TSS) and PCOD, in a pilot-scale TF adheres to equation (2).
This consumption in the pilot-scale TF was well described by a dispersion model, whose solution
is similar to the one presented by Wehner and Wilhelm (1956). The first-order removal of
particulates agrees with the general kinetic behavior of biological flocculation. The presence of
EPS explains the removal of particulates by biological flocculation in biological films.
2.1.2.3. EPS and Biofilm Attachment
Biofilm accumulation can be divided into three sequential phases; initial events,
exponential accumulation, and steady state (Characklis and Marshall 1990). Various transport,
interfacial transfer, and transformation processes contribute to biomass accumulation at a
substratum. La Motta, et al., (1982) have described biofilm accumulation as the sum of the
following physical, chemical, and biological processes. First, the substratum is conditioned by a
series of organic molecules. Next, planktonic microbial cells are transported from the bulk liquid
to the conditioned substratum. A portion of the cells that reach the conditioned area is reversibly
adsorbed to the substratum. A fraction of the reversibly adsorbed cells remain immobilized and
become irreversibly adsorbed. Finally, the irreversibly adsorbed cells utilize substrate and
nutrients in the bulk liquid to generate biomass and end products. As additional cells and
sloughing, or rapid, massive loss of biofilm (Atkinson and Howell 1975), from fluid shear stress.
The detached material reenters the bulk liquid.
The initial step in biofilm formation is substratum conditioning. The transport of
molecules and small particles in laminar flow can be described by molecular diffusion, i.e. Fick’s
Law (3), (Characklis and Marshall 1990).
JS =DW dSS
dx (3)
Where,
JS = mass transfer (ML-3t-1)
Dw = diffusivity (Mt-1)
dSS
dx = concentration gradient (ML
-4)
Biological wastewater treatment systems are generally operated under turbulent flow conditions.
Here the diffusion equation (3) must be modified to account for turbulent eddy transport. The
diffusion equation (3) is useful in describing the transport of dissolved substrate. However, fluid
dynamic forces in a turbulent flow regime transport particles within the bulk liquid to:
(a) the substratum surface during conditioning and film formation, and
(b) the biofilm surface during the bioflocculation of particulates.
The physical-chemical processes associated with each of the aforementioned phenomenon are
similar. Therefore, the process will be described at length in later sections to describe the
Marshall and co-workers (1971, 1973, 1976) proposed that the biofilm attachment
process occurs in two distinct steps, each of which is controlled by different mechanisms. First,
the transport of molecules occurs significantly faster than that of bacterial cells. Therefore, the
adsorption of conditioning films is assumed to occur instantaneously. The second stage involves
irreversible film attachment and requires an “incubation period” of at least three hours. The lag
period allows for the production of EPS necessary for firm attachment.
Adsorption of an organic film is an interfacial transfer process that occurs within minutes
of initial exposure (Marshall 1973). This process alters the properties of the wetted surface.
Investigators have shown that materials with complex surface properties such as wettability,
surface tension, and electrophoretic mobility are readily conditioned by adsorbing organics when
exposed to natural waters with low organic concentrations (Characklis and Marshall 1990). The
conditioning film is dynamic. Molecular turnover occurs with increasing molecular weight.
Polymers adsorb more strongly due to the presence of multiple binding sites, in which they
displace molecules of lower molecular weight (Cohen-Stuart, et al. 1980). EPS may have up to
105 units per chain. Therefore, each macromolecule may have many bonds to the substratum.
For materials that are not particularly repellent to microorganisms, the surface chemistry
of bacteria plays an important role in the adsorption process (Cunliffe, et al., 1999). Several
biological studies have been performed on the formation of biological films. Researchers such
as Cunliffe, et al. (1999), and Bakker, et al. (2003) have proposed that elimination, or retardation,
of bacterial conditioning films is the key to avoiding deleterious biofilm growth. Bakker, et al.
surface-energy polymeric coating. Inversely, La Motta, et al., (1982) proposed that a
combination of synthetic and naturally occurring biopolymers, used as surface conditioners, will
promote biofilm growth in otherwise slow developing systems such as nitrification and anaerobic
carbon removal.
Morphology of the substratum due to the conditioning film, or synthetic polymers,
includes a decrease in hydrophobicity. Both positively and negatively charged surfaces acquire
net negative charges (Loeb and Neihof 1975), and zeta potentials, contact potentials, and critical
surface tensions are increased or decreased (Baier 1975) depending on the initial surface energy.
Adsorption of a conditioning film decreases the surface energy of clean, high-energy surfaces
(70 dyn cm-1), but has diminutive effects on low energy surfaces (20 dyn cm-1) (Baier 1980).
2.1.3. Soluble Substrate Production from Biodegradable Particulate Organic Matter
The literature describes biological films as being efficient in removing dissolved
substrate from wastewaters. There is a paucity of information on the proportion of truly
dissolved organic matter in sewage. Metcalf and Eddy (2003) state that only 20-50% of the
TCOD in municipal sewage is dissolved and Levine, et al., (1985, 1991) have pointed out that a
major fraction of the organic matter in municipal wastewater is in particulate form. The UNO
UWMRC has demonstrated that municipal wastewaters in Jefferson Parish, LA, on the west
bank of the Mississippi River, contain approximately 15% of DCOD and 85% of PCOD (La
Motta,et al., 2003). A review of Figure 1 illustrates that a major fraction of COD in wastewater
samples taken from the UNO UWMRC pilot-plant located at the Marrero Wastewater Treatment
biofilms, but bacteria cannot consume particulate substrates directly. The prokaryotic cell wall
prevents most bacteria from the uptake and degradation of organic particulates and aqueous
polymers by phagocytosis. Organic particulates trapped by biological films are converted to
soluble substrate through the excretion of extracellular enzymes before consumption, or removed
via secondary settling after sloughing. The decomposition process is referred to as hydrolysis.
This section will discuss the method by which particles (organic and inorganic) are transported to
the biofilm surface, the method of entrapment (namely bioflocculation), hydrolysis of organic
particulates, and the rate of production.
2.1.3.1. Deposition of Particulates on Biological Films
Dynamic forces govern transport and interfacial processes in a turbulent flow regime.
The particle flux to the surface increases with increasing particle concentration. However, the
particle flux is dictated by the particle characteristics (e.g., size, shape, density, etc.) (Characklis
and Marshall 1990). Particles (inorganic or organic) in turbulent flow are transported to within a
short distance of the biofilm surface by eddy diffusion and are propelled into the laminar
sublayer (a detailed definition of bulk liquid and the laminar sublayer will be presented in a later
section) by their acquired momentum. When evaluating the mode of particle transport, it is
convenient to consider two cases:
(a) particles that are retained in suspension, and
(b) particles that, either because density or size, are subject to settling.
For soluble matter and colloidal particulates (case a), diffusion can adequately describe
Microbial cells and macrocolloidal particulates ranging in size form 0.5 to 10 microns can be
transported from the bulk liquid to the biofilm surface by several mechanisms including
diffusion (Brownian and non-Brownian), gravity, fluid dynamic forces, and thermophoresis. The
latter is only significant when particles are being transported through a temperature gradient
(Lister 1981).
In the case of particle density greater than that of the surrounding liquid (case b), the
particle will travel along the wetted surface faster than the liquid in the region of the surface.
Lift forces will direct the particles to the surface (Rouhiainen and Stachiewicz 1970). If the mass
density of the particle is substantially different from that of the surrounding liquid, then gravity
forces govern particle transport.
2.1.3.2. Hydrolysis of Organic Particulates
Hydrolysis refers to the breakdown of complex organic particles into smaller soluble
products that can be utilized by bacteria. However, the strict definition of hydrolysis is the
breakdown of a polymer into smaller units by the addition of water (Brock and Madigan 1991).
When analyzing hydrolysis in aerobic wastewater treatment systems, two categories can be
differentiated. First, the hydrolysis of primary substrate, where organic particulates within the
wastewater are degraded, and second, the hydrolysis of secondary substrate, i.e. hydrolysis of
bacterial cell’s internal storage products, of substances released during normal metabolism, or of
particles produced during bacteria decay (Morgenroth, et al., 2002). The latter case is a complex
study in itself, and the removal of COD from domestic and industrial wastewaters is of primary
discussion. In wastewater treatment applications, the processes of hydrolysis includes all
mechanisms that make slowly biodegradable substrate available for biomass production (Gujer,
et al., 1999).
Hydrolysis is diverse and is influenced not only by the properties of the particle, but with
the type of organisms involved in the process. Degradation is dependent upon extracellular
depolymerization followed by cellular uptake and subsequent metabolization (Chróst 1991).
There are two mechanisms of depolymerization, exo- and endo-enzymes. Exo-enzymes attack
the integrity of a specific bond upstream of the end (normally the non-reducing end).
Endo-enzymes act randomly on internal polymer bonds away from the terminal monomers
(Morgenroth, et al., 2002). The Enzyme Handbook (Schomburg, et al., 1997) identifies 197
extracellular enzymes, 145 of which are hydrolytic.
Morgenroth, et al., (2002) claims, “The substrate specific activity is thought to follow
traditional Michaelis-Menten kinetics.” Other factors affecting the rate of reaction for the
degradation of organic particulates and polymers by extracellular hydrolysis include local
concentration of enzymes, location of the enzymes, and product transport mechanisms. Existing
models explain the uptake of soluble substrate present in the wastewater and available after the
hydrolysis process. There is a general agreement throughout the literature that it is necessary to
differentiate between readily biodegradable (dissolved) and not readily biodegradable
(particulate) substrates (Dold, et al., 1980, Henze, et al., 1987, Orthon, et al., 1994). The rate of
generates (Okutman, et al., 2001). Hydrolysis is typically described by means of a surface
limited type of reaction kinetics (4) (Henze, et al., 1987)
dXS dt =−kh
XS XH
KX+XS XH
XH (4)
Where,
XS = Slowly biodegradable PCOD (mg/L)
kh = Overall rate constant for hydrolysis (day-1)
XH = Active heterotrophic biomass (mg/L)
KX = Overall saturation coefficient for hydrolysis (mg COD/mg cell COD)
A simple approach to expressing the rate of hydrolysis has been described (5):
rhyd =−khXS (5)
Where,
rhyd = first-order hydrolysis rate coefficient (day
-1
)
Principally, the rate coefficient is proportional to the hydrolytic enzyme concentration, as well as
the intrinsic hydrolysis kinetics of the enzymes (Rittman and McCarty 2001). Some researchers
include the active biomass concentration within kh, this approach is convenient in that the
hydrolysis rate reduces to zero when there is no biomass present. However, this also implies that
the extracellular enzymes are linearly proportional to the biomass. This researcher was not able
2.1.4. Biofilm Thickness
Biofilm thickness, δ, is an important characteristic in the analysis of biofilm processes.
Thickness defines diffusional length and is necessary for determining fluid frictional and heat
transfer resistances. Biofilm thickness varies over a given substratum due to the morphological
features of the biofilm. The nonuniform thickness of biofilms increases fluid frictional
resistances and advective mass transfer at interfaces (Picologlou, et al., 1980). In slow moving,
nutrient rich water δ may exceed 30 mm. There is an absence of research pertinent to the
thickness of biofilms found in fixed film wastewater treatment systems, but Table 1 lists δ and
densities reported by several researchers for laboratory studies. There are three methods utilized
to measure δ,
(1) light microscopy
(2) in situ light microscopy, and
(3) confocal microscope imaging.
The light microscopy method described by La Motta (1976b) was used in this investigation. Due
to the disruptive effects of this method, Bakke and Ollson (1986) developed a nondestructive
method to measure the thickness in situ. The physical process is similar to that described for
light microscopy, but a correction factor of 1.36must be applied to δ to account for light
refraction through a glass cover. Confocal microscope imagery allows for the time series
production of a digital three-dimensional image of a biofilm by utilizing a high speed camera
coupled to a piezoelectric actuator mounted on the microscope’s objective lens. When using
light microscopy, δ is determined as the difference between a reference plane and the mean
Table 1. Reported Biofilm Thickness and Density (adapted from Characklis and Marshall 1990)
Reference Thickness, δ Density Biofilm Typea
(µm) (kg/m3)
Kornegay and Andrews, 1967 160-210 66-130 A
Hoehn and Ray, 1973 30-1300 20-105 B
Williamson and McCarty, 1976b 150-580 42-109 C
La Motta, 1976a 0-600 - A
Rittmann and McCarty, 1978 100 50b
A Rittmann and McCarty, 1980 119-126 5c
B
Rittmann and McCarty, 1981 0-125 5c
B
Trulear and Characklis, 1982 10-124 65 B
Trulear, 1983 36-47 17-47d
D
Bakke, 1986 0-60 27 D
a A-steady state, heterotrophic, mixed population; B-heterotrophic, mixed
population; C-steady state, nitrifying; D-steady state; E-steady state, Psuedomonas aeruginosa
b calculated assuming biofilm is 80% volatile solids
c calculated assuming biofilm is 50% carbon
d calculated from measured thickness corrected for refractive index of biofilm
2.1.5. Biofilm Density
Biofilm density and porosity vary with cross-sectional depth (Characklis and Marshall
1990; Zhang and Bishop 1994; Zhang and Bishop 2001). Zhang and Bishop (1994) measured a
porosity of 84 to 93% in the outermost layers, and a porosity of 58 to 67% in the innermost
layers of biofilm grown from a 350-700 mg COD/L feed (the feed was composed of meat
extract, yeast extract, peptone, trout chow, and nutrients). Consequently, biofilm becomes
denser and the pore volume becomes smaller along the biofilm depth. These researchers used a
modification of a microprobe designed by Fu (1993) to measure biofilm density in situ and make
inferences about density along a biofilm’s cross-sectional depth. However, to determine the
density of a biofilm sample of thickness δ, the dry biofilm mass on a known substratum area is
ρ= Xf "
δ (6)
Where,
ρ = biofilm mass density (ML-3
)
Xf ”
= area biofilm concentration(ML-2
)
Recall a discussion of the Zhang and Bishop’s (2001) techniques in section 2.1.2.1. Density
varies significantly in biofilms approaching 3000-micron δ, and no research was identified by
this investigator pertaining to biofilm thicknesses found in actual aerobic wastewater treatment
systems. However, Characklis and Marshall (1990) claims that biofilm density increases with
initial fluid shear stress. Biofilm density can be significantly higher in environments containing
suspended particulates and inorganic salts with low solubility that become integrated in the
biofilm (Characklis and Marshall 1990). The density, ρ, of a biofilm containing organic and
inorganic components can be expressed by (16).
ρ= ρ0V0 +ρiVi
V0 +Vi
(7)
Where,
ρo, ρi = wet density of organic and inorganic compounds, respectively (ML
-3
)
V0, Vi = volume of each component (L
3
)
The water content in biofilms containing organic and inorganic constituents may be affected
observed increasing biofilm density with time. This was attributed to EPS accumulation since
the cell mass remained constant.
2.2. DISSOLVED SUBSTRATE UTILIZATION BY BIOLOGICAL FILMS
When analyzing the rate of dissolved substrate utilization by biological films, it is
convenient to consider the process as three components:
(a) diffusion of substrate from the bulk of the liquid to the wastewater/biofilm interface,
(b) diffusion of the substrate within the porous EPS matrix, and
(c) biochemical reaction, or substrate consumption, by the bacterial cells (La Motta
1976a).
Several researchers have proposed models describing dissolved substrate utilization in biofilms
including La Motta (1974), Williamson (1973), Harremoës (1978), and Rittmann and McCarty
(1980). A detailed evaluation of the nomenclature and approach taken by each of the
aforementioned researchers will be discussed in this section.
In order to establish concentration gradients due to transport and biochemical reaction, an
“idealized biofilm” (Rittmann and McCarty 2001) with the following properties is analyzed
(a) the biofilm has a uniform biomass density, ρ (ML-3
)
(b) the biofilm has a locally uniform thickness, δ (L)
(c) due to mass-transport resistance, the dissolved substrate concentration available at the
biofilm surface (Ss) is less than that in the bulk liquid (Sb), unless external mass
Finally, it is necessary to consider two special biofilm cases. Figure 2 is a useful companion to
the following discussion. The first case is that of a fully penetrated, or thin, biofilm. Thin
biofilms allow for complete substrate penetration, i.e., at x = 0, S = Ss, and at x = δ,
dS
dx = 0 (no
substrate penetration at the wall). The second case is that of thick biofilms. In thick biofilms,
dissolved substrate is depleted within a distance δc, which is less than the film thickness δ, i.e., x
= δc,
dS
dx = 0 (no mass transport beyond x = δc) (La Motta 1976a).
Microbial Film
Filter Medium
δ
δc
x
Ss Sb
S
x x + Δx
Δx
2.2.1. External Diffusion and its Influence on Reactions at the Biofilm Surface
Several investigations have concluded that mass transfer resistances, external to the
biofilm, limit the rate of dissolved substrate removal by biofilm (Tomlinson and Snaddon 1966;
Kornegay and Andrews 1967; Maier, et al., 1967; La Motta 1976b; Trulear 1980; Siegrist and
Gujer 1985). Physical processes such as mass and energy transfer affect the overall rate of
substrate (dissolved and particulate) utilization in biofilm systems. The extent of this influence
depends on the characteristics of the system and must be evaluated for rational biofilm reactor
design (La Motta 1976b). The discussion contained within this section will describe the external
mass transfer process. Although aerobic wastewater treatment systems are operated under a
turbulent flow regime, biofilms have a thin laminar sublayer. Williamson and McCarty (1976a)
account for the nonplanar nature of biofilms by dividing the laminar sublayer into two portions.
The first is the thickness required to fill the nonplanar surface of the biofilm and the second is an
external laminar layer. The researchers delineate the layers L1 and L2, respectively. The sum of
the two thicknesses describes total thickness, L, of the laminar sublayer (i.e., L = L1 + L2).
Trulear (1980) observed an increase in glucose removal rate with an increased rotational
speed in a concentric cylinder reactor, typically referred to as a RotoTorque system. The
noteworthy portion of Trulear’s (1980) experiments was that the external mass transfer study
was carried out on biofilms with 110-micron δ. Trulear and Characklis (1982) also observed an
increase in glucose removal rate with an increased rotational speed in a RotoTorque reactor (δ =
112 microns). La Motta (1976b) conducted experiments with biofilm thicknesses ranging from 5
to 8 microns so that the influence of pore diffusion was negligible. Therefore, resistance to
by two orders of magnitude. This is important to the results contained herein because
exceedingly thin δ may result in poor bioflocculation.
The transport of dissolved substances across an interface, especially in turbulent flow,
can be described by the empirical external mass transfer equation (8).
N =kL
(
Sb−Ss)
(8)Where,
N = the rate of mass transfer, or flux (ML-2
t-1
)
kL = mass transfer coefficient (Lt
-1
)
Two extreme conditions can be created based on the magnitude of the mass transfer coefficient
(Frank-Kamenetskii 1969). Large values of kLallow the microorganisms forming the film to
receive the maximum concentration available in the bulk liquid (Sb). Here, the rate of dissolved
substrate disappearance is dependant upon the rate at which the microorganisms can utilize the
substrate. This limiting regime is the only case (assuming internal diffusional resistances have
been minimized) in which the intrinsic biofilm kinetics can be measured. Small values of kL lead
to a negligible Ss. In the ladder case, the rate of dissolved substrate disappearance is dependant
upon the rate at which substrate diffuses across the laminar sublayer from the bulk of the liquid
to the biofilm surface. La Motta (1976b) presented a mass conservation equation (9).
The amount of dissolved substrate consumed in the laboratory reactor can be obtained from a
mass balance on the substrate. In the case of a completely mixed reactor, such a balance
produces (10):
N = Q
A
(
Si −Se)
(10)Where,
N = rate of substrate consumption per unit film area (ML-2
t-1
)
Q = volumetric flow rate of substrate solution (L3
t)
A = total biofilm surface area (L2
)
Si = concentration of substrate in the influent stream (ML
-3
)
Se = concentration of substrate in the effluent stream (ML
-3
)
The amount of substrate transported to the film surface is defined by (8). In a completely mixed
reactor, the substrate concentration in the effluent stream is equal to the bulk substrate
concentration. Therefore, combining of equations (8) and (10) yields (11):
kL = Q
A
(
Si−Se)
Se−Ss(11)
A detailed description of internal diffusion and reaction in biofilms will be discussed in the next
section. However, a brief analysis of the subject is necessary to develop the discussion of
resistance to external mass transfer. Frank-Kamenetskii (1969) presented a solution to the
problem of diffusion and reaction within a porous catalytic slab (12), which can be utilized to
N = 2
n+1DeffkvSs n+1
( ) ⎡ ⎣⎢ ⎤ ⎦⎥ 1 2 (12) Where,
N = rate of reactant disappearance in the slab (Mt-1
L-2
)
n = intrinsic reaction order
Deff = effective diffusivity of reactant through the slab (L
2
t-1
)
kv = dissolved substrate kinetic constant (Mt
-1
L-3
)
La Motta (1976a), Harremoës (1978), and Trulear and Characklis (1982) have observed
zero-order removal kinetics in biofilm reactors with glucose (dissolved substrate) being
consumed by an undefined multispecies biofilm. Applying zero-order kinetics to (12), the
macroscopic, or observed, rate of substrate uptake rate will be given by (13).
N =⎡⎣2DeffkvSs⎤⎦
1
2 (13)
Equating (10) and (13) produces the concentration of substrate at the film surface (14).
Ss = Q
A
(
Si−Se)
⎡ ⎣⎢
⎤ ⎦⎥ 2
2Deffkv
(14)
Applying this equation to experimental results La Motta (1976b) proposed the following
kL =5.33×10
−4Ω0.657
(15)
Where, Ω is the external cylinder speed in a RotoTorque type reactor (rev/s). Therefore,
increasing velocity to a sufficiently high value will bring the reactor operation to the kinetic
regime.
2.2.2. Internal Diffusion and Reaction of Substrate in a Biological Film
There is an agreement throughout the literature attributing dissolved substrate
concentration reduction within a biofilm to molecular diffusion through the porous film matrix
and biochemical reaction within the biofilm. Diffusion is usually described by Fick’s first law
(3). Two methods have been used to describe the rate of dissolved substrate utilization by
biological films. Firstly, Williamson and McCarty (1976a) proposed Monod type saturation
kinetics (16) to describe the rate of dissolved substrate utilization by biofilms. Subsequently, the
researchers developed a “biofilm model” and sought verification empirically (Williamson and
McCarty 1976b). Extensive research efforts have been performed (Rittman and McCarty 1978;
Rittman and McCarty 1980a; Rittman and McCarty 1980b; Rittman and McCarty 1981) to
elaborate upon the dissolved substrate “biofilm model”. However, the procedure offers no basis
for the recognition of substrates that exhibit different kinetic characteristics.
rut =−
q∧XfSf
K +Sf
Where,
rut = “biofilm model” rate of substrate utilization
q = maximum specific substrate removal rate (MsMx
-1
t-1
)
Xf = active biomass density within the biofilm (MxL
-3
)
Sf = substrate concentration at that point in the film (MsL
-3
)
K = half-velocity coefficient (MsL
-3)
Secondly, empirical observations were used to characterize the rate of glucose, dissolved
substrate, utilization by an undefined multispecies biofilm. Such efforts were carried out by La
Motta (1976a) and Harremoës (1978). These studies revealed the rate of glucose removal can be
accurately described by zero-order kinetics, which disagrees with the general first-order
expression describing bioflocculation (2). A preceding description of diffusion and reaction in a
porous catalyst (12) has been applied to portray diffusion and reaction of dissolved substrates
within a biofilm (La Motta 1976a). Consider the continuity equation (17), neglecting the
convective terms:
∂Sf
∂t = Deff
∂2
Sf
∂x2 +r (17)
Where,
Deff = effective diffusivity of substrate in the film (L
2
t-1
)
r = rate of substrate utilization per unit film volume (MsL
-3
t-1
)
This equation (17) assumes microorganisms are uniformly dispersed throughout the biofilm
matrix, which implies that the film volume is directly proportional to the film active biomass.
Despite recent research indicating that biofilms are heterogeneous structures, the assumption is
realistic for thin (fully penetrating), steady state, heterotrophic, mixed population biofilms. An
assumption of an “idealized biofilm” is that there is uniform local δ. Therefore, only diffusion
normal to the biofilm surface is considered. After a stationary concentration profile is
established, steady state conditions can be assumed. Applying zero-order kinetics, the balance
can be reduced to (18).
kv Deff
= d
2 Sf
dx2 (18)
Integrating (18) with the boundary conditions separating thick and thin biofilms yields the
concentration gradient. The rate expression can be determined by recognizing that the reaction
rate equals the rate of mass transfer across the film surface (La Motta 1976a). The rate
corresponding to thin films, r, (complete substrate penetration) can be described by (19),
r=Akvδ (19)
and the rate corresponding to thick films, rT, (incomplete substrate penetration) can be described
by (20).
rT =A
(
2Deffkv)
1 2S
s
1
The effect of thick films is to mask the intrinsic reaction rate, as indicated by (20) the half-order
reaction rate.
2.2.3. Growth Kinetics in a Biofilm System
The studies of Monod (1949) have been used extensively in environmental engineering.
The resulting empirical equation (21) relates growth rate to the concentration of dissolved
substrate remaining in the system.
µ = µmax S Ks+S
(21)
Where,
µ = specific growth rate
µmax = asymptote representing maximum attainable growth rate
S = substrate concentration at time t in a batch reactor
Ks = half-velocity coefficient
However, several investigators including Gaudy, et al. (1967), Gaudy and Gaudy (1971), Gaudy,
et al. (1971), and Gaudy, et al. (1973) has concluded that the specific growth rate in a batch
reactor is controlled by the initial concentration of dissolved substrate. La Motta (1976c)
proposed a similar approach for biofilms, where the resulting function applied to a continuous
kv =kvmax
Si
Ks+Si
(22)
Here, kvmaxis an asymptote representing the maximum attainable intrinsic uptake rate coefficient,
and Si is the influent dissolved substrate concentration.
2.3. A COMPARISON OF BENCH SCALE REACTORS
When analyzing biofilm kinetics, several factors must be considered prior to the selection
of the experimental apparatus. The reactor must allow for the differentiation of each step in the
biofilm substrate consumption process, namely external diffusion of dissolved and particulate
substrate to the wastewater/biofilm interface, determination of a rate expression describing
dissolved substrate internal diffusion and biochemical reaction, and determination of a rate
expression describing bioflocculation. Ideally, the reactor will:
(a) be constructed of a material with adequate surface energy to promote biofilm growth,
(b) minimize suspended microorganism growth so the observed uptake rate can be
attributed to the biofilm,
(c) allow isothermal substrate utilization over a wide range of concentrations under
clearly defined residence time conditions and facilitate direct intrinsic rate
measurements (Carberry 1964),
(d) control fluid velocity in a sufficiently wide range to evaluate external diffusional
resistances (La Motta 1974),
(e) promote relatively uniform biofilm thickness,
(g) be hydrodynamically simple (i.e., completely submerged and mixed) so that the
theoretical solution of the combination of mass- and momentum balance equations is
possible.
Several laboratory reactors have been used in biofilm studies including inclined plates (Maier, et
al., 1967; Maier 1973; Logan 1987). A theoretical solution of diffusion and reaction at the plate
surface indicates that a diffusion boundary layer forms. The boundary layer thickness starts at
zero on the leading edge of the plate and increases proportionally to the square root of the
distance along the plate; the implications of this variation are a change in the reaction regime
from one end of the plate to the other. Chambré and Acrivos (1956) demonstrated that at the
leading edge the reaction is chemically controlled, and at the latter end the reaction is controlled
by mass transport. The intermediate portion is influenced by mixed chemical reaction and mass
transport. While the flat plate is an attractive alternative for modeling trickling filters
constructed of plastic modules, the apparatus complicates analysis when developing biofilm
kinetic models. Recent research efforts have utilized the radial flow reactor, RotoTorque reactor,
tubular reactor, and submerged rotating disc reactor, and this section will discuss each of these
reactors.
2.3.1. The Radial Flow Reactor
The radial flow reactor, as described by Fowler and McCay (1980), contains two parallel
discs separated by a narrow gap. Typically, there is a 500-micron gap. The test liquid is pumped
in at the center of one of the discs and flows out radially between the discs to a collection
manifold (Characklis and Marshall 1990). As the cross-sectional area available for flow
high shear stress occurs near the inlet and lowers near the outlet. There is tendency to plug flow
in the gap, which may influence the spatial colonization pattern on the substratum. Detached
cells have the opportunity to colonize the substratum downstream, which affect the desirable
characteristics (e, f, and g) of a biofilm reactor. Deficiencies in the calculation of shear stress
within this type of reactor may have influenced earlier interpretation of data (Fryer, et al., 1984).
2.3.2. The RotoTorque
The RotoTorque (IPA, Montana State University), or rotating annular reactor, is a
popular laboratory system for monitoring biofilm development and reaction kinetics because of
its sensitivity to changes in fluid frictional resistances. This type of reactor satisfies all of the
desirable characteristics (a-f) of a biofilm reactor. The reactor consists of two concentric
cylinders, a stationary outer cylinder and a rotating inner cylinder. However, La Motta (1974)
chose to rotate the external cylinder in an effort to avoid the formation of Taylor vortices. As
for any biofilm reactor, removable slides are an integral part of the laboratory process. In the
case of the rotating annular reactor, removable slides are placed on the inside wall of the outer
cylinder to permit biofilm sampling. Subsequently, the samples may be analyzed for thickness,
mass, and for biofilm chemical and microbial composition. Turbulence is induced to a degree
that promotes complete mixing. A complete description and theoretical analysis of the rotating
annular reactor are presented elsewhere (Kornegay 1969, La Motta 1974, Characklis and
2.3.3. The Submerged Rotating Disc Reactor: Theory and Analysis
The submerged rotating disc biofilm reactor, the RDBR, was used in this study. The
apparatus is an attractive alternative to evaluate the kinetics of particulate and dissolved substrate
disappearance in biofilms. The reactor was initially used by Gulevich (1967) to analyze the role
of diffusion in wastewater treatment processes. The reactor has also been used in the chemical
engineering literature to study the kinetics of heterogeneous catalysis and electrochemical
reaction (La Motta 1974). According to several investigators (Frank-Kamenetskii 1969; Levich
1962; Satterfield 1968) the equations describing the hydrodynamics and mass transfer under
laminar conditions are the simplest. The three-dimensional flow pattern causes the mass transfer
coefficient to be the same at all points on the surface, and the surface is uniformly accessible. If
the reactor is constructed with sufficiently small gaps between the rotating disc and the chamber
walls suspended growth can be minimized, and a completely mixed flow regime is easily
attained. La Motta, et al., (1982) successfully applied a RDBR to evaluate the effect of synthetic
polymers on biofilm formation. For the purpose of this investigation, it was necessary to
evaluate the effect of the ratio of biofilm surface area to liquid volumetric flow rate on the
concentration of substrate (dissolved or particulate) and inorganic particles remaining in the
effluent stream. The RDBR allowed for the construction of multiple chambers that could be
operated in parallel with variable liquid volumetric flow rates, while maintaining identical
influent substance concentrations. A detailed presentation of the experimental apparatus is
presented in later sections. However, material balances appropriate to the reactor shall be
The RDBR is a steady-state mixed flow reactor. The substance concentration is uniform
throughout and the following general mass balance is applicable:
input = output + reaction
In the RDBR, the influent and effluent liquid volumetric flow rate, Q, are equal due to
continuity. The influent dissolved substrate concentration, Si, (Ci in the case of particles) is
reduced by a reaction of rate, r (kg/s.m3
of film for dissolved substrates and kg/s.m2
of film for
particles). The concentration of the substance remaining in the effluent stream is denoted Se (Ce
in the case of particles). Applying zero-order kinetics to the general form of the RDBR mass
balance (recognizing that dissolved substrate consumption is dependent upon δ when working
with thin biofilms). The mass balance on such a reactor yields (23) for dissolved substrate
removal in thin biofilm systems.
Se=Si −kvδ A Q
⎛ ⎝⎜
⎞
⎠⎟ (23)
Recall the equation describing bioflocculation (2) and the assertion that bioflocculation is
a surface phenomenon, independent of film thickness. Appling this term to the general mass
balance equation describing the RDBR yields an expression that describes the disappearance of
Ce=
Ci+kp
A Q ⎛ ⎝⎜
⎞ ⎠⎟a
1+kp A Q ⎛ ⎝⎜
⎞ ⎠⎟
(24)
Here, Ci is the particle concentration suspended in the influent stream (mg/L).
2.4. EXISTING SUBSTRATE UTILIZATION MODELS
Biofilm models have commonly been used as simulation tools in engineering applications
and as research tools to identify and fill gaps in our knowledge of biofilm process (Noguera, et
al., 1999). Generally, engineering models incorporate simplifying assumptions to make them
practical. Biofilm models are perceived as complicated mathematical entities. Typically,
simplifications and assumptions used in one-dimensional models are not supported by
experimental observation. An International Association on Water Quality (IAWQ) specialist
meeting on biofilm modeling (Lake Bluff, IL, USA, 09-11-98) identified specific areas of
concern, including but not limited to, the fate of particulate substrates. Since this time, efforts
have been made to describe the role of EPS production (Boltz and La Motta, submitted for
publication 2005) on the removal of PCOD in fixed film processes. However, research to date
has attributed the mechanism of PCOD removal to hydrolysis. These projects further complicate
the biofilm analytical process and falsely describe the actual PCOD removal mechanism,