DEMOGRAPHIC RESEARCH
VOLUME 29, ARTICLE 4, PAGES 85-104
PUBLISHED 10 JULY 2013
http://www.demographic-research.org/Volumes/Vol29/4/ DOI: 10.4054/DemRes.2013.29.4
Descriptive Finding
Fertility reactions to the ‘Great Recession’ in
Europe: Recent evidence from order-specific data
Joshua R. Goldstein
Michaela Kreyenfeld
Aiva Jasilioniene
Deniz Karaman Örsal
© 2013 Joshua R. Goldstein et al.
This open-access work is published under the terms of the Creative Commons Attribution NonCommercial License 2.0 Germany, which permits use, reproduction & distribution in any medium for non-commercial purposes, provided the original author(s) and source are given credit.
1 Recent fertility development in Europe: Between trend reversal and economic crisis
86
2 Method: How can we account for the overall trend in fertility? 87
3 Results 88
4 Conclusions 92
References 94
Fertility reactions to the "Great Recession" in Europe:
Recent evidence from order-specific data
Joshua R. Goldstein1
Michaela Kreyenfeld2
Aiva Jasilioniene3
Deniz Karaman Örsal4
OBJECTIVE
This paper provides recent cross-national evidence of the impact of the great recession on fertility in Europe in the context of the recent decade.
METHODS
Using data from the Human Fertility Database (HFD), from Eurostat, and from the OECD database, we employ fixed-effects modeling to study how changes in unemployment rates have affected birth rates across Europe.
RESULTS
We find that countries that were hit hard by the recession show reduced fertility when compared with a continuation of recent trends, especially at younger ages.
CONCLUSION
Our results indicate a strong relationship between economic conditions and fertility. However, there is variation by region, age, and parity suggesting the importance of life course and institutional factors.
1 Max Planck Institute for Demographic Research, Germany.
2 Corresponding author. Max Planck Institute for Demographic Research, Germany.
E-mail: [email protected].
3
Max Planck Institute for Demographic Research, Germany.
1. Recent fertility development in Europe: Between trend reversal
and economic crisis
The relationship between economic conditions and fertility is one of the classic research questions in family demography. Since the work of Malthus, much of the empirical literature on the determinants of fertility dynamics has been motivated by the idea that economic hardship and labor market uncertainties will cause people to postpone or revise their fertility plans (e.g., Adserà 2004; Sobotka, Skirbekk, and Philipov 2011; Hofmann and Hohmeyer 2012; Schmitt 2012). Since the global financial crisis swept across Europe starting in 2007, there has been renewed interest in the question of whether increasing unemployment rates and growing labor market uncertainties will have repercussions for fertility development.
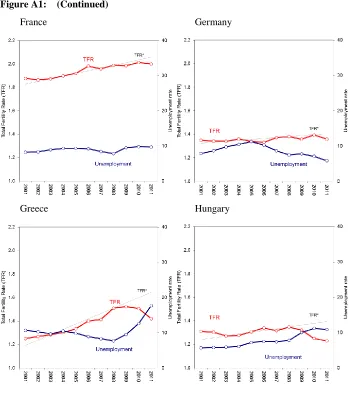
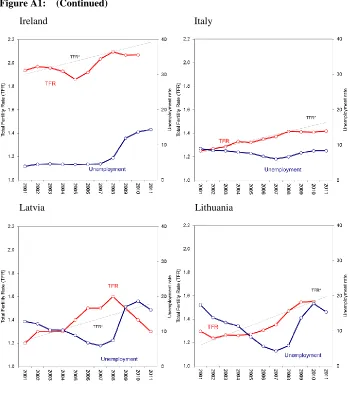
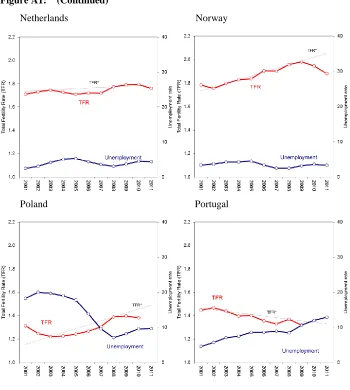
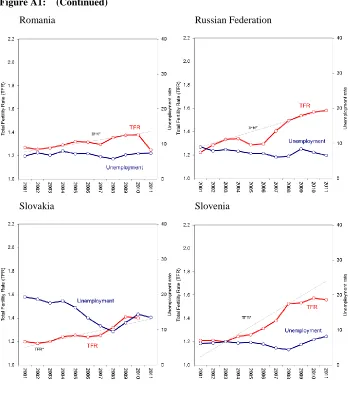
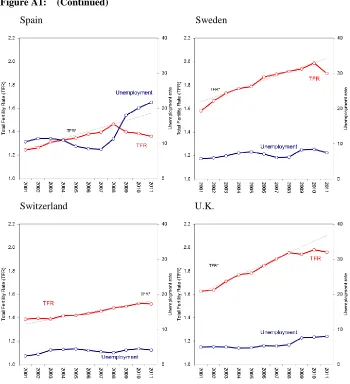
Unlike previous recessions and economic upheavals, the current recession is hitting Europe after a period during which the age at childbearing had continuously increased. Although a flattening out in the age at first childbearing has been reported for some European countries, it has leveled off at a relatively high level. Furthermore, the financial crisis hit Europe at a time when many countries had just started to see modest increases in their period fertility rates (Goldstein, Sobotka, and Jasilioniene 2009). In Greece, for example, an increase in the total fertility rate (TFR) that began at the turn of the century came to a halt in 2009 when the Greek economy started to crumble. From 2010 to 2011, Greece saw a decline in total fertility from 1.5 to 1.4. A similar reversal in positive fertility trends occurred in Bulgaria, Croatia, the Czech Republic, Estonia, Hungary, Romania and Spain. Most remarkable were the developments in Latvia: When unemployment rates skyrocketed, fertility rates plummeted from 1.6 in 2008 to only 1.3 in 2011. Meanwhile, the neighboring country of Lithuania, where unemployment increased at a similar pace, did not experience any strong reaction in annual birth rates over the same period. In Portugal and Italy, which were also harshly affected by the recession, the TFR has also not yet reacted to the surge in unemployment thus far. The Nordic countries of Europe, which were only mildly affected by the recession, saw an unexpected but very uniform decline in total fertility in 2011 (see Figure A1 in appendix).
(Thévenon 2011; Fagnani 2012). Ideational changes, particularly a resurgence of more traditional family values among the recent cohorts, have also been cited as potential reasons for the reversal in fertility trends (Goldstein, Kreyenfeld, and Rößger 2012). Thus, there appear to be important concomitant forces currently pushing fertility rates upwards, and these forces must be taken into account when assessing the impact of the economic recession. In order to understand how the economic recession is affecting fertility in Europe, it is important to consider how fertility would have developed in the absence of the crisis.
2. Method: How can we account for the overall trend in fertility?
In this paper, we seek to provide macro-level evidence on the role of the economic crisis in recent fertility dynamics in Europe. In our analysis, economic conditions are measured by the level of unemployment. Unemployment was chosen among other macroeconomic indicators as a proxy for the economic conditions and uncertainty faced by potential parents. For the purposes of this study, we have assembled fertility data for the period 2001–2010 and unemployment indicators for the period 2000–2010. The data come from the Human Fertility Database, Eurostat, and the OECD database. We wished to include more recent data from 2011 into our analysis, however many countries have updated their population counts in response to the new census estimates. For a few countries we were able to obtain corrected age- and order-specific fertility rates for the entire inter-censal period. For other countries, however, we were only able to retrieve corrected TFR-values for the period 2000–2011, but not corrected age-specific fertility data. Due to the break in the time series for many countries, we were unable to use fertility rates through 2011 in the multivariate model. However, we do report corrected TFR-values up to 2011 in the descriptive representation of general fertility trends in the appendix, when available.
The dependent variable in our investigations is the age-specific fertility rate fk(x,t)
for country k at age x and time t. In order to consider the underlying fertility trend associated with postponement, we insert a linear time trend. We also interact the time trend with country dummies in order to account for the fact that the tempo effect is likely to follow a different pattern across countries (for a similar specification used in the context of divorce rates, see Friedberg 1998). In order to depict the economic conditions in a country, we use the unemployment rate in the previous year. The dependent variable fk(x,t) and the major independent variable (lagged unemployment)
are transferred into log format to allow us to interpret the estimates as elasticity. This leads us to the following specification:
k t x k t x k x k x
k
x
t
t
unemp
f
(
,
))
, ,log(
)
1, ,,log(
Analyses are done for all birth orders combined, as well as separately for birth orders one to three. Unfortunately, we do not have order-specific data for all of the countries (see Table A1 in appendix). Therefore, the order-specific analyses had to be conducted with a restricted number of countries and a limited time frame. Having the five-year age-specific fertility rate as the dependent variable produces multiple observations per country and year. In order to correct for this, we use robust standard errors.
We have conducted various types of sensitivity analysis. Instead of the linear time trend, we have used a quadratic time trend. In another specification, we have used age-specific unemployment rates instead of overall unemployment rates. We have also conducted an analysis in which we used the TFR instead of the ASFR as a dependent variable. We have also experimented with the period of coverage, restricting the analysis to the most recent time period. It is noteworthy, however, that the overall pattern that we have obtained from these different specifications is similar to the one reported in this paper (see additional material).
3. Results
reduces first birth rates at all ages (except for age 40–44). However, the greatest impact is found at younger ages. The first explanation could be that young people can more easily revise their fertility plans. The second reason could be that unemployment is higher for younger people. In fact, analyses with age-specific unemployment rates (see additional material, Table 9) reveal similar patterns. However, youth unemployment and overall unemployment are strongly related, making it difficult to disentangle age-specific effects. The pattern for the higher birth orders is more irregular than that of first births. No association seems to be present between unemployment and second birth behavior at younger ages. At ages 30 and higher, people seem to revise their plans if unemployment rates increase. The third birth pattern (Panel 4) is very irregular. Some negative effects of unemployment on third birth rates are, however, visible at ages 35–44.
Figure 1: Estimated elasticities of unemployment on fertility, results by age and birth order
Panel 1: All births Panel 2: First birth
Figure 2: Estimated elasticities of unemployment on fertility, results by age and country cluster
Northern Europe Western Europe
Southern Europe Central and Eastern Europe
Note: Central and Eastern Europe: Belarus, Bulgaria, Czech Republic, Estonia, Latvia, Lithuania, Hungary, Poland, Romania,
4. Conclusions
The overall findings of this study suggest that the recent economic crisis has left an imprint on European period fertility patterns. For some countries, it put a halt to the positive fertility trend that had started to develop. In other countries, we see significant declines in period fertility. The results from the fixed-effects modeling that controls for differences between countries and trends over time showed that unemployment rates are closely associated with fertility development. In particular, fertility rates at younger ages seem to respond to adverse economic conditions. This finding is compatible with the idea that fertility plans can be revised more easily at younger ages than at ages closer to the biological limits of fertility. However, it is important to note that unemployment has reduced fertility in Southern Europe in particular. Southern European countries such as Italy and Spain are known for their unstable job entry patterns, and the recession has further exacerbated the problems young people face in this region (Müller and Gangl 2003; International Labour Organization 2012). A combination of the depth of the recession and the institutional arrangements in Southern countries appear to make the relationship between the economy and fertility the strongest in these regions.
When we look at the results for higher order births, the pattern becomes less clear-cut. It is only at older ages (30–44) that unemployment lowers second birth rates. At younger ages, unemployment does not seem to matter for second birth choices. We may be able to explain this pattern by considering the particularities of the population exposed to the risk of having a second or third child at younger ages. These women are usually a select group who are less educated and less career-oriented. Women who are at risk of having a second or third child at older ages are, to a greater extent, highly educated individuals who might respond more sensitively to economic downturns in making their reproductive choices (Kreyenfeld 2010). However, this is pure speculation; research on the micro-level would be useful to further investigate this issue.
References
Adserà, A. (2004). Changing fertility rates in developed countries. The impact of labor market institutions. Journal of Population Economics 17(1): 17-43.
doi:10.1007/s00148-003-0166-x.
Allison, P.D. (2009). Fixed Effects Regression Models. Thousand Oaks: Sage.
Andersson, G. (2000). The impact of labour-force participation on childbearing behaviour: Pro-cyclical fertility in Sweden during the 1980s and the 1990s. European Journal of Population 16(4): 293-333. doi:10.1023/A:100645 4909642.
Fagnani, J. (2012). Work-family life balance: Future trends and challenges. In: OECD (ed.). The Future of Families to 2030. OECD Publishing: 119-187.
Frejka, T. and Sardon, J.-P. (2007). Cohort birth order, parity progression ratio and parity distribution trends in developed countries. Demographic Research 16(11): 315-374. doi:10.4054/DemRes.2007.16.11.
Friedberg, L. (1998). Did unilateral divorce raise divorce rates? Evidence from panel data. The American Economic Review 88: 608-627. doi:10.2139/ssrn.2207. Goldstein, J.R., Kreyenfeld, M., and Rößger, F. (2012). Gibt es eine Trendumkehr in
der Kinderzahl nach Geburtsjahrgängen in Deutschland? [Did cohort fertility reverse its trend in Germany?]. Report commissioned to the Federal Ministry of Family Affairs, Senior Citizens, Women and Youth. Berlin.
Goldstein, J.R., Sobotka, T., and Jasilioniene, A. (2009). The end of “lowest-low” fertility? Population and Development Review 35(4): 663-699. doi:10.1111/ j.1728-4457.2009.00304.x.
Hofmann, B. and Hohmeyer, K. (2012). Perceived economic uncertainty and fertility. Journal of Marriage and Family 75: 503–521.
International Labour Organization (2012). Global employment trends for youth. Geneva: International Labour Organization (ILO).
Kohler, H.P., Billari, F.C., and Ortega, J.A. (2002). The emergence of lowest-low fertility in Europe during the 1990s. Population and Development Review 28(4): 641-680. doi:10.1111/j.1728-4457.2002.00641.x.
Müller, W. and Gangl, M. (2003). Transitions from Education to Work in Europe. The Integration of Youth into EU Labour Markets. Oxford University Press.
doi:10.1093/0199252475.001.0001.
Schmitt, C. (2012). A cross-national perspective on unemployment and first births. European Journal of Population 28(3): 303-335. doi:10.1007/s10680-012-9262-5.
Sobotka, T. (2004). Is lowest-low fertility in Europe explained by the postponement of
childbearing? Population and Development Review 30(2): 195-220. doi:10.1111/ j.1728-4457.2004.010_1.x.
Sobotka, T., Skirbekk, V., and Philipov, D. (2011). Economic recession and fertility in the Developed World. Population and Development Review 37(2): 267-306.
doi:10.1111/j.1728-4457.2011.00411.x.
Appendix
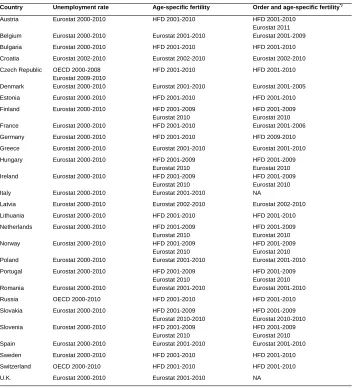
Table A1: Countries included in the analyses
Country Unemployment rate Age-specific fertility Order and age-specific fertility*)
Austria Eurostat 2000-2010 HFD 2001-2010 HFD 2001-2010
Eurostat 2011
Belgium Eurostat 2000-2010 Eurostat 2001-2010 Eurostat 2001-2009
Bulgaria Eurostat 2000-2010 HFD 2001-2010 HFD 2001-2010
Croatia Eurostat 2002-2010 Eurostat 2002-2010 Eurostat 2002-2010
Czech Republic OECD 2000-2008
Eurostat 2009-2010
HFD 2001-2010 HFD 2001-2010
Denmark Eurostat 2000-2010 Eurostat 2001-2010 Eurostat 2001-2005
Estonia Eurostat 2000-2010 HFD 2001-2010 HFD 2001-2010
Finland Eurostat 2000-2010 HFD 2001-2009
Eurostat 2010
HFD 2001-2009 Eurostat 2010
France Eurostat 2000-2010 HFD 2001-2010 Eurostat 2001-2006
Germany Eurostat 2000-2010 HFD 2001-2010 HFD 2009-2010
Greece Eurostat 2000-2010 Eurostat 2001-2010 Eurostat 2001-2010
Hungary Eurostat 2000-2010 HFD 2001-2009
Eurostat 2010
HFD 2001-2009 Eurostat 2010
Ireland Eurostat 2000-2010 HFD 2001-2009
Eurostat 2010
HFD 2001-2009 Eurostat 2010
Italy Eurostat 2000-2010 Eurostat 2001-2010 NA
Latvia Eurostat 2000-2010 Eurostat 2002-2010 Eurostat 2002-2010
Lithuania Eurostat 2000-2010 HFD 2001-2010 HFD 2001-2010
Netherlands Eurostat 2000-2010 HFD 2001-2009
Eurostat 2010
HFD 2001-2009 Eurostat 2010
Norway Eurostat 2000-2010 HFD 2001-2009
Eurostat 2010
HFD 2001-2009 Eurostat 2010
Poland Eurostat 2000-2010 Eurostat 2001-2010 Eurostat 2001-2010
Portugal Eurostat 2000-2010 HFD 2001-2009
Eurostat 2010
HFD 2001-2009 Eurostat 2010
Romania Eurostat 2000-2010 Eurostat 2001-2010 Eurostat 2001-2010
Russia OECD 2000-2010 HFD 2001-2010 HFD 2001-2010
Slovakia Eurostat 2000-2010 HFD 2001-2009
Eurostat 2010-2010
HFD 2001-2009 Eurostat 2010-2010
Slovenia Eurostat 2000-2010 HFD 2001-2009
Eurostat 2010
HFD 2001-2009 Eurostat 2010
Spain Eurostat 2000-2010 Eurostat 2001-2010 Eurostat 2001-2010
Sweden Eurostat 2000-2010 HFD 2001-2010 HFD 2001-2010
Switzerland OECD 2000-2010 HFD 2001-2010 HFD 2001-2010
U.K. Eurostat 2000-2010 Eurostat 2001-2010 NA
Note: *)
Age-specific fertility rates by birth order for which the Eurostat database is indicated as the source were computed by the authors using the Eurostat data on live births and population on January, 1st.
Sources: http://epp.eurostat.ec.europa.eu/portal/page/portal/statistics/search_database;
http://www.humanfertility.org;
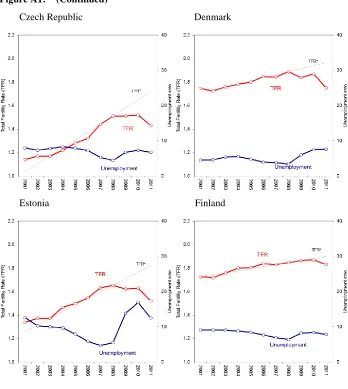
Figure A1: Total Fertility Rate (TFR) and unemployment rate by country
Austria Belgium
Figure A1: (Continued)
Czech Republic Denmark
Figure A1: (Continued)
France Germany
Figure A1: (Continued)
Ireland Italy
Figure A1: (Continued)
Netherlands Norway
Figure A1: (Continued)
Romania Russian Federation
Figure A1: (Continued)
Spain Sweden
Switzerland U.K.
Note: Belarus, Ukraine and Serbia are not represented, as we lack official unemployment rates for these countries. TFR* represents