University of New Orleans University of New Orleans
ScholarWorks@UNO
ScholarWorks@UNO
University of New Orleans Theses and
Dissertations Dissertations and Theses
12-17-2010
Nonattribution Properties of JPEG Quantization Tables
Nonattribution Properties of JPEG Quantization Tables
Punnya Tuladhar University of New Orleans
Follow this and additional works at: https://scholarworks.uno.edu/td
Recommended Citation Recommended Citation
Tuladhar, Punnya, "Nonattribution Properties of JPEG Quantization Tables" (2010). University of New Orleans Theses and Dissertations. 1261.
https://scholarworks.uno.edu/td/1261
Nonattribution Properties of JPEG Quantization Tables
A Thesis
Submitted to the Graduate Faculty of the
University of New Orleans
in partial fulfillment of the
requirements for the degree of
Master of Science
in
Computer Science
by
Punnya Tuladhar
B.E. Pulchowk Campus, Nepal, 2004
ACKNOWLEDGMENT
CONTENTS
List of Figures
iv
Abstract
v
Chapter 1:
Introduction
1
Chapter 2:
Design of the Study
2.1 Structure of JPEG
2.2 Source Data
3
3
6
Chapter 3:
Analysis
9
References
12
Appendices
A: FFDBExtractor.java
B: FFC4Extractor.java
C: hash_calc.sh
D: Format.java
E: freq.sh
F: ExifExtractor.java
G: qtable statistics by make
H: qtable statistics by model
I: qtable statistics by photoshop
version
J: htable statistics by make
K: htable statistics by model
L: htable statistics by photoshop
version
13
13
14
16
16
17
17
19
20
21
21
22
23
LIST OF FIGURES
ABSTRACT
In digital forensics, source camera identification of
digital images has drawn attention in recent years. An image
does contain information of its camera and/or editing software
somewhere in it. But the interest of this research is to find
manufacturers (henceforth will be called make and model) of a
camera using only the header information, such as quantization
table and huffman table, of the JPEG encoding.
Having done a research on around 110, 000 images, we
reached to state that “For all practical purposes, using
quantization and huffman tables alone to predict a camera make
and model isn't a viable approach”. We found no correlation
between quantization and huffman tables of images and makes of
camera. Rather, quantization or huffman table is determined by
the quality factors like resolution, RGB values, intensity etc.
of an image and standard settings of the camera.
KEYWORDS:
CHAPTER 1:
INTRODUCTION
Attribution is a critical component of forensic analysis
both in the physical and the digital world. One particular
attribution problem, source camera identification for digital
images, has received quite a bit of attention in recent years.
Indeed, a number of research results point rather unambiguously
that it is possible to reliably identify the source camera based
on artifacts that are a function of the inherent sensor
imperfections of each camera.
A related problem is that of source camera model
identification: given an image, identify the model and/or
manufacturer of the source camera. It is increasingly becoming
accepted wisdom that a camera model fingerprint could be derived
using only the header information, such as the quantization and
Huffman tables, of the JPEG encoding. The underlying assumption
is that camera manufacturers produce unique implementations for
each camera model (or at least each line of camera models) and
that such uniqueness can be readily observed from the basic
parameters of the image. The idea is conceptually similar to an
approach routinely used by network security tools to map out
network services.
Farid’s original study of images from 204 cameras that
started this line of work. This was followed up by a largescale
statistical study which concluded that “while the JPEG
small set of possible cameras”. Some tools, such as JPEGSnoop
maintain a collection of “camera fingerprints”.
CHAPTER 2:
DESIGN OF THE STUDY
Our research comprised of 4 different phases
1. Extraction of quantization and huffman tables.
2. Hash Generation
3. Extraction of Exif data.
4. Statistical Analysis
In the first phase, we extracted quantization and huffman
tables
from
109,774
images
downloaded
from
http://domex.nps.edu/corp/files/govdocs1/
.
The
resulted
quantization tables were ~204,000 in number whose hash values
were generated using md5sum in second phase. Then exif
information of images and source camera or software were
extracted; which were combined with the hash values and resulted
data set was used for statistical analysis.
2.1 Structure of JPEG
Fig#1: JPEG File Organization
Every JPEG file starts with binary value 'FFD8', ends
with binary value 'FFD9'. There are several binary FFXX data in
JPEG data, they are called "Marker", and it means the period of
JPEG information data. FFD8 means SOI(Start of image), FFD9
means EOI(End of image). Basic format of Marker is below.
FFXX + Length + Data
Details of each marker can be found at itut81.pdf
documentation.
If there is a marker like this
It means this marker(FFC1) has 000C(equal 12)bytes of data
including the length [2 bytes] of this length specifier too. It
follows only 10 bytes of data after 000C.
In JPEG format, some of markers describe data, then
SOS(Start of stream) marker placed. After the SOS marker, JPEG
image stream starts and terminates with EOI marker. Real data
starts with the marker FFDA.
Exif:
Basically, Exif file format is the same as JPEG file
format. Exif inserts some of image/digicam information data and
thumbnail image to JPEG in conformity to JPEG specification.
Exif data starts with the marker FFE1 and contains information
like make, model of camera, resolution, size, dates, software
etc.
Quantization Table:
Quantization table is an 8*8 table which controls the
quantization quality in a jpeg image. Typically, an image has 2
(or 3) such tables. It is generated by cameras or photo editing
softwares for each image which differ depending on both the
quality settings of cameras and on the standards which cameras
or softwares follow.
In image header, this table starts with the marker FFDB
in the format as shown below:
FFDB + LL + 00 + 64 byte data + 01 + 64 byte data + 02 + …
of data (0 or 1) and destination identifier (0 to 3) at the
decoder. LL is total length including length of LL.
Huffman Table:
Huffman coding is used in jpeg compression. Huffman
tables generated by cameras and photo editing softwares. This
table starts with marker FFC4 in the format as below:
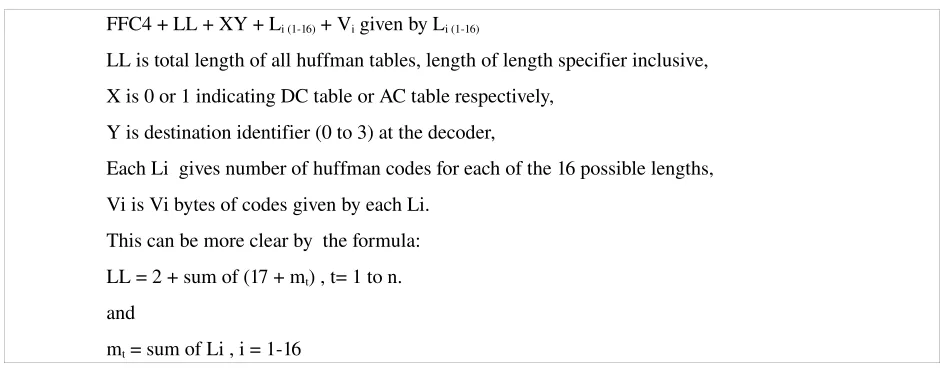
FFC4 + LL + XY + Li (116) + Vi given by Li (116)
LL is total length of all huffman tables, length of length specifier inclusive, X is 0 or 1 indicating DC table or AC table respectively,
Y is destination identifier (0 to 3) at the decoder,
Each Li gives number of huffman codes for each of the 16 possible lengths, Vi is Vi bytes of codes given by each Li.
This can be more clear by the formula: LL = 2 + sum of (17 + mt) , t= 1 to n.
and
mt = sum of Li , i = 116
2.2 Source Data
########### ffdb_hash ############
0656ffc785f02947576c3b671c50db9b 000107.00.ffdb 54e464a3c6056f015f7da1e86a0086f8 000107.01.ffdb c30a1cdefc2d7ef4914b2bfdbf33743c 000108.00.ffdb 6307cac23d9b65d1c95cd695a22d1f26 000108.01.ffdb 0656ffc785f02947576c3b671c50db9b 000109.00.ffdb 54e464a3c6056f015f7da1e86a0086f8 000109.01.ffdb 0656ffc785f02947576c3b671c50db9b 000110.00.ffdb 54e464a3c6056f015f7da1e86a0086f8 000110.01.ffdb
Fig#2: ffdb_hash
########## ffdb_hash_formatted #########
000107.jpg 00 0656ffc785f02947576c3b671c50db9b 000107.jpg 01 54e464a3c6056f015f7da1e86a0086f8 000108.jpg 00 c30a1cdefc2d7ef4914b2bfdbf33743c 000108.jpg 01 6307cac23d9b65d1c95cd695a22d1f26 000109.jpg 00 0656ffc785f02947576c3b671c50db9b 000109.jpg 01 54e464a3c6056f015f7da1e86a0086f8 000110.jpg 00 0656ffc785f02947576c3b671c50db9b 000110.jpg 01 54e464a3c6056f015f7da1e86a0086f8
Fig#3: ffdb_hash_formatted
################ data_set_final #################### 795043.jpg,0.056,,NIKON,d1x,CS2Mac
875003.jpg,0.3072,, ,,3.0
983694.jpg,0.4456,,KODAK,z740,CSWin 800534.jpg,3.24,, ,,
417505.jpg,1.6875,, ,,CSWin 542256.jpg,0.0702,60%, ,,
Fig#5: data_set_final
Then joining 3 data sets – ffdb_hash_formatted, ffdb_hash_freq
and data_set_final, a master data set for statistical analysis
was created.
############# ffdb_data_freq #####################
000ac84aa6fc3ae3c76872e55dc50c1d 164933.jpg 0.1 null null null null 01 388 000ac84aa6fc3ae3c76872e55dc50c1d 164935.jpg 0.1 null null null null 01 388 000ac84aa6fc3ae3c76872e55dc50c1d 173364.jpg 0.0 null null null null 01 388 000ac84aa6fc3ae3c76872e55dc50c1d 195389.jpg 0.3 null null null null 01 388 000ac84aa6fc3ae3c76872e55dc50c1d 251934.jpg 0.0 null olympus ud600 null 01 388 000ac84aa6fc3ae3c76872e55dc50c1d 253354.jpg 8.0 null sony dsch9 null 01 388 000ac84aa6fc3ae3c76872e55dc50c1d 255338.jpg 0.2 null panasonic dmclz2 null 01 388
Fig#6: ffdb_data_freq
CHAPTER 3:
ANALYSIS
The file “ffdb_hash_formatted” contains ~204K
quantization tables whose distribution looks like
−
9% one table/image
−
89% two tables/image
−
2% three tables/image
Cumulative Distribution Function graph and class size vs
frequency graph drawn for obtained results are given below.
Fig#8: freq_vs_class
There were 1,419 unique ones whose distribution chart is
Our preliminary findings are:
The most frequent table accounted for over 10% of all
occurences.
The top 10 most frequent tables accounted for almost 50% of
all occurrences.
The top 200 accounted for over 95%.
The 200
thranked table occurred 53 times (with several
different makes).
There were less than 450 unique and less than 200 duplicate
tables.
There were a total of 1,060 tables(0.5% of total) that
occurred 20 times or less (and had any hope as identifying
features).
Considering table uniqueness by make (fraction of tables
observed only from the specific make):
1 make (Seiko) had no makespecific table.
5 had only 1030% of their tables as makespecific.
6 had 4055%.
For both quantization and huffman tables, statistics based
on make, model and photoshop version were calculated (see
appendix) with the help of our generated files – ffdb_data_freq
and ffc4_data_freq.
REFERENCES
[1] ITUT81.pdf
[2] http://park2.wakwak.com/~tsuruzoh/Computer/Digicams/exif
e.html
[3] http://www.fileformat.info/format/jpeg/egff.htm
[4] http://impulseadventure.com
[6] H. Farid, “Digital Image Ballistics from JPEG Quantization”,
Technical Report, TR2006583, Dartmouth College, Computer
Science.
[7] H. Farid, “Digital Image Ballistics from JPEG Quantization:
A Followup Study”, Technical Report, TR2008638, Dartmouth
College, Computer Science.
//if data stream started , end parsing if(first.equals("ff") && sec.equals("da")){ break; } else if(first.equals("ff") && sec.equals("db")){ int times = length/64; //size of quantization table = 64 bytes for(int n = 0; n < times; n++){
fosdb = new FileOutputStream(name + "_formatted"); } catch (FileNotFoundException e) {
e.printStackTrace(); }
}
public static void main(String[] args){ Format hc = new Format(args[0]); System.out.println("Reformatting ..."); hc.reFormat();
System.out.println("Done."); }
private void reFormat(){ try {
String line = null;
while((line = jpegSource.readLine()) != null){ String[] parts = line.split(" "); String[] segs = parts[1].split("\\.");
String hash_freq = segs[0] + ".jpg " + segs[1] + " " + parts[0] + "\n"; fosdb.write(hash_freq.getBytes());
}
jpegSource.close(); jpegSource = null; fosdb.close(); fosdb = null; } catch (IOException e) {
e.printStackTrace(); }
} }
E: freq.sh
############ freq.sh ################
sort | awk '{print $1}' | awk '{c[$1]++} END{for(i in c){printf "%4d\t%s\n", c[i], i}}' | sort rn
F: ExifExtractor.java
import java.io.BufferedReader; import java.io.File;
import java.io.FileNotFoundException; import java.io.FileOutputStream; import java.io.IOException; import java.io.InputStreamReader;
L: htable statistics by photoshop version