The Optimization of Machining Parameters Using the
Taguchi Method for Surface Roughness of AISI 8660
Hardened Alloy Steel
Ali Riza Motorcu
Çanakkale Vocational College, Çanakkale Onsekiz Mart University, Turkey
The surface roughness in the turning of AISI 8660 hardened alloy steels by ceramic based cutting tools was investigated in terms of main cutting parameters such as cutting speed, feed rate, depth of cut in addition to tool’s nose radius, using a statistical approach. Machining tests were carried out with PVD-coated ceramic cutting tools under different conditions. An orthogonal design, signal-to-noise ratio and analysis of variance were employed to find out the effective cutting parameters and nose radius on the surface roughness.
The obtained results indicate that the feed rate was found to be the dominant factor among controllable factors on the surface roughness, followed by depth of cut and tool’s nose radius. However, the cutting speed showed an insignificant effect. Furthermore, the interaction of feed rate/depth of cut was found to be significant on the surface finish due to surface hardening of steel. Optimal testing parameters for surface roughness could be calculated. Moreover, the second order regression model also shows that the predicted values were very close to the experimental one for surface roughness.
© 2010 Journal of Mechanical Engineering. All rights reserved.
Keywords: ceramic cutting tools, surface roughness model, Taguchi method, hardened alloy steel
0 INTRODUCTION
Hard turning is a process, in which materials in the hardened state (50 to 70 HRC) are machined with single point cutting tools. This has become possible with the availability of the new cutting tool materials (cubic boron nitride and ceramics). A large number of operations are required to produce the finished product and if some of the operations can be combined, or eliminated, or can be substituted by the new process, product cycle time can be reduced and productivity can be improved. The traditional method of machining the hardened materials includes rough turning, heat treatment followed by the grinding process. Hard turning eliminates a series of operations required to produce the component and thereby reducing the cycle time and hence resulting in productivity improvement [1] and [2].
The advantages of hard tuning are higher productivity, reduced set up times, surface finish closer to grinding and the ability to machine complex parts. Various work materials which can be machined by the hard turning process include high speed steels, die steels, bearing steels, alloy steels, case hardened steels, white cast iron and
alloy cast iron. Rigid machine tools with adequate power, very hard and tough tool materials with appropriate tool geometry, tool holders with high stiffness and appropriate cutting conditions are some of the prerequisites for hard turning. This paper deals with the hard turning of hardened alloy steel (AISI 8660) with physical vapour deposition (PVD) coated ceramic tools.
On the other hand, in metal cutting processes, the desired cutting parameters are determined either by experience or by using a handbook which does not ensure the selected parameters to be optimal. To determine the optimal cutting conditions, reliable mathematical models have to be formulated to associate the cutting parameters with cutting performance in terms of statistical approach. In literature, Response Surface Methodology (RSM) has been used by some researchers for the analysis and prediction of tool life or surface roughness [2] and [5] to [13]. Moreover, some works on machining of carbon or alloy steel have given to a full or fractional factorial design [14] to [16]. However, few of the existing researchers have applied a Taguchi approach to cross examine the impact of individual factors and factor interactions although the Taguchi method is relatively simple and can be used for optimizing different production stages with few experimental runs [17] to [26]. The aim of the present study is, therefore, to investigate the surface roughness in turning of the AISI 8860 steel (50 HRC) with the aid of a Taguchi design of experiment, using PVD-coated ceramic cutting tools under various cutting conditions. In addition, an analysis of variance is employed to find out effective cutting parameters on surface finish.
1 EXPERIMENTAL PROCEDURE
The machine used for the turning tests was a Johnford TC35 Industrial type of computer numeric control (CNC) lathe machine. The lathe equipped with variable spindle speed from 50 to 3500 rpm, and a 10 KW motor drive was used for the tests.
The insert was coated using a PVD method. The coating substance took place on the mixed ceramic substrate and PVD-TiN coated mixed ceramic with a matrix of Al2O3 (70%):TiC (30%) +TiN, which is called KY4400 grade [27]. The insert types were SNGA 120408 and SNGA 120412 (KY4400). The cutting tool’s types used in the experiments are listed in Table 1. All tools are commercially available inserts according to the ISO code and the cutting tools were supplied by Kennametal Inc. for the machining tests.
The material used throughout this work was an AISI 8660 steel. AISI 8660 is a high carbon, chromium-nickel-molybdenum alloy steel with high hardness and strength and is suitable for springs and axle shafts. Table 2 shows the chemical composition (wt. %) of AISI 8660 steel [28].
The work pieces were in the form of cylinders of 52 mm diameter and 220 mm length. The standard heat treatment process to specimens was applied under water condition and the average hardness measured was about 50 HRC. These bars are machined under dry condition. The work material bars were trued, centered and cleaned by removing a 0.3 mm depth of cut from the outside surface, prior to the actual machining tests.
The surface roughness of the work piece was measured by a stylus instrument. The equipment used for measuring the surface roughness was a surface roughness tester, MAHR Perthometer-M1 type of portable. The surface roughness measures used in this paper is the arithmetic mean deviation of the surface roughness of profile, Ra. In collecting the surface
roughness data of the shaft with the surface profilometer, three measurements were taken along the shaft axis for each sample with the measurements being about 120o apart.
Table 1. The cutting tool’s type used in the experiments
Types of cutting tools Tool designation Chemical composition of coating materials Cutting fluids
Coated ceramic tools (KY4400) SNGA 120408 Ti (C,N)+TiC+Al203+TiN Dry
Coated ceramic tools (KY4400) SNGA 120412 Ti (C,N)+TiC+Al203+TiN Dry
Table 2. Chemical composition of AISI 8660 steel [28]
Chemical composition of AISI 8660 alloy (wt.%)
C Mn Si S Cr Ni Mo Balance
2 METHODOLOGY
2.1 Application of the Taguchi Method
One method presented in this study is an experimental design process called the Taguchi design method. Taguchi design is a set of methodologies by which the inherent variability of materials and manufacturing processes has been taken into account at the design stage. The application of this technique had become widespread in many US and European industries after the 1980s.
The beauty of the Taguchi design is that multiple factors can be considered at once. Moreover, it seeks nominal design points that are insensitive to variations in production and user environments to improve the yield in manufacturing and the reliability in the performance of a product. Therefore, not only controlled factors can be considered, but noise factors as well. Although similar to the design of experiment (DoE), the Taguchi design only conducts the balanced (orthogonal) experimental combinations, which makes the Taguchi design
even more effective than a fractional factorial design [24].
The philosophy of Taguchi is broadly applicable. He proposed that engineering optimization of a process or product should be carried out in a three-step approach, i.e., system design, parameter design, and tolerance design (Figure 1) [26].
In system design, the engineer applies scientific and engineering knowledge to produce a basic functional prototype design, which includes the product design stage and the process design stage. In the product design stage, the selection of materials, components or tentative product parameter values are included. As to the process design stage, the analysis of processing sequences, the selections of production equipment or tentative process parameter values are involved. Since system design is an initial functional design, it may be far from optimum in terms of quality and cost. The objective of the parameter design is to optimize the settings of the process parameter values for improving performance characteristics and to identify the product parameter values under the optimal process parameter values [26].
Fig. 1: Taguchi design procedure [24]
Determine suitable working levels of the design factors
Select proper Orthogonal Array (OA)
Run experiments
Analyze data
Identify optimum condition
Confirmation runs
Determine the results of parameter design by tightening the tolerance of
the significant factors
Parameter design
In addition, it is expected that the optimal process parameter values obtained from the parameter design are insensitive to the variation of environmental conditions and other noise factors. Therefore, the parameter design is the key step in the Taguchi method in achieving high quality without increasing the costs [26].
The classical parameter design developed by Fisher is complex and not easy to use. In particular, a large number of experiments have to be carried out when the number of the process parameters increases. To solve this task, the Taguchi method uses a special design of orthogonal arrays to study the entire parameter space with a small number of experiments only. A loss function is then defined to calculate the deviation between the experimental value and the desired value. Taguchi recommends the use of the loss function to measure the performance characteristic deviating from the desired value.
The value of the loss function is further transformed into a signal-to-noise (S/N) ratio . Usually, there are three categories of the performance characteristic in the analysis of the
S/N ratio, that is, the lower-the-better, the higher-the-better, and the nominal-the-better. The S/N
ratio for each level of process parameters is computed based on the S/N analysis [26].
Regardless of the category of the performance characteristic, the larger S/N ratio corresponds to the better performance characteristic. Therefore, the optimal level of the process parameters is the level with the highest
S/N ratio . Furthermore, a statistical analysis of variance (ANOVA) is performed to see which process parameters are statistically significant. With S/N and ANOVA analyses, the optimal combination of the process parameters can be predicted [26].
Finally, a confirmation experiment is conducted to verify the optimal process parameters obtained from the parameter design.
Nominal-is-the-best:
2 / T 10 log
y
y S N
s
. (1)
Larger-is-the-better (maximize):
2 1 1 1 / L 10 log n
i i
S N
n y
. (2)
Smaller-is-the-better (minimize):
2 1 1 / S 10 log n i
i
S N y
n
, (3)where y, is the average of observed data, sy2 is
the variance of y, n is the number of observations and y is the observed data. Notice that these S/N
ratios are expressed on a decibel scale. We would use S/NT if the objective is to reduce variability
around a specific target, S/NL if the system is
optimized when the response is as large as possible, and S/NS if the system is optimized
when the response is as small as possible. Factor levels that maximize the appropriate S/N ratio are optimal. The goal of this research was to produce minimum surface roughness (Ra) in a turning
operation. Smaller Ra values represent better or
improved surface roughness. Therefore, a smaller-the-better quality characteristic was implemented and introduced in this study [26].
The Taguchi method, which is a powerful tool in the design of an experiment, is used to optimize the turning parameters for effective machining of AISI 8660 hardened alloy steel [23]. This method recommends the use of S/N
ratio to measure the quality characteristics deviating from the desired values. To obtain optimal testing parameters, the-lower-the-better quality characteristic for machining the AISI 8660 steel was taken due to the measurement of the surface finish. The S/N ratio for each level of testing parameters was computed based on the
S/N analysis. This design is sufficient to investigate the four main effects and the influence of their interactions on the surface roughness. With S/N ratio analysis, the optimal combination of the testing parameters could be determined.
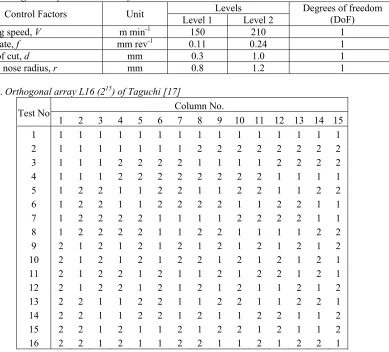
Table 3. Assignment of the levels to the factors
Control Factors Unit Level 1 Levels Degrees Level 2 (DoF) of freedom
Cutting speed, V m min-1 150 210 1
Feed rate, f mm rev-1 0.11 0.24 1
Dept of cut, d mm 0.3 1.0 1
Tool’s nose radius, r mm 0.8 1.2 1
Table 4. Orthogonal array L16 (215) of Taguchi [17]
Test No Column No.
1 2 3 4 5 6 7 8 9 10 11 12 13 14 15
1 1 1 1 1 1 1 1 1 1 1 1 1 1 1 1 2 1 1 1 1 1 1 1 2 2 2 2 2 2 2 2 3 1 1 1 2 2 2 2 1 1 1 1 2 2 2 2 4 1 1 1 2 2 2 2 2 2 2 2 1 1 1 1 5 1 2 2 1 1 2 2 1 1 2 2 1 1 2 2 6 1 2 2 1 1 2 2 2 2 1 1 2 2 1 1 7 1 2 2 2 2 1 1 1 1 2 2 2 2 1 1 8 1 2 2 2 2 1 1 2 2 1 1 1 1 2 2 9 2 1 2 1 2 1 2 1 2 1 2 1 2 1 2 10 2 1 2 1 2 1 2 2 1 2 1 2 1 2 1 11 2 1 2 2 1 2 1 1 2 1 2 2 1 2 1 12 2 1 2 2 1 2 1 2 1 2 1 1 2 1 2 13 2 2 1 1 2 2 1 1 2 2 1 1 2 2 1 14 2 2 1 1 2 2 1 2 1 1 2 2 1 1 2 15 2 2 1 2 1 1 2 1 2 2 1 2 1 1 2 16 2 2 1 2 1 1 2 2 1 1 2 1 2 2 1
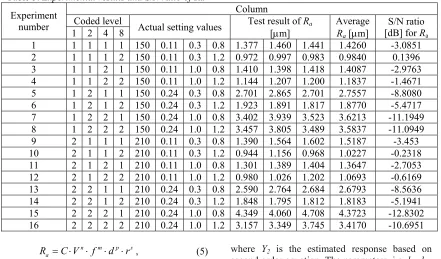
Table 5 shows the sets of experiments of L16 (215) orthogonal array with experimental results of surface roughness height Ra along with
their arithmetic average values and S/N ratio (dB) [23].
According to the Taguchi quality design concept an L16 (215) orthogonal array has been used to determine the S/N ratio (dB), ANOVA and ‘F’ test values for indicating the most significant parameters affecting the machining performance criteria, i.e. surface roughness, Ra.
The main purpose of the ANOVA is to investigate the design parameters and to indicate which parameters significantly affect the quality characteristic. This analysis helps to find out the relative contribution of machining parameter in controlling the response of turning operation. The optimal parametric setting value will directly influence the objective function for determining the minimum cost at the optimal policy [23].
2.2 Mathematical Models
The experimental results would be used to build first-order and second-order models by the multiple regression method. The purpose of developing the mathematical models is to understand the combined effect of involved parameters and to facilitate the optimization of the machining process [29] and [30]. The following relationship is commonly used for representing the mathematical models:
( , , , )
Y V f d r , (4)
Table 5. Experimental results and S/N ratio of Ra
Experiment number
Column Coded level
Actual setting values Test result of [m] Ra Average R
a [m]
S/N ratio [dB] for Ra 1 2 4 8
1 1 1 1 1 150 0.11 0.3 0.8 1.377 1.460 1.441 1.4260 -3.0851
2 1 1 1 2 150 0.11 0.3 1.2 0.972 0.997 0.983 0.9840 0.1396
3 1 1 2 1 150 0.11 1.0 0.8 1.410 1.398 1.418 1.4087 -2.9763
4 1 1 2 2 150 0.11 1.0 1.2 1.144 1.207 1.200 1.1837 -1.4671
5 1 2 1 1 150 0.24 0.3 0.8 2.701 2.865 2.701 2.7557 -8.8080
6 1 2 1 2 150 0.24 0.3 1.2 1.923 1.891 1.817 1.8770 -5.4717
7 1 2 2 1 150 0.24 1.0 0.8 3.402 3.939 3.523 3.6213 -11.1949
8 1 2 2 2 150 0.24 1.0 1.2 3.457 3.805 3.489 3.5837 -11.0949
9 2 1 1 1 210 0.11 0.3 0.8 1.390 1.564 1.602 1.5187 -3.453
10 2 1 1 2 210 0.11 0.3 1.2 0.944 1.156 0.968 1.0227 -0.2318
11 2 1 2 1 210 0.11 1.0 0.8 1.301 1.389 1.404 1.3647 -2.7053
12 2 1 2 2 210 0.11 1.0 1.2 0.980 1.026 1.202 1.0693 -0.6169
13 2 2 1 1 210 0.24 0.3 0.8 2.590 2.764 2.684 2.6793 -8.5636
14 2 2 1 2 210 0.24 0.3 1.2 1.848 1.795 1.812 1.8183 -5.1941
15 2 2 2 1 210 0.24 1.0 0.8 4.349 4.060 4.708 4.3723 -12.8302
16 2 2 2 2 210 0.24 1.0 1.2 3.157 3.349 3.745 3.4170 -10.6951
n m p s
a
R C V f d r , (5) where C is a constant and n, m, p and s are the exponents. The above function can be represented in linear mathematical form as follows:
ln ln .ln .ln .ln
.ln ln
a
R C n V m f p d s r
. (6)
The constants and exponents C, n, m, p
and s can be determined by the method of least squares. The first-order linear model, developed from the equation, can be represented as follows:
4 4 3 3 2 2 1 1 0 0
1 y b x bx b x b x b x
Y , (7)
where Y1 is the estimated response based on first
order equation, and y is the measured surface roughness on a logarithmic scale, x0 = 1 (dummy
variable), x1, x2, x3 and x4 are logarithmic
transformations of cutting speed, feed rate, depth of cut and nose radius respectively,
is the experimental error and ‘b’ values are the estimates of corresponding parameters. If this model is not sufficient to represent the process, then the second order model will be developed [29] and [30].The general second-order model is as follows:
2 0 0 1 1 2 2 3 3 4 4 12 1 2 23 2 3 14 1 4 24 2 4
13 1 3 34 3 4 , Y Y b x b x b x b x b x
b x x b x x b x x b x x b x x b x x
(8)
where Y2 is the estimated response based on
second order equation. The parameters, i.e. b0, b1,
b2, b3, b4, b12, b23, b14 are to be estimated by the
method of least squares [29] and [30].
3 RESULTS AND DISCUSSION
3.1 The Taguchi Method Evaluation Results
The experimental results for Ra illustrated
in Table 4 are analysed with the Minitab 15.0 software. This table shows an experimental lay-out with calculated S/N ratios for cutting tests of the AISI 8660 steel.
calculating all four combinations of interaction of two control factors.
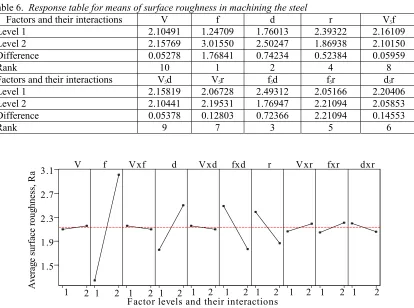
The main effects and their interaction plots of the surface roughness of the alloyed steels for
S/N ratios are shown in Fig. 2.
Optimal testing conditions of these control factors can be easily determined from this graph. A response graph showed the change of the S/N
ratio when the setting of the control factor was changed from one level to the other. The best surface finish value was at the higher S/N values in the response graphs. It could be seen in Fig.2 that the optimum testing conditions for the tested samples became V1-f1-d1-r2 for main control factors in this study. Based on the S/Nratio, the optimal testing parameters for surface roughness were cutting speed at level1, feed rate at level 1, depth of cut at level 1, and the tool’s nose radius at level 2 (Table 7).
The analysis of variance (ANOVA) was used to investigate which design parameters
significantly affect the surface quality. Examination of the calculated values of variance ratio (F), which is the variance of the factor divided by the error variance for all control factors showed a much higher influence of factor
f, d, and a high influence of factor r on the surface roughness of the alloy steel (Table 8). The F
value of each design parameters was calculated. The change of the cutting speed in the range given Table 8 had no significant effect on the roughness of machining the steel because of the lower F-value. In addition, the interaction between the f x d showed a much higher influence while the interactions of V5f, V5d, V5r, f5r and d5r
showed no significant influence on the surface roughness of tested materials. The F table 0.05 (1, 5) equals to 6.60 at 95% confidence level. Thus, based on the level of confidence (95 %), the main factors of f, d, r and interaction of f5d were
significant while other factors such as V and V5f,
V5d, V5r and f5r were pooled as well.
Table 6. Response table for means of surface roughness in machining the steel
Factors and their interactions V f d r V5f
Level 1 2.10491 1.24709 1.76013 2.39322 2.16109
Level 2 2.15769 3.01550 2.50247 1.86938 2.10150
Difference 0.05278 1.76841 0.74234 0.52384 0.05959
Rank 10 1 2 4 8
Factors and their interactions V5d V5r f5d f5r d5r
Level 1 2.15819 2.06728 2.49312 2.05166 2.20406
Level 2 2.10441 2.19531 1.76947 2.21094 2.05853
Difference 0.05378 0.12803 0.72366 2.21094 0.14553
Rank 9 7 3 5 6
dxr fxr
Vxr r
fxd Vxd d
Vxf f
V
2 1 2 1 2 1 2 1 2 1 2 1 2 1 2 1 2 1 2 1 3.1
2.7
2.3
1.9
1.5
A
ve
ra
ge
s
ur
fa
ce
r
oug
hne
ss
, R
a
Factor levels and their interactions
Table 7. Optimum level of control factors
Control factors Notation Optimum level Optimum value
Cutting speed [m min-1] V 1 150
Feed rate [mm rev-1] f 1 0.11
Depth of cut [mm] d 1 0.3
Tool’s nose radius [mm] r 2 1.2
Table 8. Analysis of variance for surface roughness in machining the alloy steel
Source Degree of freedom (DoF) Seq SS Adj. SS Adj. MS F P
V 1 0.0011 0.0011 0.0011 0.26 0.634
f 1 12.5086 12.5086 12.5086 287.70 0.000
d 1 2.2045 2.2045 2.2045 50.70 0.001
r 1 1.0978 1.0978 1.0978 25.25 0.004
V 5 f 1 0.0142 0.0142 0.0142 0.33 0.593
V 5 d 1 0.0115 0.0115 0.0115 0.27 0.628
V 5 r 1 0.0656 0.0656 0.0656 1.51 0.274
f 5 d 1 2.0945 2.0945 2.0945 48.17 0.001
f 5 r 1 0.1015 0.1015 0.1015 2.33 0.187
d 5 r 1 0.0847 0.0847 0.0847 1.95 0.222
Residual Error 5 0.2174 0.2174 0.0435
Total 15 18.4115
3.2 Mathematical Models for Surface Roughness
The correlations between the main factors in machining the alloy steel were obtained by multiple regressions. The regression equation is;
0.21 0.00088 13.6
1.06 1.31 .
a ave
R V f
d r
(9)
This equation shows that the surface roughness increased with the increase of feed rate, depth of cut, cutting speed but decreased with increasing the nose radius. The feed rate has the most dominant effect on machining the materials, followed by the depth of cut. However, no significant effect was observed for cutting speed. The first order model can explain the variation to the extent of 85.9%. To increase the sensitivity of this model and provide more accurate prediction of surface roughness in the cutting process, the second order model was postulated. This model can also enable an insight the interaction effects on the surface finish. The model equation is given by:
0.49 0.0072 6.64 3.22 1.01 0.0153 0.00256 0.0107 15.9 6.13 1.04 .
a ave
R V f d
r Vf Vd Vr
fd fr dr
(10)
This equation also indicates that the feed rate has the dominant effect on surface roughness value by PVD-coated cutting tools. The regression coefficient indicates the variation to the extent of 98.8% for this case. The results of measured and predicted values for surface roughness are shown in Table 9. The experimental values are very close to the predicted values, especially for the second order model.
Table 9. Experimental results and their theoretical values with residuals for models
Exp.
No. V f d r
Average
Ra, [m]
First order model Second order model Mean surface
roughness [m] (Theoretical)
Residual [m]
Mean surface roughness
[m] (Theoretical)
Residual [m]
1 150 0.11 0.3 0.8 1.4260 1.1115 0.3144 1.4591 -0.0331
2 150 0.11 0.3 1.2 0.9840 0.5876 0.3963 1.0770 -0.0930
3 150 0.11 1.0 0.8 1.4087 1.8539 -0.4452 1.2786 0.1300
4 150 0.11 1.0 1.2 1.1837 1.3300 -0.1463 1.1876 -0.0039
5 150 0.24 0.3 0.8 2.7557 2.8799 -0.1242 2.6036 0.1520
6 150 0.24 0.3 1.2 1.8770 2.3560 -0.4790 1.9029 -0.0259
7 150 0.24 1.0 0.8 3.6213 3.6223 -0.0009 3.8703 -0.2490
8 150 0.24 1.0 1.2 3.5837 3.0984 0.4852 3.4607 0.1228
9 210 0.11 0.3 0.8 1.5187 1.1643 0.3543 1.5266 -0.0080
10 210 0.11 0.3 1.2 1.0227 0.6404 0.3821 0.8885 0.1341
11 210 0.11 1.0 0.8 1.3647 1.9067 -0.5420 1.4536 -0.0889
12 210 0.11 1.0 1.2 1.0693 1.3828 -0.3135 1.1065 -0.0371
13 210 0.24 0.3 0.8 2.6793 2.9327 -0.2533 2.7902 -0.1109
14 210 0.24 0.3 1.2 1.8183 2.4088 -0.5905 1.8335 -0.0151
15 210 0.24 1.0 0.8 4.3723 3.6751 0.6972 4.1644 0.2078
16 210 0.24 1.0 1.2 3.4170 3.1512 0.2657 3.4987 -0.0817
Kumar et al. [22] obtained about 4.8 to 5.5
m surface roughness value when machining the hardened EN 24 steel up to 45 HRC using ceramic based ceramic tool under similar conditions. The present work indicates that Ra value was about 1.5 to 2.0 mdue to selecting the optimum cutting conditions. It means that the improvement in the roughness was approximately 250 to 300% for the present work because of increasing the tool’s nose radius up to 1.2 mm. However, the surface roughness increased with increasing the depth of cut. Similar results were obtained for machining AISI 8620 steel and EN 24T (290 BHN) steel by carbide cutting tool [22] and [33]. Previous study carried out by Sahin et al. [4] indicate that cutting speed and depth of cut was a negative effect on the surface roughness model using response surface methodology. However, depth of cut had little effect on the roughness due to machining of the carbon steel. For the present study, feed rate and depth of cut were the most effective parameters among the other controllable factors. Feed rate comes from the theoretical base but the second one might be due to the surface hardening of alloyed steel in addition to containing Cr (51%) and Mn (93%) here, thereby decreasing the ductility of the steel.
It could be concluded that surface finish was more directly affected by the feed rate, depth of cut, tool’s nose radius while the cutting speed remained a constant.
4 CONCLUSIONS
The following conclusions may be drawn from various cutting conditions in machining the hardened AISI 8660 steels by ceramic cutting tools.
Feed rate exerted the greatest effect on surface roughness, followed by depth of cut. The surface roughness increased with increasing feed rate, depth of cut and decreased with increasing the tool’s nose radius. The cutting speed had no significant effect on the tested materials. Optimal testing parameters for surface roughness could be calculated. The second order regression model shows that the experimental values were very close to the predicted values of surface roughness. The interaction of f5d had a much higher
significant effect due to surface hardening of steel while interactions of V5f, V5d, V5r, f5r and d5r had
5 REFERENCES
[1] Grzesik, W., Wanat, T. (2006). Surface finish generated in hard turning of quenched alloy steel parts using conventional and wiper ceramic inserts, International Journal of Machine Tools and Manufacture, vol. 46, p. 1988-1995.
[2] Siler, H.R., Vila, C., Rodríguez, C.A., Abellán, J.V. (2009). Study of face milling of hardened AISI d3 steel with a special design of carbide tools. Int J. Adv. Manuf. Technol., vol. 40, p. 12-25.
[3] Koelsch, J. (1992). Beyond TiN new tool coatings pick up where TiN left off.
Manufacturing Engineering, p. 27-32. [4] Sahin, Y., Motorcu, A.R. (2004). Surface
roughness prediction model in machining of carbon steel by CVD coated cutting tools.
American Journal of Applied Science, vol. 1, no. 1, p. 12-17.
[5] Horng, J.T., Liu, N.M., Chiang, K.T. (2008). investigating the machinability evaluation of hadfield steel in the hard turning with Al2O3/TiC mixed ceramic tool based on the response surface methodology. Journal of Materials Processing Technology, vol. 208, p. 532-541.
[6] Sahin, Y., Motorcu, A.R. (2005). Surface roughness model in machining of mild steel by coated cutting tools. Materials and Design, vol. 26, p. 321-326.
[7] Alauddin, M., El Baradie, M.A. (1997). Tool life model for end milling steel. Mater. Process. Technol., vol. 68, p. 50-59.
[8] Choudhury, I.A., El Baradie, M.A. (1997). Surface roughness prediction in turning of high-strength steel by factorial design of experiments. Mater. Process. Technol., vol. 67, p. 55-61.
[9] Sundaram, R.M., Lambert, B.K. (1981). Mathematical models to predict surface finish in fine turning of steel, Part II, Int. J. Product. Res., vol. 19, p. 557-564.
[10] Mital, A., Mehta, M. (1998). Surface finish prediction models for fine turning. Int. J. Product Res., vol. 26, no. 12, p. 1861-1876. [11] Escalona, P.M., Cassier, Z. (1998).
Influence of the critical cutting speed on the surface finish on turned steel. Wear, vol. 218, p. 103-109.
[12] Fnides, B., Aouici, H., Yallese, M.A. (2008). Cutting forces and surface roughness in hard turning of hot work steel X38CrMoV5-1 using mixed ceramic.
Mechanika, vol. 70, no. 2, p. 73-78.
[13] Lalwani, D.I., Mehta, N.K., Jain, P.K. (2008). Experimental investigations of cutting parameters influence on cutting forces and surface roughness in finish hard turning of MDN250 steel. Journal of Materials Processing Technology, vol. 206, p. 167-179.
[14] El Baradie, M.A. (1997). Surface roughness prediction in the turning of high strength steel by factorial design of experiments.
Mater. Process. Technol., vol. 67, p. 55-61. [15] Arbizu, I.P., Perez, C.J.L. (2003). Surface
roughness prediction by factorial design of experiments in turning processes. Mater. Process. Technol., vol. 143-144, p. 390-396. [16] Abouelatta, O.B., Mádl, J. (2001). Surface
roughness prediction based on cutting parameters and vibrations in turning operations. Mater. Process. Technol., vol. 118, p. 269-277.
[17] Roy, R.K. (1990). A Primer on the Taguchi method. Competitive Manufacturing Series, New York, USA.
[18] Yang, W.H, Tarng, Y.S. (1998). Design optimization of cutting parameters for turning operations based on the Taguchi method. Mater. Process. Technol., vol. 84, p. 122-129.
[19] Nian, C.Y., Yang, W.H., Tarng, Y.S. (1999). Optimization of turning operations with multiple performances characteristic.
Mater. Process. Technol., vol. 95, p. 90-96. [20] Kopac, J., Bahor, M., Sokovic, M. (2002).
Optimal machining parameters for achieving the desired surface roughness in fine turning cold pre-formed steel work processing.
International Machine Tools and Manufacture, vol. 42, p. 707-716.
[21] Davim, J.P. (2001). A note on the determination of optimal cutting conditions for surface finish obtained in turning using design of experiments. Mater. Process. Technol., vol. 116, p. 305-308.
Int. J. Refractory Metals and Hard Material, vol. 21, p. 109-117.
[23] Manna, A., Salodkar, S. (2008).
Optimization of machining conditions for effective turning of E0300 alloy steel.
Journal of Materials Processing Technology, vol. 203, p. 147-153.
[24] Zhang, J.Z., Chenb, J.C., Kirby, E.D. (2007). Surface roughness optimization in an end-milling operation using the taguchi design method. Journal of Materials Processing Technology, vol. 184, p. 233-239.
[25] Aslan, E., Camuşcu, N., Birgören, B. (2007). Design optimization of cutting parameters when turning hardened AISI 4140 steel (63 HRC) with Al2O3 + TiCN mixed ceramic tool. Materials and Design, vol. 28, p. 1618-1622.
[26] Nalbant, M., Gökkaya, H., Sur, G. (2007). Application of Taguchi method in the optimization of cutting parameters for surface roughness in turning. Materials and Design, vol. 28, p. 1379-1385.
[27] Kennametal Hertel (2001). Lathe Tools-Master Catalogue. Kennametal Hertel AG, Fürth, p. 28-49.
[28] Şahin, Y. (2001). The machinability of hardened AISI 8660 alloy steel with modern coated cutting tools. Gazi University Journal of Science, vol. 14, no. 4, p. 52-61.
[29] Singh, D., Rao, P.V. (2007). A surface roughness prediction model for hard turning process. Int. J. Adv. Manuf. Technol., vol. 32, p. 1115-1124.
[30] Motorcu, A.R., Şahin, Y., Kılıçlı, V., Erdoğan, M. (2005). Modeling the surface roughness in machining of AISI 4140 steel.
International Scientific and Technical Conference, Modern Problems of Mechanical Engineering and Instrument Making, Baku, p. 238-244.
[31] Suresh, P.V.S., Venkateswara, R.P., Desmukh, S.G. (2002). A genetic algorithmic approach for optimization of the surface roughness prediction model.
International Journal of Machine Tools and Manufacture, vol. 42, p. 675-680.
[32] Darwish, S.M. (2001). The impact of the tool materials and the cutting parameters on surface roughness of supermet 718 Nickel alloy. Mater. Process. Technol., vol. 97, p. 10-18.
[33] Feng, C.X. (2001). An experimental study of the impact of turning parameters on surface roughness. Proceedings of the 2001 Industrial Engineering Research Conference, paper no. 2036.
![Fig. 1: Taguchi design procedure [24]](https://thumb-us.123doks.com/thumbv2/123dok_us/8952778.1862146/3.539.116.419.382.644/fig-taguchi-design-procedure.webp)