in the population sciences published by the Max Planck Institute for Demographic Research Konrad-Zuse Str. 1, D-18057 Rostock · GERMANY www.demographic-research.org
DEMOGRAPHIC RESEARCH
VOLUME 21, ARTICLE 22, PAGES 647-680
PUBLISHED 03 NOVEMBER 2009
http://www.demographic-research.org/Volumes/Vol21/22/ DOI: 10.4054/DemRes.2009.21.22
Descriptive Findings
Rates of induced abortion in Denmark according
to age, previous births, and previous abortions
Marie-Louise H. Hansen
Ditte Mølgaard-Nielsen
Lisbeth B. Knudsen
Niels Keiding
© 2009 Marie-Louise H. Hansen et al.
This open-access work is published under the terms of the Creative Commons Attribution NonCommercial License 2.0 Germany, which permits use, reproduction & distribution in any medium for non-commercial purposes, provided the original author(s) and source are given credit.
1.1 The Danish setting 648
1.2 Background 649
1.2.1 Previous abortions 649 1.2.2 Previous abortions and previous births 650 1.2.3 Previous births 651
2 Data and methods 652
2.1 Study population 652
2.2 Covariates 654
2.3 Descriptive methods 654 2.4 Logistic regression methods 655
3 Descriptive analyses 655
3.1 Age-specific abortion rates 656
3.2 Abortion parity 657
3.3 Fertility parity 659
4 Logistic regression analyses 661
4.1 Modelling data 661
4.2 The logistic regression model 662
5 Discussion 664
5.1 Validity of data 664 5.1.1 The abortion rates in 1996 665
5.2 Fertility parity 665
5.3 Abortion parity 668
5.4 Urbanisation 669
5.5 Family situation 669
6 Conclusion 669
References 670
Rates of induced abortion in Denmark according to age, previous
births, and previous abortions
Marie-Louise H. Hansen1
Ditte Mølgaard-Nielsen2
Lisbeth B. Knudsen3
Niels Keiding4
Abstract
Background: The effects of various socio-demographic determinants on a woman’s risk of having an abortion are relatively well-documented, less attention has however been given to the effect of previous abortions and births. Objective: The objective is to study the risk of having an induced abortion among Danish women according to previous births, previous abortions and a number of other demographic characteristics. Data and methods: From the Fertility of Women and Couples Dataset, we obtained data on the number of live births and induced abortions by year (1982-2001), age (20-39), county of residence, and family situation. Logistic regression analysis was used to estimate the influence of the explanatory variables on the probability of having an abortion in a relevant year. Main findings and conclusion: A woman’s risk of having an abortion increases with the number of previous births and previous abortions. Some interactions were found in the way a woman’s risk of abortion varies with calendar year, age and fertility parity. The risk of an abortion for women with no children decreases, while the risk of an abortion for women with children increases during the study period. Furthermore, the risk of an abortion decreases with age, but relatively more so for women with children than for childless women.
1 M.Sc. in Public Health, Department of Biostatistics, Institute of Public Health, University of Copenhagen,
Denmark. E-Mail: [email protected]
2 M.Sc. in Public Health, Department of Biostatistics, Institute of Public Health, University of Copenhagen,
Denmark. E-Mail: [email protected].
3 Professor, Department of Sociology, Social Work and Organization, Aalborg University, Denmark.
E-Mail: [email protected].
4 Professor, Department of Biostatistics, Institute of Public Health, University of Copenhagen, Denmark.
1. Introduction
During the last couple of decades rates of induced abortion have been declining in most western countries, which today have lower rates that other parts of the world; 19 per 1000 women aged 15-44 (Sedgh et al. 2007). Although abortion rates are declining, more knowledge on why women are having abortions is needed if one wants to lower the rates further and to help guide policy-making and reproductive health campaigns. A number of abortion determinants such as age, marital status, and ethnicity have been identified, and their impact on a woman’s risk of having an abortion are relatively well-documented, both internationally and for Denmark (e.g. Barrett, Peacook, and Victor 1998; Henshaw 1990; Rasch et al. 2008; Bankole, Singh, and Haas 1998). Less attention has been given to the association between a woman’s choice of induced abortion and her previous births and abortions5. Especially information on the effect of the number of previous abortions is relatively sparse, probably due mainly to lack of relevant data, particularly at population level. The scope of this article is to examine the possible link between previous abortions and births on Danish women’s risk of having an abortion.
1.1 The Danish setting
In 1970 and 1973, the acts regulating the access to pregnancy termination became importantly liberalised in regards to the characteristics of women entitled to abortion and the act from 1973 is, with only minor changes, still applicable in Denmark. Under this act, all women above the age of 18 have the right to an induced abortion at a public hospital, cost-free and on demand, provided the woman is domiciled in Denmark and the induced abortion can be performed before the end of the 12th week of pregnancy. Induced abortions after the 12th week require special permission (Act No. 350 of 13 June 1973 on the interruption of pregnancy; Rasmussen 1994).
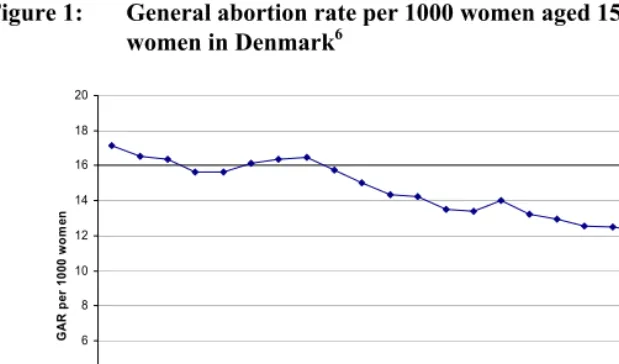
The general abortion rate, calculated for 15-49 year old women, peaked in Denmark in 1975 with 23.7 abortions per 1,000 women and has been declining almost constantly ever since: In 2006, the general abortion rate was 12.2 abortions per 1,000 women, cf. Figure 1. Hence, the general abortion rate almost halved from 1975 to 2006.
Figure 1: General abortion rate per 1000 women aged 15-49 from 1982-2006, women in Denmark6
0 2 4 6 8 10 12 14 16 18 20 198 2 198 3 198 4 198 5 198 6 198 7 198 8 198 9 199 0 199 1 199 2 199 3 199 4 199 5 199 6 199 7 199 8 199 9 200 0 200 1 200 2 200 3 200 4 200 5 200 6 G A R p er 10 00 w o m en 1.2 Background
The main focus of this paper is to examine if and how a woman’s previous abortions and births influence the risk of an induced abortion. We have only identified a few analyses, which consider both characteristics (e.g. Bettarini and D’Andrea 1996; Millar, Wadhera, and Henshaw 1997; Russo, Horn, and Schwartz 1992), whereas a large number of articles discuss either a woman’s abortion parity or fertility parity when she is having an abortion. In this section, we give a brief overview of selected relevant literature.
1.2.1 Previous abortions
Studies on women’s abortion parity are often focused on an interest in how many women have repeat abortions, originating from an early concern about the extent to which some women would ‘use/abuse’ the extended pregnancy termination rights as a substitute for contraceptive means. In the first years after the right to induced abortion on demand was ratified in Denmark, the National Board of Health compiled figures
regarding repeat abortions based on record linkage. These linkages revealed that approximately 5% of the women having an abortion in one calendar year had another termination within the next 12 months, calculated from the date of the initial abortion. When the period was extended to 24 months, the proportion of repeaters almost doubled, indicating that the repeaters in the second year were other women than the ones in the first year (National Board of Health - various years). A hospital-based study from Norway found, that one out of every seven women who had an abortion in 1987 returned for a repeat abortion within 4 years after the initial abortion (Skjeldestad 1994).
According to published statistics, 38% of induced abortions in Denmark in 1987 were performed on women who had already had one or more prior abortions. In the same year, the proportion of repeat abortions was approximately 20% in England/Wales, France and the Netherlands. In Sweden and Hungary, the proportion was 35% and 50% respectively (Henshaw 1990). According to a Canadian study by Millar, Wadhera, and Henshaw (1997), women with one or more previous abortions were more likely to have a further abortion in a given year compared to women who had never had an abortion, regardless of the women’s age. Furthermore, the study shows that approximately 20% of all women seeking induced abortion in the period between 1975 and 1993 had had at least one previous abortion; 15.5% had had just one, 3.1% two, and 0.9% had three or more previous abortions (Millar, Wadhera, and Henshaw 1997). An American study from 1995 found that repeat abortion-seekers were more often older, younger at first pregnancy, black and single compared to first-time abortion-seekers (Westfall and Kallail 1995). Some of the reported differences might be due to respondents’ bias regarding the willingness to report about abortions.
1.2.2 Previous abortions and previous births
1.2.3 Previous births
Based on published statistics for Denmark, Knudsen and Wielandt (2000) demonstrated that the proportion of abortion-seeking women with no children has increased since the mid-1970s, where about one third of the abortion-seeking women had no children, to 1990s where almost half the abortion-seeking women had no children. The authors interpreted this as a trend where induced abortions today in Denmark are used as a means of postponing the onset of childbearing rather than ending childbearing. However, as this article shows, these findings must be interpreted with caution because of the increase in the average age of women having their first child.
A US-study revealed that the majority of women who had an abortion between 2000 and 2001, had given birth at least once before. Furthermore, when adjusting for age, the abortion rates for women with no children were lower than for women with one or more children. When pregnant, women with two or more children were more prone to choose abortion than those with only one child (Jones, Darroch, and Henshaw 2002). A Danish study from 2003 compared pregnant women seeking induced abortion with pregnant women attending antenatal care and found similar associations between previous births and the choice of induced abortion: After adjusting for age, pregnant women with no children had the lowest risk of an abortion and women with two or more children had the highest risk when compared to women with one child (Rasch, Knudsen, and Gammeltoft 2005).
Findings from an earlier Norwegian study on women who either gave birth or had an induced abortion between 1979 and 1990 indicated that the majority of abortion-seeking women were either unmarried, childless women or married with more than two children. Further, when analysing the impact of marital status, age, and fertility parity on the decision whether to have an abortion or not, the study found that regardless of marital status and age, the risk of having an abortion increased significantly with parity order; that is, the number of previous births (Skjeldestad et al. 1994). It should be noted, though, that this study covers 12 years and that the attitudes towards abortion might have changed during that period.
2. Data and methods
2.1 Study population
The study population consists of women in Denmark born since 1961, who had an abortion during the years between 1982 and 2001, and all data stem from a number of national public registers. The information on induced abortion was retrieved from the Registry of Legally Induced Abortions and the National Discharge Register (Andersen et al. 1999), while information on the births was retrieved from the Medical Birth Register and the civil registration in the country. By means of the unique Danish civil registration number, the data on abortions and births were linked to data on various socio-demographic characteristics of the same women, retrieved from national registers. Together these data constitute The Fertility of Women and Couples Dataset (FWCD), which includes information on any woman in fertile age (13-49 years) living in Denmark in the period from 1980-2001, collected annually from Statistics Denmark. A compilation of events of both fertility and abortions was made when creating the FWCD, which was originally established for analyses of reproductive patterns at the Centre for Demographic Research at the University of Southern Denmark (Knudsen and Murphy 1999).
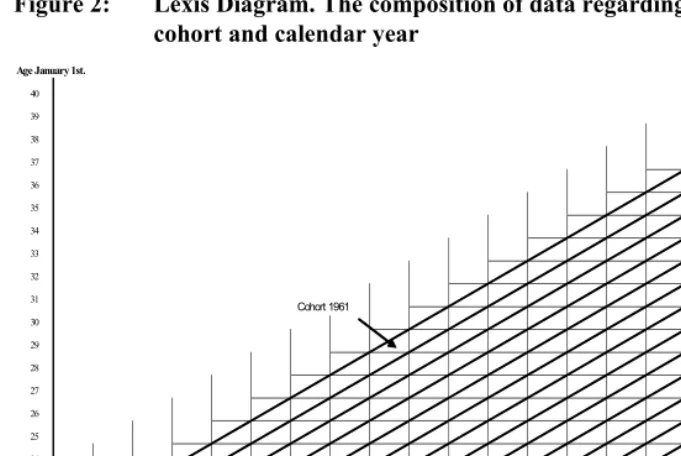
The analysis concentrates on women older than 20 years old (birth cohorts 1961 to 1981), who were residents in Denmark on 1 January in a given year in the time period from 1 January 1982 to 31 December 2001. The reason for including only women above age 20 is due to an assumption that abortions among teenagers call for considerations and discussions of a somewhat different character than what regards the same event among women of higher ages. Furthermore, the study population only comprises native born Danish women7.
7 Native Danish women are women where at least one of the parents is a Danish citizen and born in Denmark,
Figure 2: Lexis Diagram. The composition of data regarding the women’s age, cohort and calendar year
Age January 1st.
40 40
39 39
38 38
37 37
36 36
35 35
34 34
33 33
32 32
31 31
30 30
29 29
28 28
27 27
26 26
25 25
24 24
23 23
22 22
21 21
20 20
1/1 1982 1/1 1983 1/1 1984 1/1 1985 1/1 1986 1/1 1987 1/1 1988 1/1 1989 1/1 1990 1/1 1991 1/1 1992 1/1 1993 1/1 1994 1/1 1995 1/1 1996 1/1 1997 1/1 1998 1/1 1999 1/1 2000 1/1 2001 Cohort 1961
Cohort 1981
2.2 Covariates
The data set includes information for each calendar year from 1982 to 2001 about the woman’s age8, the number of children born (fertility parity), her place of residence (municipality), family situation and the abortion parity – all recorded as of 1 January. Furthermore, a variable has been constructed to flag whether the woman had an induced abortion during the relevant year, which is recorded 31 December.
The variable indicating the woman’s municipality of residence was recoded into a new urbanisation variable. The urbanisation variable comprises four categories: the capital area, the urbanised area, the close periphery and the distant periphery (Tonboe 2001; Thygesen, Knudsen, and Keiding 2005).
The family variable describes the woman’s position within a family and was recoded into: single, married and cohabiting. According to this variable, divorced women, if not living together with a partner, are categorised as single. Married women have to live with their partners in order to be registered as married. Furthermore, single women might have a partner but are still categorised as single if they are not living together. Thus, it is not so much the woman’s marital status as it is her living arrangement that is pivotal to the classification of the woman’s family situation. Women in registered same-sex partnerships were disregarded, because of an assumed different fertility and abortion pattern.
2.3 Descriptive methods
As a response parameter, we have chosen the age-specific abortion probability in a relevant year. This is in line with the organization of these data, with the central binary variable "abortion this year”, which indicates whether the woman has had an induced abortion the relevant year or not, and the restriction to women who were alive and living in the country for the whole year. For the sake of completeness: the abortion parity variable used as covariate counts, at the beginning of each year, the actual number of abortions performed, even if several were performed during one year. To illustrate the connection to a concept of abortion incidence counting each abortion separately, reference may be made to data from the Danish National Board of Health showing that the number of women who have an induced abortion within 12 months after the last induced abortion was as low as 5% in 1989 (Knudsen 1998). Obviously, not all of these multiple abortions would take place in the same calendar year. Our
abortion probability parameter is, therefore, close to the abortion incidence and the patterns should be very similar.
2.4 Logistic regression methods
The influence of several explanatory variables on the probability of having an abortion in a relevant year was estimated by logistic regression analysis. In this paper we use the logistic regression model descriptively, to attempt to capture primary structures in the data. Use of confidence intervals and p-values derived from the model is difficult with the large data set.
First, in logistic regression, the variance is a fixed function of the mean and therefore the usual maximum likelihood estimates of variation are derived from the estimates of the mean, not from the actual variability in the data. This is in contrast to statistical models based on the normal distribution, where the variance is a freely varying parameter. For large data sets, one will in practice almost always find lack of fit, in the form of overdispersion (Dean 2005) or otherwise, and the usual maximum likelihood estimates of variability are not robust to the resulting model misspecification. We found it beside the point to enter into elaborate generalizations of the estimation procedure in this publication.
Secondly, the standard intuition concerning p-values, e.g. the conventional 5% level was developed by R.A. Fisher in the 1920s and 1930s when he revolutionised statistics by analysing small data sets from his agricultural experiments; the tradition from the 19th century and from Karl Pearson who studied larger data sets was to require much stronger effects to claim statistical significance. For the large datasets in demography adherence to the Fisherian ‘5%’ conventions will lead to focusing on differences too small to be of demographic interest.
3. Descriptive analyses
3.1 Age-specific abortion rates
Figure 3 shows the age-specific abortion rates per 1000 women between the years of 1983-2001. The women’s ages are divided into 2-year age intervals from 20-21 years old to 38-39 years old.
Figure 3: Age-specific abortion rates per 1000 women from 1983-2001, cohort 1961-1981
0 5 10 15 20 25 30
1983 1984 1985 1986 1987 1988 1989 1990 1991 1992 1993 1994 1995 1996 1997 1998 1999 2000 2001 20-21 22-23 24-25 26-27 28-29 30-31 32-33 34-35 36-37 38-39
Figure 3 shows that the abortion rates are highest for women in the age intervals 20-21 years old and 22-23 years old. Furthermore, the abortion rates decrease with age by about one to two abortions per 1000 women for each two-year age group. For example, the abortion rate is about 29, 29, 25 and 24 abortions per 1000 women in 1988 for the age groups 20-21, 22-23, 24-25 and 26-27 respectively.
As shown in Figure 3, abortion rates for the 20- to 25-year-old women peak in 1989 with a continuous fall over the years afterwards.
3.2 Abortion parity
Age-and-abortion-parity specific abortion rates were calculated for each year of the study period. The table below shows the age-specific abortion rates for selected age groups, according to abortion parity in 2001.
Table 1: Abortion rates per 1000 women for selected age groups in 2001, according to abortion parity
Abortion parity
Age per 1 Jan 0 abortions 1 abortion 2 abortions 3 or more abortions
20-21 19.9 51.1
26-27 15.6 38.9 62.3 56.8
30-31 14.6 27.8 53.0 65.8
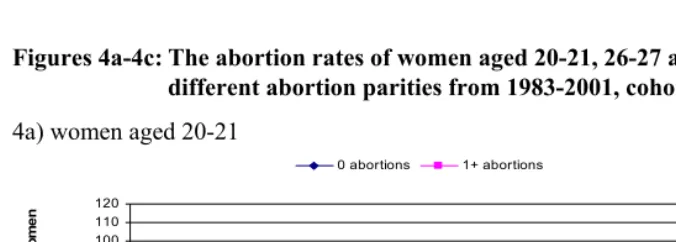
It is seen for all age groups that the abortion rates are higher among women with previous abortions than among women with no previous abortions. Generally, abortion rates increase with increasing abortion parity. Figures 4a-4c show that this is the case for all years between 1983 and 2001. Abortion rates, regardless of abortion parity, decrease with age.
Figures 4a-4c: The abortion rates of women aged 20-21, 26-27 and 30-31 given the different abortion parities from 1983-2001, cohort 1961-1981
4a) women aged 20-21
0 10 20 30 40 50 60 70 80 90 100 110 120 19 83 19 84 19 85 19 86 19 87 19 88 19 89 19 90 19 91 19 92 19 93 19 94 19 95 19 96 19 97 19 98 19 99 20 00 20 01 Ye ar A b o rti o n r a te p e r 1 000 w o m e n
Figures 4a-4c: (Continued)
4b) women aged 26-27
0 10 20 30 40 50 60 70 80 90 100 110 120 19 83 19 84 19 85 19 86 19 87 19 88 19 89 19 90 19 91 19 92 19 93 19 94 19 95 19 96 19 97 19 98 19 99 20 00 20 01 Ye ar A b o rti o n r a te p e p e r 1 0 0 0 w o m e n
0 abortions 1 abortion 2 abortions ≥ 3 abortions
4c)women aged 30-31
0 10 20 30 40 50 60 70 80 90 100 110 120
1983 1984 1985 1986 1987 1988 1989 1990 1991 1992 1993 1994 1995 1996 1997 1998 1999 2000 2001 Ye ar A b or ti on r a te p e r 1 0 0 0 w o m e n
0 abortions 1 abortion 2 abortions ≥ 3 abortions
In general, abortion rates for women aged 20-21 (data shown), 22-23 and 24-25 with no previous abortion increased in the 1980s and seem to peak around 1990, subsequently followed by a decrease in abortion rates in the 1990s. The abortion rates for women aged 26-27 (data shown), 28-29, 30-31 (data shown) and 32-33 with no previous abortions increase in the time period from 1990-2001.
3.3 Fertility parity
Age-specific abortion rates for a given fertility parity were calculated. Table 2 and Figures 5a-5c illustrate fertility-parity specific abortion rates for selected age groups.
Table 2: Abortion rates per 1000 women for selected age-groups in 2001, according to fertility parity
Fertility parity
Age per 1 Jan 0 children 1 child 2 children 3 children or more
20-21 16.6 83.5 100.7 58.8
26-27 11.5 21.3 42.2 49.7
30-31 10.6 18.1 20.9 31.4
The overall trend is that women who have previously given birth have higher abortion rates than nulliparous women. To have given birth is thus associated with an increased risk of having an abortion. Furthermore, the risk of an abortion increases with the number of children. This trend is observed for all age groups.
Figures 5a-5c: Abortion rates of women aged 20-21, 26-27 and 30-31 given the different fertility parities from 1983-2001, cohort 1961-1981
5a) women aged 20-21
0 20 40 60 80 100 120 19 83 19 84 19 85 19 86 19 87 19 88 19 89 19 90 19 91 19 92 19 93 19 94 19 95 19 96 19 97 19 98 19 99 20 00 20 01 Ye ar A b o rti o n r a te p e r 1000 w o m e n
Figures 5a-5c: (Continued)
5b) women aged 26-27
0 20 40 60 80 100 120 198 3 198 4 198 5 198 6 198 7 198 8 198 9 199 0 199 1 199 2 199 3 199 4 199 5 199 6 199 7 199 8 199 9 200 0 200 1 Ye ar A bor ti ons ra te p e r 1 0 0 0 w o m e n
0 children 1 child 2 children 3+ children
5c) women aged 30-31
0 20 40 60 80 100 120 198 3 198 4 198 5 198 6 198 7 198 8 198 9 199 0 199 1 199 2 199 3 199 4 199 5 199 6 199 7 199 8 199 9 200 0 200 1 Ye ar A b o rt io n r a te p e r 10 00 w o m e n
0 children 1 child 2 children 3+ children
The excess risk of having an abortion the more children the woman has decreases the older the woman is. In 2001, 26-27year-old women with three children have an almost 4.3 times higher risk of an abortion compared to women in the same age group with no children. In comparison, 30- to 31-year-old women with three children in 2001 have an approx 3 times higher risk of an abortion compared to women in the same age group with no children, cf. Table 2.
4. Logistic regression analyses
4.1 Modelling data
As mentioned under the data and methods section, the data set is so large that a straightforward use of standard likelihood-based p-values and confidence intervals is not justified here.
In our search for a model to describe important features of the data, we applied another approach based on the descriptive findings and the overall objective of this study. The descriptive findings show that abortion parity, fertility parity, age, and calendar year seem to influence a woman’s risk of having an abortion. The first model (model 1) therefore contains all the main effects of the above-mentioned factors, cf. Table 3, along with the women’s family situation and urbanisation that we wish to control for. Furthermore, the descriptive analyses indicate interaction between some of the factors. The main objective of this study is to investigate the effect of fertility parity and abortion parity on a woman’s risk of having an abortion. Hence, only interactions containing either fertility parity or abortion parity are considered.
Interaction occurs if the effect of an independent variable on the risk of having an abortion is different at different levels of a second independent variable. The logarithm of the odds ratios (OR) of the interaction is plotted into a graph (main effect is included).
Table 3: Interaction effects included in the fitted regression models9
Model Interactions
Model 1 -
Model 2 Fertility parity * calendar year
Fertility parity * age
Model 3 Abortion parity * calendar year
Abortion parity * age
Model 4 Fertility parity * abortion parity
The final model Fertility parity bin. * calendar year
Fertility parity bin. * age
9 All the fitted models contain main effects for calendar year, age, abortion parity, fertility parity, family
Only data from 1986 onwards are included in the models, since it is not until 1 January 1986 that five birth-cohorts (1961-1966) had reached the age of 20. In all of the models, the reference category is that for a 20 year old single woman with no previous abortions and no children who lives in the capital area in 2001.
The estimates of the main effects and interactions in the different models can be found in Appendix 1. Only the results of the final model are included in the article.
With the primary purpose of easing the graphical presentation of the interactions, we took advantage of a particular structure in the results: the differences between women with one, two, and three or more children were well explained by the main effects alone, while the interaction term only required distinction between whether or not the woman had given birth (we term this binary fertility parity).
4.2 The logistic regression model
Based on the previously fitted models, a model containing all the main effects together with the interactions between binary fertility parity and calendar year, and between binary fertility parity and age was fitted, cf. Table 3. Figures 6a-6b show the ORs of the interactions, including the main effects.
Figure 6a: The ORs of the interaction between fertility parity and calendar year plotted into a logarithmic scale
1 10 100
1986 1987 1988 1989 1990 1991 1992 1993 1994 1995 1996 1997 1998 1999 2000 2001
Cale ndar ye ar
No children 1 child 2 children 3+ children
In Figure 6a two distinct different trends can be identified: declining abortion rates from 1986-2001 for nulliparous women and increasing abortion rates for women with one child or more in the same period. Note that the three upper curves in Figure 6a and Figure 6b are parallel by design under the assumption of what was termed binary fertility parity above.
Figure 6b: The ORs of the interaction between fertility parity and age plotted into a logarithmic scale
0,1 1 10
20 21 22 23 24 25 26 27 28 29 30 31 32 33 34 35 36 37 38 39
Age
Figure 6b shows that the two different trends depending on whether the women have children or not still pertain. The risk of having an abortion decreased with age, but there is a weak tendency that it decreases relatively more for women with children compared to nulliparous women. In spite of these trends, it is still nulliparous women who have the lowest risk of having an abortion, regardless of age; that is, women with children never catch up with nulliparous women in regard to the low risk of having an abortion.
5. Discussion
5.1 Validity of data
The present study is solely based on register data, cf. section 2.1, which means that the accuracy of the information does not rely on the women’s memory or willingness to participate; hence there is no obvious recall bias or selection bias. On the other hand, the registers only comprise certain information regarding a few possible confounders; for instance, there is no available information on use of contraception or attitudes towards abortion, and no information on the pregnancy length at the time of abortion.
Induced abortions in Denmark are legal, cost-free, and until the end of 12th week of pregnancy no statement of reasons for seeking an abortion is required from the woman. Therefore, the number of illegal, non-registered abortions in Denmark is probably minimal. Induced abortions of foetuses with severe diseases are primarily performed after the completed 12th week of pregnancy and require special permission; they account for only 1-1.6% of all legal abortions (National Board of Health 2004, 2007).
5.1.1 The abortion rates in 1996
Figure 3 in section 3.1 revealed for all ages an abrupt increase in the age-specific abortion rates in 1996. This is not due to a mistake in the present analysis or data handling, as a similar increase is noted in the data published by Statistics Denmark (cf. Figure 1). The reorganisation of abortion took place in 1995 and it is tempting to explain this increase by some kind of registration errors. However, previously sudden increases have been observed (e.g. Knudsen 1991). Further, a study from Norway suggests another explanation for the increasing abortion rates in 1996. The study shows that the abortion rates for women ≤ 24 years, which had decreased from 1992 through 1995, rose significantly by 36% during the first quarter of 1996. The increasing abortion rates for women ≤ 24 years were mainly found among single, nulliparous students. The authors ascribe the increasing abortion rates to a contraceptive pill scare that swept over several western European countries from late October through December of 1995. This was sparked by intensive media coverage of the increased risk for adverse vascular events from the use of third-generation contraceptive pills (Skjeldestad 1997). It is possible that the contraceptive pill scare might have contributed to part of the high abortion intensity in 1996, however, in our analyses the increased abortion intensity is not more pronounced among women in certain age-groups. Furthermore, the analyses show no evidence that the increase is more pronounced among single, nulliparous women or any other sub-group. Thus, even though the contraceptive pill scare might have contributed, there might also be other contributing factors, such as the reorganisation of the registers.
5.2 Fertility parity
The descriptive findings show that the risk of having an abortion increases with the number of children a woman has given birth to.
The descriptive findings also show that within the age range studied here, the older the woman, the lower the abortion rates. This association is particularly strong for women with children. Furthermore, the risk of having an abortion declines over time for women without children, whereas the risk increases for women with children. The final logistic regression model supports these findings, and interactions were identified between the women’s fertility parity and age, and the women’s fertility parity and calendar year.
factor 3. Thus, age has a much larger impact on the risk of an abortion for women with children than for nulliparous women. A Danish study based on interviews with women who had undergone an induced abortion, found that having children was closely correlated with a specific notion of which is the preferred time for giving birth and, consequently, and also the non-preferred. The “right” age to have children is not so much biological as an indication of a social status, where maturity and personal readiness are of great importance (Rasch, Knudsen, and Gammeltoft 2005). However, these things often come with biological age. Intuitively it makes sense that the abortion rates are decreasing with age throughout the 20s and early 30s. In the women´s mid and late 30s the biological factor might play an important role for abortion rates, since it has been documented that female fecundity is highly dependent on the women’s age (Jensen et al. 2008; Lampic et al. 2006), and unintended pregnancies and subsequent abortions might therefore be less frequent. Planned pregnancies are very frequent in these ages (Rasch, Knudsen, and Gammeltoft 2005) and furthermore, most women who get pregnant in these age-groups, give birth.
Yet, the question is why the risk of an abortion has decreased relatively more over time for women with children than for nulliparous women? This might partly be explained by a high abortion risk for women with children compared to nulliparous women at the age of 20, which leaves room for reduction. The ORs from Figure 6b show that for women with children the OR decreases 61% from the age of 20 to the age of 25. However, for nulliparous women the decrease is only 34% in the same interval. The results could indicate that for nulliparous women in their early 20s, abortion is perhaps a far more negotiable solution to an unwanted pregnancy than it is for women who have already commenced childbearing. Women with children have already faced considerations on the “right” age to have children and they considered themselves ready and are therefore perhaps relatively less inclined, than nulliparous women in the same age group, to choose abortion as an option.
part of the period, meaning that the proportion of abortion-seeking women with no children grows.
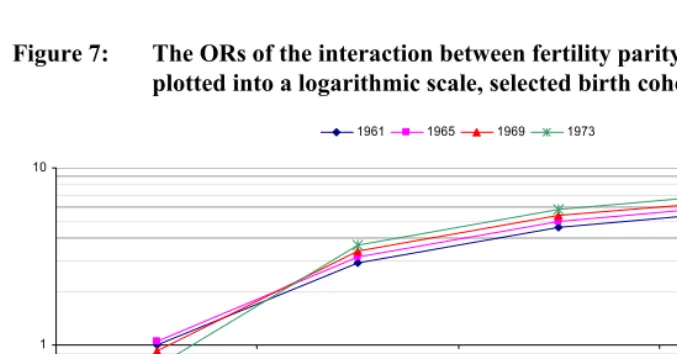
Alternatively, the observed different time trends according to fertility parity might be attributed to a birth cohort effect. Experimentally, we therefore chose to include information on the women’s birth cohort in our logistic regression model while excluding calendar year. Thus we fitted a model with all the main effects (excluding calendar year and including birth cohort) and two interactions between the women’s age and fertility parity and the women’s birth cohort and fertility parity. The new model shows that including information on the women’s birth cohort instead of calendar year does not substantially alter the estimates of the main effects or the two-way interaction between the women’s age and fertility parity. However, the fitted model shows an interesting interaction between the women’s birth cohort and fertility parity - Figure 7 illustrates this.
Figure 7: The ORs of the interaction between fertility parity and birth cohort plotted into a logarithmic scale, selected birth cohorts
0 1 10
No children 1 child 2 children 3+ children
Fe rtility parity
1961 1965 1969 1973
This could indicate that abortions, by the younger cohorts, are used as a mean to end childbearing once it has begun, while for the older cohorts of women, abortions are used as a mean to postpone childbearing – the first birth. Thus, these results show that in this more specific way, depending on the women’s fertility parity, the birth cohort might influence the risk of an abortion. The interesting indication is that women from different cohorts in Denmark use abortions differently. However, unfortunately, it is very difficult to disentangle whether the previously mentioned observed time trend actually is a cohort trend or a calendar trend because a linear effect of age, period, and cohort cannot be identified uniquely (Holford 2005).
5.3 Abortion parity
The descriptive findings and the final model show that the abortion rates increase the more previous abortions a woman has had. This finding is consistent with the Canadian study by Millar, Wadhera, and Henshaw (1997).
5.4 Urbanisation
The logistic regression analysis shows that women living outside the capital area have a 30-40% reduced risk of having an abortion compared to women living in the capital area.
Tonboe’s division of Denmark into four regions is based on analyses from the Danish section of the European Value Studies. The four regions differ within four dimensions; economic-material conditions (e.g. work, income), political-institutional conditions (e.g. activity, orientation), social conditions (e.g. social relations, children, families) and cultural conditions (e.g. moral, religion). A sub-dimension of social conditions is attitudes towards abortion, both within and outside marriage. Tonboe shows that induced abortion is least accepted in the close and distant periphery and most accepted in the capital area. The differences in attitude towards abortion may explain some of the regional variation in abortion behaviour; that is, abortion risk.
5.5 Family situation
The logistic regression analysis shows that even after adjusting for the women’s fertility parity and other characteristics, single women still have a higher risk of an abortion compared to married and cohabiting women. Married women have a 61% lower risk of an abortion and cohabiting women a 42% lower risk both compared to single women. As pointed out by a Danish study, single women will probably more often be in a situation where they do not feel financially and socially prepared for parenthood (Rasch, Wielandt, and Knudsen 2002). However, in contrast, many single women may not be in risk of unintended pregnancies and abortions, simply because they are not sexually active.
6. Conclusion
References
Andersen, T.F., Madsen, M., Jørgensen, J., Mellemkjær, L., and Olsen, J.H. (1999). The Danish National Hospital Register. A valuable source of data for modern health sciences. The Danish NationalHospital Register 46: 263-268.
Bankole, A., Singh, S., and Hass, T. (1998). Reasons Why Women Have Induced Abortions: Evidence from 27 Countries. Family Planning Perspectives 24(3): 117-127&152.
Barrett, G., Peacook, J., and Victor, C.R. (1998). Are women who have abortions
different from those who have not? Public Health 112: 157-163.
doi:10.1016/S0033-3506(98)00221-2.
Bettarini, S.S. and D’Andrea, S.S. (1996). Induced abortion in Italy: Levels, Trends and Characteristics. Family Planning Perspectives 28: 267-271&277.
Dean, C. (2005). Overdispersion. Encycl. Biostatistics (2. Ed.): 3913-3919.
Hansen, M.L., Stage, L., Knudsen, L.B., and Keiding, N. (2009). Induced abortions and first births among Danish women in the 1980s and 1990s. Research Report 09/10. Copenhagen: Department of Biostatistics, University of Copenhagen. Henshaw, S.K. (1990). Induced Abortion: A World Review, 1990. Family Planning
Perspectives 22(2): 76-89. doi:10.2307/2135512.
Holford, T.R. (2005). Age-Period-Cohort Analysis. Encycl. Biostatistics (2. Ed.): 105-123.
Jensen, T.K., Sobotka, T., Hansen, M.A., Pedersen, A.T., Lutz, W., and Skakkebæk, N.E. (2008). Declining trends in conception rates in recent birth cohorts of native Danish women: a possible role of deteriorating male reproductive health.
International Journal of Andrology 31(2): 81-92. doi:10.1111/j.1365-2605.2007.00827.x.
Jones, R.K., Darroch, J.K., and Henshaw, J.K. (2002). Patterns in the Socioeconomic Characteristics of Women Obtaining Abortions in 2000-2001. Perspectives on Sexual and Reproductive Health 34(5): 226-235. doi:10.2307/3097821.
Knudsen, L.B. (1991). Legally induced abortions in Denmark after Chernobyl.
Biomedicine and Pharmacotherapy 45: 229-231. doi:10.1016/0753-3322(91)90022-L.
Knudsen, L.B. and Murphy, M.J. (1999). Registers as data source in studies of reproductive behaviour. Research Report 12. Odense: Center for Demographic Research, University of Southern Denmark.
Knudsen, L.B. and Wielandt, H. (2000). Legally Induced Abortion – Experiences from Denmark. Research Report 18. Odense: Center for Demographic Research, University of Southern Denmark.
Krebs, L., Johansen, A.M., and Helweg-Larsen, K. (1997). Reporting of induced abortions in 1994. A comparison between the data in the Registry of Legally Induced Abortions and the National Patient Registry. Ugeskr Laeger 159(11): 1607-1611.
Lampic, C., Svanberg, A.S., Karlstrøm, P., and Tydén, T. (2006). Fertility awareness, intentions concerning childbearing, and attitudes towards parenthood among
female and male academics. Human Reproduction 21(2): 558-564.
doi:10.1093/humrep/dei367.
Millar, W.J., Wadhera, S., and Henshaw, S.K. (1997). Repeat abortions in Canada, 1975-1993. Family Planning Perspectives 29: 20-24. doi:10.2307/2953349. National Board of Health (Denmark) (various years). Statistik om prævention og
aborter. [Statistics on Contraceptives and Induced abortion]. Copenhagen. National Board of Health (Denmark) (2004). Legalt Provokerede Aborter 2003
(foreløbig opgørelse). Copenhagen: National Board of Health.
National Board of Health (Denmark) (2007). Legalt Provokerede Aborter 2006 (foreløbig opgørelse). Copenhagen: National Board of Health.
Rasch, V., Gammeltoft, T., Knudsen, L.B., Tobiassen, C., Ginzel, A., and Kempf, L. (2008). Induced abortion in Denmark: Effect of socio-economic situation and country of birth. European Journal of Public Health 2008 18(2): 144-149. Rasch, V., Knudsen, L.B., and Gammeltoft, T. (2005). Når der ikke er noget tredje valg.
Copenhagen: National Board of Health.
Rasch, V., Wielandt, H., and Knudsen, L.B. (2002). Living conditions, contraceptive use and the choice of induced abortion among pregnant women in Denmark.
Scandinavian Journal of Public Health 30: 293-299.
doi:10.1080/14034940210134167.
Russo, N.F., Horn, J.D., and Schwartz, R. (1992). U.S. abortion in context: Selected Characteristics and Motivations of Women Seeking Abortions. Journal of Social Issues 48: 183-202.
Sedgh, G., Henshaw, S., Singh, S., Åhman, E., and Shah, I. (2007). Induced abortion:
Estimated rates and trends worldwide. Lancet 370: 1338-1345.
doi:10.1016/S0140-6736(07)61575-X.
Skjeldestad, F.E. (1994). The incidence of repeat induced abortion – a prospective cohort study. Acta obstetricia et gynecologica Scandinavica 73(9): 706-710.
doi:10.3109/00016349409029408.
Skjeldestad, F.E., Borgan, J.K., Dalveit, A.K., and Nymoen E.H. (1994). Induced abortion – Effects of marital status, age and parity on choice of pregnancy termination. Acta obstetricia et gynecologica Scandinavica 73(3): 255-260.
doi:10.3109/00016349409023450.
Skjeldestad, F.E. (1997). Increased Number of Induced Abortions in Norway After Media Coverage of Adverse Vascular Events from the Use of Third-Generation
Oral Contraceptives. Contraception 55: 11-14.
doi:10.1016/S0010-7824(96)00236-3.
Statistics Denmark (2006). Vital Statistics 2006. Copenhagen.
Statistics Denmark (2009). Declaration of Content: Legal Abortions [electronic
resource]. Copenhagen: Statistics Denmark.
http://www.dst.dk/HomeUK/Guide/documentation/Varedeklarationer/emnegrup pe/emne.aspx?sysrid=763.
Thygesen, L.C., Knudsen, L.B., and Keiding, N. (2005). Modelling regional variation of first-time births in Denmark 1980-1994 by an age-period-cohort model.
DemographicResearch 13(23): 573-596. doi:10.4054/DemRes.2005.13.23. Tietze, C. (1978). Repeat Abortions – Why More? Family Planning Perspectives 10:
286-288. doi:10.2307/2134382.
Tonboe, J. (2001). Moralens Geografi Sociologisk Arbejdspapir, Nr. 11, 2001. Sociologisk Laboratorium: Aalborg University.
Westfall, J.M. and Kallail, K.J. (1995). Repeat Abortion and Use of Primary Care
Health Services. Family Planning Perspectives 27: 162-165.
Appendix
Model 1: β-values OR-values with confidence intervals and P-values (adjusted for calendar year. age. family situation and urbanisation)
B Exp(β) 95.0% C.I.for EXP(β) P-value
Abortion parity (ref. 0) 0.000
Abortion parity 1 0.638 1.893 1.868-1.918 0.000
Abortion parity 2 0.973 2.645 2.589-2.703 0.000
Abortion parity 3 1.244 3.469 3.366-3.575 0.000
Fertility parity (ref. 0) 0.000
Fertility parity 1 0.886 2.426 2.391-2.462 0.000
Fertility parity 2 1.287 3.621 3.559-3.684 0.000
Fertility parity 3 1.493 4.452 4.343-4.565 0.000
Model 2: β-values OR-values with confidence intervals and P-values (adjusted for calendar year. age. family situation and urbanisation)
B Exp(β) 95.0% C.I.for EXP(β) P-value
Abortion parity (ref. 0) 0.000
Abortion parity 1 0.627 1.872 1.848-1.898 0.000
Abortion parity 2 0.975 2.65 2.594-2.708 0.000
Abortion parity ≥3 1.265 3.543 3.438-3.651 0.000
Fertility parity (ref. 0) 0.000
Fertility parity 1 1.945 6.997 6.49-7.543 0.000
Fertility parity 2 2.361 10.606 9.159-12.282 0.000
Fertility parity ≥3 2.507 12.263 5.824-25.823 0.000
Fertility parity (ref. 0) * Calendar year (ref. 2001) 0.000
Fertility parity 1 * Calendar year 1986 -0.727 0.483 0.441-0.529 0.000
Fertility parity 1 * Calendar year 1987 -0.753 0.471 0.433-0.513 0.000
Fertility parity 1 * Calendar year 1988 -0.686 0.504 0.465-0.546 0.000
Fertility parity 1 * Calendar year 1989 -0.723 0.485 0.449-0.525 0.000
Fertility parity 1 * Calendar year 1990 -0.67 0.512 0.474-0.552 0.000
Fertility parity 1 * Calendar year 1991 -0.604 0.546 0.506-0.59 0.000
Fertility parity 1 * Calendar year 1992 -0.517 0.596 0.553-0.643 0.000
Fertility parity 1 * Calendar year 1993 -0.496 0.609 0.565-0.656 0.000
Fertility parity 1 * Calendar year 1994 -0.367 0.693 0.644-0.746 0.000
Fertility parity 1 * Calendar year 1995 -0.354 0.702 0.652-0.755 0.000
Fertility parity 1 * Calendar year 1996 -0.268 0.765 0.713-0.82 0.000
Fertility parity 1 * Calendar year 1997 -0.255 0.775 0.722-0.833 0.000
Fertility parity 1 * Calendar year 1998 -0.175 0.839 0.781-0.902 0.000
Fertility parity 1 * Calendar year 1999 -0.121 0.886 0.824-0.952 0.001
Fertility parity 1 * Calendar year 2000 -0.053 0.949 0.882-1.02 0.153
Fertility parity 2 * Calendar year 1986 -0.684 0.504 0.444-0.573 0.000
Fertility parity 2 * Calendar year 1987 -0.77 0.463 0.414-0.518 0.000
Fertility parity 2 * Calendar year 1988 -0.694 0.5 0.453-0.552 0.000
Fertility parity 2 * Calendar year 1989 -0.725 0.485 0.442-0.531 0.000
Fertility parity 2 * Calendar year 1990 -0.615 0.541 0.497-0.588 0.000
Fertility parity 2 * Calendar year 1991 -0.495 0.61 0.562-0.661 0.000
Model 2: (Continued)
B Exp(β) 95.0% C.I.for EXP(β) P-value
Fertility parity 2 * Calendar year 1993 -0.438 0.645 0.598-0.696 0.000
Fertility parity 2 * Calendar year 1994 -0.338 0.713 0.662-0.768 0.000
Fertility parity 2 * Calendar year 1995 -0.314 0.731 0.68-0.785 0.000
Fertility parity 2 * Calendar year 1996 -0.309 0.734 0.686-0.786 0.000
Fertility parity 2 * Calendar year 1997 -0.237 0.789 0.737-0.845 0.000
Fertility parity 2 * Calendar year 1998 -0.166 0.847 0.792-0.907 0.000
Fertility parity 2 * Calendar year 1999 -0.084 0.919 0.859-0.983 0.014
Fertility parity 2 * Calendar year 2000 -0.037 0.963 0.901-1.03 0.277
Fertility parity ≥ 3 * Calendar year 1986 -0.833 0.435 0.305-0.619 0.000
Fertility parity ≥ 3 * Calendar year 1987 -0.828 0.437 0.332-0.574 0.000
Fertility parity ≥ 3 * Calendar year 1988 -0.81 0.445 0.356-0.557 0.000
Fertility parity ≥ 3 * Calendar year 1989 -0.805 0.447 0.37-0.539 0.000
Fertility parity ≥ 3 * Calendar year 1990 -0.72 0.487 0.413-0.573 0.000
Fertility parity ≥ 3 * Calendar year 1991 -0.705 0.494 0.427-0.572 0.000
Fertility parity ≥ 3 * Calendar year 1992 -0.538 0.584 0.512-0.665 0.000
Fertility parity ≥ 3 * Calendar year 1993 -0.584 0.558 0.493-0.631 0.000
Fertility parity ≥ 3 * Calendar year 1994 -0.45 0.638 0.568-0.716 0.000
Fertility parity ≥ 3 * Calendar year 1995 -0.305 0.737 0.664-0.819 0.000
Fertility parity ≥ 3 * Calendar year 1996 -0.405 0.667 0.605-0.736 0.000
Fertility parity ≥ 3 * Calendar year 1997 -0.27 0.763 0.694-0.84 0.000
Fertility parity ≥ 3 * Calendar year 1998 -0.287 0.751 0.683-0.825 0.000
Fertility parity ≥ 3 * Calendar year 1999 -0.099 0.906 0.828-0.992 0.033
Fertility parity ≥ 3 * Calendar year 2000 -0.077 0.926 0.847-1.013 0.093
Age (ref. 20) * Fertility parity (ref. 0) 0.000
Age 21 * Fertility parity 1 -0.168 0.845 0.788-0.908 0.000
Age 21 * Fertility parity 2 -0.251 0.778 0.657-0.922 0.004
Age 21 * Fertility parity ≥ 3 -0.048 0.953 0.415-2.184 0.909
Age 22 * Fertility parity 1 -0.337 0.714 0.666-0.765 0.000
Age 22 * Fertility parity 2 -0.279 0.757 0.648-0.884 0.000
Age 22 * Fertility parity ≥ 3 -0.057 0.944 0.435-2.048 0.884
Age 23 * Fertility parity 1 -0.488 0.614 0.574-0.657 0.000
Age 23 * Fertility parity 2 -0.391 0.676 0.582-0.786 0.000
Age 23 * Fertility parity ≥ 3 -0.054 0.947 0.445-2.019 0.889
Age 24 * Fertility parity 1 -0.609 0.544 0.508-0.582 0.000
Age 24 * Fertility parity 2 -0.501 0.606 0.523-0.702 0.000
Age 24 * Fertility parity ≥ 3 -0.312 0.732 0.345-1.551 0.416
Age 25 * Fertility parity 1 -0.766 0.465 0.434-0.498 0.000
Age 25 * Fertility parity 2 -0.692 0.501 0.432-0.58 0.000
Age 25 * Fertility parity ≥ 3 -0.434 0.648 0.306-1.369 0.255
Age 26 * Fertility parity 1 -0.898 0.407 0.379-0.438 0.000
Age 26 * Fertility parity 2 -0.766 0.465 0.401-0.538 0.000
Age 26 * Fertility parity ≥ 3 -0.565 0.568 0.269-1.199 0.138
Age 27 * Fertility parity 1 -0.941 0.39 0.362-0.421 0.000
Age 27 * Fertility parity 2 -0.868 0.42 0.362-0.486 0.000
Age 27 * Fertility parity ≥ 3 -0.695 0.499 0.237-1.053 0.068
Age 28 * Fertility parity 1 -0.976 0.377 0.349-0.407 0.000
Age 28 * Fertility parity 2 -0.953 0.385 0.332-0.447 0.000
Age 28 * Fertility parity ≥ 3 -0.816 0.442 0.21-0.932 0.032
Age 29 * Fertility parity 1 -1.017 0.362 0.333-0.393 0.000
Age 29 * Fertility parity 2 -1.019 0.361 0.311-0.419 0.000
Age 29 * Fertility parity ≥ 3 -0.775 0.461 0.219-0.972 0.042
Age 30 * Fertility parity 1 -1.087 0.337 0.309-0.368 0.000
Model 2: (Continued)
B Exp(β) 95.0% C.I.for EXP(β) P-value
Age 30 * Fertility parity ≥ 3 -0.987 0.373 0.177-0.787 0.010
Age 31 * Fertility parity 1 -1.083 0.339 0.308-0.372 0.000
Age 31 * Fertility parity 2 -1.162 0.313 0.268-0.366 0.000
Age 31 * Fertility parity ≥ 3 -1 0.368 0.174-0.776 0.009
Age 32 * Fertility parity 1 -1.127 0.324 0.292-0.36 0.000
Age 32 * Fertility parity 2 -1.185 0.306 0.26-0.359 0.000
Age 32 * Fertility parity ≥ 3 -1.109 0.33 0.156-0.697 0.004
Age 33 * Fertility parity 1 -1.122 0.326 0.29-0.366 0.000
Age 33 * Fertility parity 2 -1.19 0.304 0.257-0.359 0.000
Age 33 * Fertility parity ≥ 3 -1.082 0.339 0.16-0.717 0.005
Age 34 * Fertility parity 1 -1.169 0.311 0.272-0.355 0.000
Age 34 * Fertility parity 2 -1.267 0.282 0.236-0.336 0.000
Age 34 * Fertility parity ≥ 3 -1.129 0.323 0.153-0.686 0.003
Age 35 * Fertility parity 1 -0.974 0.377 0.321-0.444 0.000
Age 35 * Fertility parity 2 -1.112 0.329 0.271-0.4 0.000
Age 35 * Fertility parity ≥ 3 -1.08 0.34 0.159-0.724 0.005
Age 36 * Fertility parity 1 -0.879 0.415 0.34-0.507 0.000
Age 36 * Fertility parity 2 -1.04 0.354 0.283-0.442 0.000
Age 36 * Fertility parity ≥ 3 -0.946 0.388 0.181-0.834 0.015
Age 37 * Fertility parity 1 -1.17 0.31 0.243-0.396 0.000
Age 37 * Fertility parity 2 -1.169 0.311 0.242-0.399 0.000
Age 37 * Fertility parity ≥ 3 -1.126 0.324 0.15-0.703 0.004
Age 38 * Fertility parity 1 -1.032 0.356 0.256-0.496 0.000
Age 38 * Fertility parity 2 -1.103 0.332 0.24-0.459 0.000
Age 38 * Fertility parity ≥ 3 -0.968 0.38 0.17-0.846 0.018
Age 39 * Fertility parity 1 -1.366 0.255 0.159-0.409 0.000
Age 39 * Fertility parity 2 -1.455 0.233 0.151-0.361 0.000
Age 39 * Fertility parity ≥ 3 -1.25 0.287 0.122-0.674 0.004
Model 3: β-values. OR-values with confidence intervals and P-values (adjusted for calendar year. age. family situation and urbanisation)
B Exp(β) 95.0% C.I.for EXP(β) P-value
Abortion parity (ref. 0) 0.000
Abortion parity 1 1.067 2.905 2.686-3.142 0.000
Abortion parity 2 1.689 5.415 4.616-6.353 0.000
Abortion parity ≥3 1.938 6.948 4.955-9.742 0.000
Fertility parity (ref. 0) 0.000
Fertility parity 1 0.875 2.398 2.363-2.433 0.000
Fertility parity 2 1.277 3.586 3.524-3.649 0.000
Fertility parity ≥3 1.493 4.449 4.339-4.561 0.000
Abortion parity (ref. 0) * Calendar year (ref. 2001) 0.000
Abortion parity 1 * Calendar year 1986 -0.046 0.955 0.889-1.026 0.209
Abortion parity 1 * Calendar year 1987 -0.118 0.889 0.828-0.953 0.001
Abortion parity 1 * Calendar year 1988 -0.174 0.84 0.784-0.901 0.000
Abortion parity 1 * Calendar year 1989 -0.263 0.769 0.718-0.824 0.000
Abortion parity 1 * Calendar year 1990 -0.252 0.777 0.724-0.833 0.000
Abortion parity 1 * Calendar year 1991 -0.321 0.725 0.675-0.779 0.000
Abortion parity 1 * Calendar year 1992 -0.335 0.715 0.665-0.77 0.000
Abortion parity 1 * Calendar year 1993 -0.353 0.703 0.652-0.758 0.000
Model 3: (Continued)
B Exp(β) 95.0% C.I.for EXP(β) P-value
Abortion parity 1 * Calendar year 1995 -0.44 0.644 0.595-0.698 0.000
Abortion parity 1 * Calendar year 1996 -0.488 0.614 0.565-0.667 0.000
Abortion parity 1 * Calendar year 1997 -0.565 0.568 0.521-0.62 0.000
Abortion parity 1 * Calendar year 1998 -0.545 0.58 0.53-0.635 0.000
Abortion parity 1 * Calendar year 1999 -0.527 0.59 0.536-0.65 0.000
Abortion parity 1 * Calendar year 2000 -0.59 0.554 0.498-0.617 0.000
Abortion parity 2 * Calendar year 1986 -0.644 0.525 0.465-0.593 0.000
Abortion parity 2 * Calendar year 1987 -0.678 0.507 0.441-0.584 0.000
Abortion parity 2 * Calendar year 1988 -0.786 0.456 0.382-0.544 0.000
Abortion parity 2 * Calendar year 1989 -0.603 0.547 0.423-0.708 0.000
Abortion parity 2 * Calendar year 1990 -0.179 0.836 0.713-0.981 0.028
Abortion parity 2 * Calendar year 1991 -0.22 0.802 0.691-0.932 0.004
Abortion parity 2 * Calendar year 1992 -0.364 0.695 0.6-0.805 0.000
Abortion parity 2 * Calendar year 1993 -0.365 0.694 0.602-0.801 0.000
Abortion parity 2 * Calendar year 1994 -0.404 0.668 0.579-0.77 0.000
Abortion parity 2 * Calendar year 1995 -0.501 0.606 0.525-0.7 0.000
Abortion parity 2 * Calendar year 1996 -0.533 0.587 0.508-0.679 0.000
Abortion parity 2 * Calendar year 1997 -0.6 0.549 0.474-0.636 0.000
Abortion parity 2 * Calendar year 1998 -0.598 0.55 0.475-0.638 0.000
Abortion parity 2 * Calendar year 1999 -0.762 0.467 0.401-0.543 0.000
Abortion parity 2 * Calendar year 2000 -0.75 0.472 0.405-0.551 0.000
Abortion parity ≥ 3 * Calendar year 1986 -0.806 0.447 0.381-0.523 0.000
Abortion parity ≥ 3 * Calendar year 1987 -0.86 0.423 0.359-0.499 0.000
Abortion parity ≥ 3 * Calendar year 1988 -0.959 0.383 0.322-0.456 0.000
Abortion parity ≥ 3 * Calendar year 1989 -1.039 0.354 0.293-0.427 0.000
Abortion parity ≥ 3 * Calendar year 1990 -0.913 0.401 0.329-0.49 0.000
Abortion parity ≥ 3 * Calendar year 1991 -1.068 0.344 0.273-0.433 0.000
Abortion parity ≥ 3 * Calendar year 1992 -1.184 0.306 0.231-0.405 0.000
Abortion parity ≥ 3 * Calendar year 1993 -1.017 0.362 0.247-0.529 0.000
Abortion parity ≥ 3 * Calendar year 1994 -0.205 0.815 0.561-1.183 0.282
Abortion parity ≥ 3 * Calendar year 1995 -0.184 0.832 0.59-1.173 0.294
Abortion parity ≥ 3 * Calendar year 1996 -0.249 0.779 0.561-1.084 0.138
Abortion parity ≥ 3 * Calendar year 1997 -0.297 0.743 0.538-1.025 0.071
Abortion parity ≥ 3 * Calendar year 1998 -0.453 0.636 0.461-0.878 0.006
Abortion parity ≥ 3 * Calendar year 1999 -0.428 0.652 0.473-0.898 0.009
Abortion parity ≥ 3 * Calendar year 2000 -0.474 0.623 0.452-0.858 0.004
Abortion parity (ref. 0) * Age (ref. 20) -0.496 0.609 0.002
Abortion parity 1 * Age 21 -0.555 0.574 0.416-0.792 0.001
Abortion parity 1 * Age 22 -0.694 0.5 0.361-0.691 0.000
Abortion parity 1 * Age 23 -0.845 0.43 0.31-0.596 0.000
Abortion parity 1 * Age 24 -0.826 0.438 0.315-0.609 0.000
Abortion parity 1 * Age 25 -0.736 0.479 0.344-0.667 0.000
Abortion parity 1 * Age 26 -0.925 0.396 0.282-0.557 0.000
Abortion parity 1 * Age 27 -1.085 0.338 0.237-0.481 0.000
Abortion parity 1 * Age 28 -0.854 0.426 0.297-0.61 0.000
Abortion parity 1 * Age 29 -1.128 0.324 0.219-0.477 0.000
Abortion parity 1 * Age 30 -1.102 0.332 0.217-0.508 0.000
Abortion parity 1 * Age 31 -1.124 0.325 0.188-0.563 0.000
Abortion parity 1 * Age 32 - 0.000
Abortion parity 1 * Age 33 -0.347 0.706 0.644-0.776 0.000
Abortion parity 1 * Age 34 -0.283 0.753 0.691-0.822 0.000
Abortion parity 1 * Age 35 -0.215 0.807 0.743-0.876 0.000
Model 3: (Continued)
B Exp(β) 95.0% C.I.for EXP(β) P-value
Abortion parity 1 * Age 39 -0.131 0.877 0.813-0.946 0.001
Abortion parity 2 * Age 21 -0.104 0.902 0.836-0.972 0.007
Abortion parity 2 * Age 22 -0.103 0.903 0.837-0.973 0.007
Abortion parity 2 * Age 23 -0.089 0.915 0.85-0.984 0.017
Abortion parity 2 * Age 24 -0.08 0.923 0.861-0.99 0.025
Abortion parity 2 * Age 25 -0.06 0.942 0.878-1.011 0.098
Abortion parity 2 * Age 26 -0.11 0.895 0.834-0.962 0.002
Abortion parity 2 * Age 27 -0.024 0.976 0.909-1.047 0.497
Abortion parity 2 * Age 28 0.019 1.02 0.95-1.094 0.589
Abortion parity 2 * Age 29 -0.515 0.597 0.501-0.712 0.000
Abortion parity 2 * Age 30 -0.416 0.66 0.563-0.772 0.000
Abortion parity 2 * Age 31 -0.348 0.706 0.61-0.817 0.000
Abortion parity 2 * Age 32 -0.406 0.666 0.579-0.767 0.000
Abortion parity 2 * Age 33 -0.318 0.728 0.637-0.832 0.000
Abortion parity 2 * Age 34 -0.265 0.767 0.673-0.875 0.000
Abortion parity 2 * Age 35 -0.213 0.808 0.711-0.919 0.001
Abortion parity 2 * Age 36 -0.096 0.908 0.802-1.029 0.129
Abortion parity 2 * Age 37 -0.082 0.921 0.814-1.042 0.190
Abortion parity 2 * Age 38 -0.05 0.951 0.844-1.072 0.412
Abortion parity 2 * Age 39 -0.171 0.843 0.749-0.948 0.005
Abortion parity ≥ 3 * Age 21 -0.035 0.966 0.859-1.087 0.564
Abortion parity ≥ 3 * Age 22 -0.06 0.942 0.836-1.06 0.320
Abortion parity ≥ 3 * Age 23 -0.089 0.915 0.811-1.031 0.144
Abortion parity ≥ 3 * Age 24 -0.073 0.929 0.823-1.049 0.236
Abortion parity ≥ 3 * Age 25 -0.422 0.656 0.488-0.88 0.005
Abortion parity ≥ 3 * Age 26 -0.297 0.743 0.576-0.958 0.022
Abortion parity ≥ 3 * Age 27 -0.336 0.714 0.567-0.901 0.004
Abortion parity ≥ 3 * Age 28 -0.446 0.64 0.516-0.795 0.000
Abortion parity ≥ 3 * Age 29 -0.37 0.69 0.564-0.845 0.000
Abortion parity ≥ 3 * Age 30 -0.318 0.727 0.6-0.882 0.001
Abortion parity ≥ 3 * Age 31 -0.106 0.9 0.75-1.079 0.253
Abortion parity ≥ 3 * Age 32 -0.048 0.953 0.798-1.139 0.599
Abortion parity ≥ 3 * Age 33 -0.105 0.9 0.755-1.073 0.242
Abortion parity ≥ 3 * Age 34 0.018 1.018 0.862-1.202 0.836
Abortion parity ≥ 3 * Age 35 -0.057 0.944 0.802-1.111 0.491
Abortion parity ≥ 3 * Age 36 -0.041 0.96 0.814-1.131 0.624
Abortion parity ≥ 3 * Age 37 -0.151 0.86 0.728-1.017 0.078
Abortion parity ≥ 3 * Age 38 -0.02 0.98 0.832-1.156 0.812
Abortion parity ≥ 3 * Age 39 -0.05 0.951 0.805-1.123 0.554
Abortion parity 1 * Age 37 -0.237 0.789 0.73-0.853 0.000
Abortion parity 1 * Age 38 -0.165 0.848 0.785-0.916 0.000
Model 4: β-values OR-values with confidence intervals and P-values (adjusted for calendar year. age. family situation and urbanisation)
B Exp(β) 95.0% C.I.for EXP(β) P-value
Abortion parity (ref. 0) 0.000
Abortion parity 1 0.783 2.187 2.143-2.233 0.000
Abortion parity 2 1.306 3.691 3.552-3.836 0.000
Model 4: β-values OR values with confidence intervals and P-values (adjusted for calendar year. age. family situation and urbanisation)
B Exp(β) 95.0% C.I.for EXP(β) P-value
Fertility parity (ref. 0) 0.000
Fertility parity 1 0.968 2.633 2.586-2.68 0.000
Fertility parity 2 1.408 4.086 4.004-4.171 0.000
Fertility parity ≥3 1.684 5.386 5.218-5.558 0.000
Abortion parity (ref. 0) * Fertility parity (ref. 0) 0.000
Abortion parity 1 * Fertility parity 1 -0.225 0.799 0.773-0.825 0.000
Abortion parity 1 * Fertility parity 2 -0.261 0.77 0.745-0.796 0.000
Abortion parity 1 * Fertility parity ≥ 3 -0.338 0.713 0.678-0.75 0.000
Abortion parity 2 * Fertility parity 1 -0.409 0.664 0.629-0.701 0.000
Abortion parity 2 * Fertility parity 2 -0.497 0.609 0.576-0.643 0.000
Abortion parity 2 * Fertility parity ≥ 3 -0.659 0.517 0.48-0.557 0.000
Abortion parity ≥ 3 * Fertility parity 1 -0.446 0.64 0.589-0.696 0.000
Abortion parity ≥ 3 * Fertility parity 2 -0.666 0.514 0.473-0.558 0.000
Abortion parity ≥ 3 * Fertility parity ≥ 3 -0.835 0.434 0.393-0.479 0.000
The final model: β values OR values confidence interval and P-values of the variables (adjusted for calendar year, age, family situation and urbanisation)
B Exp(β) 95% CI for Exp(β) P-value
Abortion parity (ref. 0) 0.000
Abortion parity 1 .628 1.874 1.850-1.899 0.000
Abortion parity 2 .977 2.655 2.599-2.713 0.000
Abortion parity 3 1.266 3.548 3.443-3.656 0.000
Fertility parity (ref. 0) 0.000
Fertility parity 1 1.940 6.961 6.517-7.436 0.000
Fertility parity 2 2.400 11.024 10.304-11.795 0.000
Fertility parity 3 2.620 13.734 12.804-14.731 0.000
Fertility parity binary (ref. 1)*Calendar year (ref.2001) 0.000
Fertility parity 0* Calendar year 1986 -0.721 0.486 0.450-0.525 0.000
Fertility parity 0* Calendar year 1987 -0.762 0.467 0.434-0.502 0.000
Fertility parity 0* Calendar year 1988 -0.696 0.499 0.466-0.533 0.000
Fertility parity 0* Calendar year 1989 -0.730 0.482 0.452-0.514 0.000
Fertility parity 0* Calendar year 1990 -0.657 0.519 0.487-0.552 0.000
Fertility parity 0* Calendar year 1991 -0.574 0.563 0.530-0.599 0.000
Fertility parity 0* Calendar year 1992 -0.499 0.607 0.572-0.645 0.000
Fertility parity 0* Calendar year 1993 -0.484 0.616 0.581-0.654 0.000
Fertility parity 0* Calendar year 1994 -0.366 0.693 0.653-0.736 0.000
Fertility parity 0* Calendar year 1995 -0.331 0.718 0.677-0.761 0.000
Fertility parity 0* Calendar year 1996 -0.306 0.737 0.697-0.779 0.000
Fertility parity 0* Calendar year 1997 -0.250 0.779 0.736-0.824 0.000
Fertility parity 0* Calendar year 1998 -0.189 0.828 0.782-0.876 0.000
Fertility parity 0* Calendar year 1999 -0.101 0.904 0.855-0.957 0.000
The final model: (Continued)
B Exp(β) 95% CI for Exp(β) P-value
Age (ref.20 years)* Fertility parity binary (ref. 1) 0.000
Age 21* Fertility parity 0 -0.182 0.834 0.780-0.891 0.000
Age 22* Fertility parity 0 -0.323 0.724 0.679-0.772 0.000
Age 23* Fertility parity 0 -0.454 0.635 0.596-0.676 0.000
Age 24* Fertility parity 0 -0.571 0.565 0.531-0.601 0.000
Age 25* Fertility parity 0 -0.733 0.481 0.451-0.512 0.000
Age 26* Fertility parity 0 -0.837 0.433 0.406-0.462 0.000
Age 27* Fertility parity 0 -0.906 0.404 0.378-0.432 0.000
Age 28* Fertility parity 0 -0.971 0.379 0.353-0.406 0.000
Age 29* Fertility parity 0 -1.012 0.364 0.338-0.391 0.000
Age 30* Fertility parity 0 -1.127 0.324 0.300-0.350 0.000
Age 31* Fertility parity 0 -1.146 0.318 0.292-0.346 0.000
Age 32* Fertility parity 0 -1.196 0.302 0.276-0.331 0.000
Age 33* Fertility parity 0 -1.194 0.303 0.273-0.336 0.000
Age 34* Fertility parity 0 -1.261 0.283 0.253-0.318 0.000
Age 35* Fertility parity 0 -1.126 0.324 0.282-0.374 0.000
Age 36* Fertility parity 0 -1.035 0.355 0.298-0.424 0.000
Age 37* Fertility parity 0 -1.208 0.299 0.242-0.368 0.000
Age 38* Fertility parity 0 -1.103 0.332 0.249-0.443 0.000