R E S E A R C H
Open Access
Identification of cancer subtypes from
single-cell RNA-seq data using a consensus
clustering method
Yanglan Gan
1, Ning Li
1, Guobing Zou
2, Yongchang Xin
1and Jihong Guan
3*From29th International Conference on Genome Informatics Yunnan, China. 3-5 December 2018
Abstract
Background: Human cancers are complex ecosystems composed of cells with distinct molecular signatures. Such intratumoral heterogeneity poses a major challenge to cancer diagnosis and treatment. Recent advancements of single-cell techniques such as scRNA-seq have brought unprecedented insights into cellular heterogeneity. Subsequently, a challenging computational problem is to cluster high dimensional noisy datasets with substantially fewer cells than the number of genes.
Methods: In this paper, we introduced a consensus clustering framework conCluster, for cancer subtype
identification from single-cell RNA-seq data. Using an ensemble strategy, conCluster fuses multiple basic partitions to consensus clusters.
Results: Applied to real cancer scRNA-seq datasets, conCluster can more accurately detect cancer subtypes than the widely used scRNA-seq clustering methods. Further, we conducted co-expression network analysis for the identified melanoma subtypes.
Conclusions: Our analysis demonstrates that these subtypes exhibit distinct gene co-expression networks and significant gene sets with different functional enrichment.
Keywords: Consensus clustering, Intratumoral heterogeneity, Cancer subtypes, Single-cell sequencing
Background
Characterization of intratumoral heterogeneity is criti-cal to precision cancer therapy, as diverse cell popula-tions usually enable relapse and resistance to treatment [1]. Conventional bulk RNA-seq technology reveals the average gene expression of a collection of cells, and sub-sequently many methods have been developed to infer-ence tumor evolution using data from bulk-sequencing of tumor samples [2, 3]. These approaches require decon-volution of the mixed signals of the underlying tumor subpopulations, which are often ambiguous [4].
*Correspondence:[email protected]
3Department of Computer Science and Technology, Tongji University,
Shanghai, China
Full list of author information is available at the end of the article
Recently, single-cell RNA-Seq (scRNA-seq) quantifies the expression of diverse cellular populations and enables researchers to analyze the difference among cells [5–7]. A full characterization of the transcriptional landscape of individual cell holds enormous potential for detection of clinically important tumor subpopulations, understand-ing of tumor heterogeneity and further clinical appli-cations [8, 9]. Clustering of single-cell expression data provides an intuitive way for identification of cell types from a mass of heterogeneous cells, which can be used in diverse downstream expression analysis [10–12].
Due to noise, high dimensionality and data hetero-geneity, newly produced scRNA-seq data pose a grand challenge for traditional clustering algorithms, such as K-means, hierarchical clustering, and spectral clustering [13]. One feasible strategy is to first reduce the high
dimensional data into a lower dimensional subspace and apply traditional clustering to the dimension-reduced data. The widely used dimension reduction methods include principal component analysis (PCA) [14] or t-Distributed Stochastic Neighbor Embedding algorithm (t-SNE) [15]. Meanwhile, a number of methods which specifically designed for scRNA-seq analysis have been introduced, including Seurat [16], CIDR [17], SNN-cliq [18], SINCERA [19] and SC3 [20]. These advanced meth-ods have greatly improved the capability of scRNA-seq data analysis. However, as clustering methods are mostly sensitive to noise and initial parameters, how to accu-rately cluster scRNA-seq data across different environ-ments and revealing biological insights is still a substantial challenge [21].
Here, we proposed a consensus clustering model, con-Cluster, for cancer subtype identification from single-cell RNA-seq data. Specifically, conCluster first obtains a set of basic partitions using tSNE+K-means clustering with different initial parameters, and then fuses these differ-ent partitions into consensus clusters. Our conCluster method can also be easily extended to ensemble the clus-tering results of different clusclus-tering methods. We applied conCluster to real cancer scRNA-seq datasets, and fur-ther constructed the co-expression networks for the iden-tified cancer subtypes to analyze their difference. The experimental results demonstrate the effectiveness and robustness of conCluster compared with five widely used clustering methods.
Methods
Overview of the conCluster model
To identify subtypes from a collection of cancer cells, we developed conCluster to ensemble multiple cluster-ing results. LetEN∗Gdenotes a single-cell gene expression
matrix, in which rows correspond to different cells and columns correspond to genes. Each element ofEij
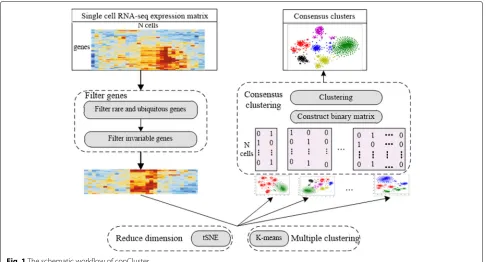
corre-sponds to the expression of genejin theith cell. Our con-Cluster takes the expression matrixE as input, through four steps, finally partition the N cells into K clusters, represented asC= {Ck|k=1, 2,· · ·,K}. Figure1shows
the overview of the proposed conCluster model. In the following, we will elaborate each step in detail.
Step1 Filter genes
To focus on the intrinsic transcriptomic signatures of these tumor cells, we filtered out rare and ubiquitous genes and identified the most variable genes across the single-cell dataset. Firstly, as the rare and ubiquitous genes are usually not useful for clustering, we filtered out genes that are either expressed in less than r% of cells (rare genes) or expressed in at least (100-r)% of cells (ubiquitous genes). As in the previous study [22],ris set as 6. Next, we identified the gene set that was the mostv% variable across
these single-cells, by controlling the relationship between mean expression and variability.
Step 2 Reduce dimension using t-SNE
To further reduce the dimensionality, we adopted the widely used t-SNE to reduce the high dimensional data into a lower dimensional subspace. Detailedly, perplex-ity is an important parameter of t-SNE, which is used as a smooth measure of the effective number of neighbors. Previous studies indicate that performance of t-SNE is fairly robust with changes in the perplexity between 5 and 50. Here, we set perplexity as 30 and used t-SNE to reduce the filtered scRNA expression data into two dimensions.
Step3 Partition cells in multiple ways
Based on the transformed two-dimensional data matrices, we performed K-means clustering with different initial parametersTtimes to obtain different basic partitions for these single cells. In this step, we can also utilize other basic clustering methods. For each individual clustering result, we derived a binary matrixBN∗Kt, which was
con-structed based the corresponding cluster labels ofNcells, whereKt(t=1, 2,· · ·,T) is the cluster number in thetth basic partition. For each row ofBN∗Kt , only one element
is 1, others are 0.
Step4 Consensus clustering
After gaining theT different partitions, we concatenated all those binary matrices into a larger binary matrix
B= {BN∗Kt|t=1, 2,· · ·,T}. Furthermore, we performed
K-means clustering based on the merged binary matrix. Here, Calinski-Harabaz Index [22] is utilized to decide the number of clusters. Then we fused the results of each individual clustering result into a consensus one [23].
Evaluation Metrics
When cell labels are available in the dataset, we adopted the adjusted rand index (ARI) to measure the accuracy of clustering [24]. For a set ofNcells and two different parti-tions of these cells, the overlap between the two partiparti-tions can be summarized in a contingency table, in which each entry denotes the number of objects in common between the two partitions. The ARI is then calculated as:
ARI= ij n ij 2 − i ai 2 j bi 2
/n 2 i ai 2 + j bi 2
/2−
i ai 2 j bi 2
/n 2
(1) where (.) denotes a binomial coefficient,nijis the element
from the contingency table,aiis the sum of theith row of
the contingency table,bjis the sum of thejth column of
Fig. 1The schematic workflow of conCluster
Datasets
Single-cell expression data from two recent scRNA-seq studies were selected from the data repository NCBI Gene Expression Omnibus (GSE72056 [25], GSE73727 [26]).
As they contained the cell types in the original publi-cations, it can be used to further validate the clustering results of different methods. In these studies, cell types were determined through a multi-stage process involving additional information such as cell-type molecular sig-natures. The first dataset contains a collection of cells from human melanoma tumor, consisted of 4645 single cells isolated from 19 patients; and the second dataset is from human pancreatic islet, containing 6 known human islet cell types. To ensure good data quality, samples with a library size less than 10,000 were excluded. Data sets transformed by logTPM were used as inputs of different methods.
Results
Performance evaluation on single cell RNA-seq data
To fully evaluate the performance, we compared con-Cluster with five widely used scRNA-seq data clustering methods, including spectral clustering, tSNE+K-means, SNN-Cliq, CIDR and SC3. Specifically, spectral clustering is an efficient traditional clustering method; tSNE+K-means is K-tSNE+K-means clustering combined with the nonlin-ear dimensionality reduction technique tSNE; SNN-Cliq adopts a shared nearest neighbours approach to calcu-late similarities between cells and performs single cell
clustering using a graph-theoretical model; CIDR uses an imputation approach to alleviate the impact of dropouts in scRNA-seq data in a principled manner; and SC3 transforms a cell-to-cell distance matrix from individ-ual K-means clustering to get a consensus partitions. To run the main SC3 method, the parameter ks is required to set. For CIDR, there are two parameters (nPC and nCluster). SNN-cliq relies on four paramters (k, distance r and m). We tried different values of these parame-ters and selected those values which obtain the highest ARI. Here, we selected two single cell RNA-seq datasets [GSE72056 and GSE73727], as they contained preexisting cluster structures that can be used for validation.
Fig. 2Performance evaluation of conCluster and five widely-used scRNA-data clustering methods. Adjusted Rand Index (ARI) is employed to measure the similarity between inferred and true cluster labels
so good and K-means exhibits the stochasticity in the clustering structures due to the random initialization, our conCluster based on multiple tSNE+K-means gains better solutions than other methods. Its performance suggests that the ensemble of multiple partitions of the data helps to merge clusters together in a sensible way.
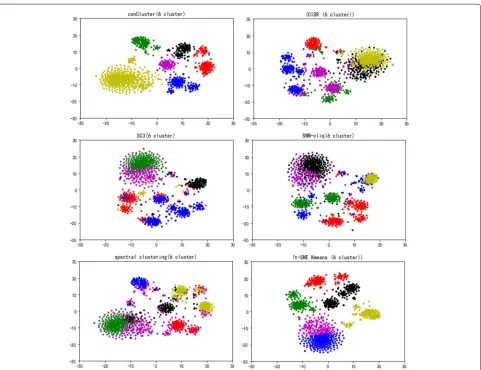
Identification of cancer subtypes
Further, we applied conCluster and the five compared algorithms on the malignant melanoma tumor cells in GSE72056. In this dataset, there are 1257 malignant cells after excluding benign tumor cells. Determining the num-ber of clusters is known to be difficult in clustering.
As there is not ground truth of the clusters for these malignant cells, we utilized Calinski-Harabaz Index [22] to determine the number of clusters. conCluster man-aged to identify six clusters in the dataset. As shown in Fig.3, conCluster displays five more clearly recognizable clusters than the compared methods. SNN-cliq, tSNE+K-means and SC3 also get relatively clear clusters, whereas spectral clustering and CIDR did not perform well in differentiating these clusters.
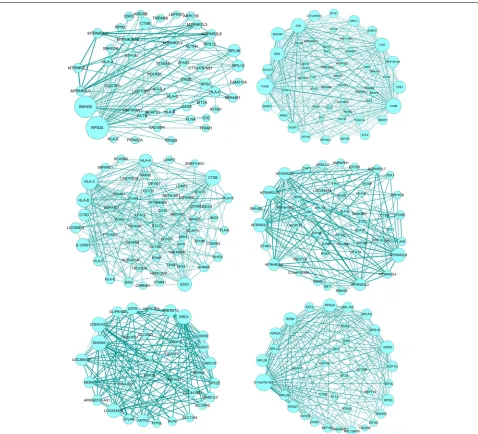
Next, to identify the regulatory genes of each sub-type of the malignant melanoma, we conducted gene co-expression network analysis. A co-expression net-work identifies which genes have a tendency to show
a coordinated expression pattern in specific subtype. This co-expression network can be represented as a gene¨Cgene similarity matrix. Here, we identified genes having significant expression difference among cells by applying a 5% FDR. These genes were used to recon-struct the subtype specific co-expression network and identify a number of modules of high co-expression genes. we utilized WGCNA to construct co-expression mod-ules, which is a widely used tool for co-expression anal-ysis. Figure4shows the co-expression network for each melanoma subtype. We noticed that different subtypes include the distinct co-expression gene subsets. These genes with the highest degree of connectivity usually are
expected to be drivers which are required for signaling pathways of essential function.
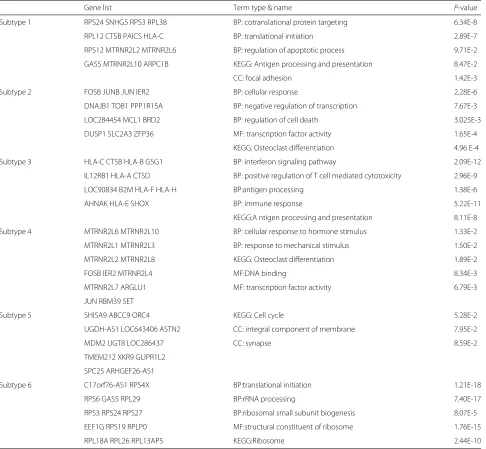
We computed the network degree for each gene in the co-expression networks of different melanoma subtypes, and identify genes with the most connections. To examine the potential functions of those genes, we performed sys-tematic gene ontology enrichment analysis using DAVID tools and summarized the key biological processes and pathways [27]. The most highly connected genes in each network and the corresponding gene ontology enrichment analysis are listed in Table1. Overall, these modules are significantly enriched for biologically important processes that are relevant to melanoma, including response to light stimulus, antigen processing and regulation of cell death.
For example, in subtypes 1, the most connected gene was involved in translation initiation (RPL12, RPL38, RPS24, RPS3); in subtypes 2, the set of most highly connected genes included genes involved in cellular response to stim-ulus response (FOS, DUSP1,JUN, FOSB); in subtypes 3, genes sets including B2M, HLA-A, HLA-B, are related with antigen processing and presentation.
Conclusions
Cancers usually exhibit substantial tumor heterogeneity in virtually all distinguishable phenotypic features, such as cellular morphology, gene expression and metabolism. In order to analyze tumor heterogeneity, it is impor-tant to correctly group cell population into different
Table 1Significant genes and GO analysis of the co-expression networks of different melanoma subtypes
Gene list Term type & name P-value
Subtype 1 RPS24 SNHG5 RPS3 RPL38 BP: cotranslational protein targeting 6.34E-8
RPL12 CTSB PAICS HLA-C BP: translational initiation 2.89E-7
RPS12 MTRNR2L2 MTRNR2L6 BP: regulation of apoptotic process 9.71E-2
GAS5 MTRNR2L10 ARPC1B KEGG: Antigen processing and presentation 8.47E-2
CC: focal adhesion 1.42E-3
Subtype 2 FOSB JUNB JUN IER2 BP: cellular response 2.28E-6
DNAJB1 TOB1 PPP1R15A BP: negative regulation of transcription 7.67E-3
LOC284454 MCL1 BRD2 BP: regulation of cell death 3.025E-3
DUSP1 SLC2A3 ZFP36 MF: transcription factor activity 1.65E-4
KEGG: Osteoclast differentiation 4.96 E-4
Subtype 3 HLA-C CTSB HLA-B GSG1 BP: interferon signaling pathway 2.09E-12
IL12RB1 HLA-A CTSD BP: positive regulation of T cell mediated cytotoxicity 2.96E-9
LOC90834 B2M HLA-F HLA-H BP:antigen processing 1.38E-6
AHNAK HLA-E SHOX BP: immune response 5.22E-11
KEGG:A ntigen processing and presentation 8.11E-8
Subtype 4 MTRNR2L6 MTRNR2L10 BP: cellular response to hormone stimulus 1.33E-2
MTRNR2L1 MTRNR2L3 BP: response to mechanical stimulus 1.50E-2
MTRNR2L2 MTRNR2L8 KEGG: Osteoclast differentiation 1.89E-2
FOSB IER2 MTRNR2L4 MF:DNA binding 8.34E-3
MTRNR2L7 ARGLU1 MF: transcription factor activity 6.79E-3
JUN RBM39 SET
Subtype 5 SHISA9 ABCC9 ORC4 KEGG: Cell cycle 5.28E-2
UGDH-AS1 LOC643406 ASTN2 CC: integral component of membrane 7.95E-2
MDM2 UGT8 LOC286437 CC: synapse 8.59E-2
TMEM212 XKR9 GLIPR1L2
SPC25 ARHGEF26-AS1
Subtype 6 C17orf76-AS1 RPS4X BP:translational initiation 1.21E-18
RPS6 GAS5 RPL29 BP:rRNA processing 7.40E-17
RPS3 RPS24 RPS27 BP:ribosomal small subunit biogenesis 8.07E-5
EEF1G RPS19 RPLP0 MF:structural constituent of ribosome 1.76E-15
subtypes based on single-cell expression data. Due to the unavoidable biological and technical variations, these scRNA-seq dataseta are noisy and high dimensional, which poses great challenges to the computational meth-ods. In this paper, we proposed, conCluster, an unsu-pervised consensus clustering method to overcome these limitation and provide robust clustering. Specifically, our conCluster fuses many basic partitions to a consen-sus one, this procedure may reduce the impact that the performances of individual clustering method tend to affected by noises and different initial parameters. Moreover, data preprocessing steps such as dimension-ality reduction is important in scRNA-seq data analysis. The experimental result indicates that the proposed con-Cluster can more accurately detect cancer subtypes than the compared widely used scRNA-seq clustering meth-ods. The performance improvement of conCluster will be of interest to researchers in the field of scRNA-seq data analysis.
Abbreviations
CIDR: Clustering through imputation and dimensionality reduction; DAVID: The database for annotation, visualization and integration discovery; PCA: Principal component analysis; SC3: Single-cell consensus clustering; scRNA-seq: Single-cell RNA sequencing; SINCERA: SINgle CEll RNA-seq profiling analysis; SNN-Cliq: Shared nearest neighbor-Cliq; t-SNE: t-distributed stochastic neighbor embedding algorithm; WGCNA: Weighted gene co-expression network analysis
Acknowledgements
We thank anonymous reviewers for their useful comments on the manuscript.
Funding
This work and the publication costs were sponsored in part by the Fundamental Research Funds for the Central Universities (2232016A3-05), the National Natural Science Foundation of China (61772128, 61772367), National Key Research and Development Program of China (2016YFC0901704) and Shanghai Natural Science Foundation (17ZR1400200,18ZR1414400).
Availability of data and materials
Datasets GSE72056 and GSE73727 can be downloaded at the following URL
https://www.ncbi.nlm.nih.gov/geo/query/acc.cgi.
About this supplement
This article has been published as part ofBMC Medical Genomics Volume 11 Supplement 6, 2018: Proceedings of the 29th International Conference on Genome Informatics (GIW 2018): medical genomics. The full contents of the supplement are available online athttps://bmcmedgenomics.biomedcentral.com/articles/ supplements/volume-11-supplement-6.
Authors’ contributions
YLG and NL are responsible for the main idea, as well as the completion of the manuscript and experiment. GBZ, YCX and JHG have coordinated data preprocessing and supervised the effort. All authors have read and approved the final manuscript.
Ethics approval and consent to participate
Not applicable.
Consent for publication
Not applicable.
Competing interests
The authors declare that they have no competing interests.
Publisher’s Note
Springer Nature remains neutral with regard to jurisdictional claims in published maps and institutional affiliations.
Author details
1School of Computer Science and Technology, Donghua University, Shanghai,
China.2School of Computer Engineering and Science, Shanghai University, Shanghai, China.3Department of Computer Science and Technology, Tongji University, Shanghai, China.
Published: 31 December 2018
References
1. Meacham CE, Morrison SJ. Tumour heterogeneity and cancer cell plasticity. Nature. 2013;501(7467):328.
2. Oesper L, Mahmoody A, Raphael BJ. Theta: inferring intra-tumor heterogeneity from high-throughput dna sequencing data. Genome Biol. 2013;14(7):R80.
3. Roth A, Khattra J, Yap D, Wan A, Laks E, Biele J, Ha G, Aparicio S, Bouchard-Côté A, Shah SP. Pyclone: statistical inference of clonal population structure in cancer. Nat Methods. 2014;11(4):396.
4. Navin N, Kendall J, Troge J, Andrews P, Rodgers L, McIndoo J, Cook K, Stepansky A, Levy D, Esposito D, et al. Tumour evolution inferred by single-cell sequencing. Nature. 2011;472(7341):90.
5. Patel AP, Tirosh I, Trombetta JJ, Shalek AK, Gillespie SM, Wakimoto H, Cahill DP, Nahed BV, Curry WT, Martuza RL, et al. Single-cell rna-seq highlights intratumoral heterogeneity in primary glioblastoma. Science. 2014;344(6190):1396–401.
6. Pollen AA, Nowakowski TJ, Chen J, Retallack H, Sandoval-Espinosa C, Nicholas CR, Shuga J, Liu SJ, Oldham MC, Diaz A, et al. Molecular identity of human outer radial glia during cortical development. Cell. 2015;163(1):55–67.
7. Zeisel A, Muñoz-Manchado AB, Codeluppi S, Lönnerberg P, La Manno G, Juréus A, Marques S, Munguba H, He L, Betsholtz C, et al. Cell types in the mouse cortex and hippocampus revealed by single-cell rna-seq. Science. 2015;347(6226):1138–42.
8. Chung W, Eum HH, Lee H-O, Lee K-M, Lee H-B, Kim K-T, Ryu HS, Kim S, Lee JE, Park YH, et al. Single-cell rna-seq enables comprehensive tumour and immune cell profiling in primary breast cancer. Nat Commun. 2017;8: 15081.
9. Haque A, Engel J, Teichmann SA, Lönnberg T. A practical guide to single-cell rna-sequencing for biomedical research and clinical applications. Genome Med. 2017;9(1):75.
10. Kharchenko PV, Silberstein L, Scadden DT. Bayesian approach to single-cell differential expression analysis. Nat Methods. 2014;11(7):740. 11. Ji Z, Ji H. Tscan: Pseudo-time reconstruction and evaluation in single-cell
rna-seq analysis. Nucleic Acids Res. 2016;44(13):e117.
12. Fiers MW, Minnoye L, Aibar S, Bravo González-Blas C, Kalender Atak Z, Aerts S. Mapping gene regulatory networks from single-cell omics data. Brief Funct Genomics. 2018;17(4):246–54.
13. Stegle O, Teichmann SA, Marioni JC. Computational and analytical challenges in single-cell transcriptomics. Nat Rev Genet. 2015;16(3):133. 14. Yau C, et al. pcareduce: hierarchical clustering of single cell transcriptional
profiles. BMC Bioinforma. 2016;17(1):140.
15. Maaten Lvd, Hinton G. Visualizing data using t-sne. J Mach Learn Res. 2008;9(Nov):2579–605.
16. Macosko EZ, Basu A, Satija R, Nemesh J, Shekhar K, Goldman M, Tirosh I, Bialas AR, Kamitaki N, Martersteck EM, et al. Highly parallel genome-wide expression profiling of individual cells using nanoliter droplets. Cell. 2015;161(5):1202–14.
17. Lin P, Troup M, Ho JW. Cidr: Ultrafast and accurate clustering through imputation for single-cell rna-seq data. Genome Biol. 2017;18(1):59. 18. Xu C, Su Z. Identification of cell types from single-cell transcriptomes
using a novel clustering method. Bioinformatics. 2015;31(12):1974–80. 19. Guo M, Wang H, Potter SS, Whitsett JA, Xu Y. Sincera: a pipeline for
single-cell rna-seq profiling analysis. PLoS Comput Biol. 2015;11(11): 004575.
21. Butler A, Hoffman P, Smibert P, Papalexi E, Satija R. Integrating single-cell transcriptomic data across different conditions, technologies, and species. Nat Biotechnol. 2018;36(5):411.
22. Cali ´nski T, Harabasz J. A dendrite method for cluster analysis. Commun Stat-Theory Methods. 1974;3(1):1–27.
23. Pan Y, Wang Z, Zhan W, Deng L. Computational identification of binding energy hot spots in protein–rna complexes using an ensemble approach. Bioinformatics. 2018;34(9):1473–80.
24. Hubert L, Arabie P. Comparing partitions. J Classif. 1985;2(1):193–218. 25. Tirosh I, Izar B, Prakadan SM, Wadsworth MH, Treacy D, Trombetta JJ,
Rotem A, Rodman C, Lian C, Murphy G, et al. Dissecting the multicellular ecosystem of metastatic melanoma by single-cell rna-seq. Science. 2016;352(6282):189–96.
26. Li J, Klughammer J, Farlik M, Penz T, Spittler A, Barbieux C, Berishvili E, Bock C, Kubicek S. Single-cell transcriptomes reveal characteristic features of human pancreatic islet cell types. EMBO Rep. 2016;17(2):178–87. 27. Huang DW, Sherman BT, Lempicki RA. Systematic and integrative