Open Access
Research
Real time electrocardiogram QRS detection using combined
adaptive threshold
Ivaylo I Christov*
Address: Center of Biomedical Engineering, Bulgarian Academy of Sciences, Acad. G. Bonchev str., blok 105, 1113, Sofia, Bulgaria
Email: Ivaylo I Christov* - [email protected] * Corresponding author
Abstract
Background: QRS and ventricular beat detection is a basic procedure for electrocardiogram (ECG) processing and analysis. Large variety of methods have been proposed and used, featuring high percentages of correct detection. Nevertheless, the problem remains open especially with respect to higher detection accuracy in noisy ECGs
Methods: A real-time detection method is proposed, based on comparison between absolute values of summed differentiated electrocardiograms of one of more ECG leads and adaptive threshold. The threshold combines three parameters: an adaptive slew-rate value, a second value which rises when high-frequency noise occurs, and a third one intended to avoid missing of low amplitude beats.
Two algorithms were developed: Algorithm 1 detects at the current beat and Algorithm 2 has an RR interval analysis component in addition.
The algorithms are self-adjusting to the thresholds and weighting constants, regardless of resolution and sampling frequency used. They operate with any number L of ECG leads, self-synchronize to QRS or beat slopes and adapt to beat-to-beat intervals.
Results: The algorithms were tested by an independent expert, thus excluding possible author's influence, using all 48 full-length ECG records of the MIT-BIH arrhythmia database. The results were: sensitivity Se = 99.69 % and specificity Sp = 99.65 % for Algorithm 1 and Se = 99.74 % and Sp = 99.65 % for Algorithm 2.
Conclusion: The statistical indices are higher than, or comparable to those, cited in the scientific literature.
Background
The QRS complexes and ventricular beats in an electrocar-diogram represent the depolarization phenomenon of the ventricles and yield useful information about their behav-ior. Beat detection is a procedure preceding any kind of ECG processing and analysis. For morphological analysis
this is the reference for detection of other ECG waves and parameter measurements. Rhythm analysis requires clas-sification of QRS and other ventricular beat complexes as normal and abnormal. Real-time ventricular beat detec-tion is essential for monitoring of patients in critical heart condition.
Published: 27 August 2004
BioMedical Engineering OnLine 2004, 3:28 doi:10.1186/1475-925X-3-28
Received: 04 June 2004 Accepted: 27 August 2004
This article is available from: http://www.biomedical-engineering-online.com/content/3/1/28
© 2004 Christov; licensee BioMed Central Ltd.
Correct beats recognition is impeded by power-line inter-ference, electromyogram noise and baseline wander often present in the ECG signal.
In long-term monitoring electrode impedance can increase considerably, resulting in very low signal-to-noise ratio, which can make detection practically impossi-ble in a single lead. Therefore, usually two or three leads are used for monitoring [1].
Friesen et al. [2] have presented a comparison of nine QRS detection algorithms, based on: i) amplitude and first derivative, ii) first derivative only, iii) first and second derivative, and iv) digital filtering. Daskalov et al. [3] applied these algorithms to selected signals containing records with pronounced baseline drift. The results were unsatisfactory, which was probably due to the use of fixed detection thresholds, whereas adaptive ones would be more appropriate.
Poli et al. [4] used a generic algorithm for QRS detection. The complexes were emphasized with respect to the rest of the signal by polynomial filters and compared to an adap-tive threshold. The authors reported 99.60 % sensitivity (Se) and 99.51 % specificity (Sp) with the MIT-BIH Arrhythmia Database. The method is inapplicable in real-time.
Afonso et al. [5] proposed hardware filter banks for ECG signal decomposition, where several parameters were independently computed and combined in a decision rule. The authors reported Se = 99.59 % and Sp = 99.56 % for their real-time, single-channel beat detection algo-rithm tested with the MIT-BIH Arrhythmia Database.
Dotsinsky and Stoyanov [6] developed a heuristic, pseudo-real-time algorithm for ventricular beat detection for single-channel ECG, based on steep edges and sharp peaks evaluation criteria. They reported Se = 99.04% and Sp = 99.62%, obtained with two channel recordings from AHA and MIT-BIH Arrhythmia Database
Moraes et al. [1] combined logically two different algo-rithms working in parallel – the first has been taken from the work of Englese and Zeelenberg [7] and the other was based on Pan and Tompkins [8], and Ligtenberg and Kunt [9]. Moraes et al. [1] reported Se = 99.22 % and Sp = 99.73 % after having excluded records of patients with pace-maker. After excluding a few more recordings 108, 200, 201 and 203, containing high amplitude noise (according to the authors), the statistical indices rises to Se = 99.56 % and Sp = 99.82 %.
Li et al. [10] have used wavelet transforms for detection. They reported 0.15 % false detections out of 46 files from
the MIT-BIH Arrhythmia Database, but with exclusion of files 214 and 215. In addition, we found some errors in their Table II. After correction, the reported accuracy slightly decreased.
The large variety of QRS detection algorithms, and the continuous efforts for their enhancement, proves that uni-versally acceptable solution has not been found yet. Diffi-culties arise mainly from the huge diversity of the QRS complex waveforms and the noise and artifacts accompa-nying the ECG signals.
ECG databases
All 48 ECG recordings of MIT-BIH Arrhythmia database were used, without exception. Each one has a duration of 30 min and includes two leads – the modified limb lead II and one of the modified leads V1, V2, V4 or V5 [11]. The sampling frequency is 360 Hz with resolution 5 µV/bit. Two cardiologists have annotated all beats. Approxi-mately 70 % of the beats are annotated as Normal. Four of the records are from patients with pacemakers.
The American Heart Association (AHA) database was also considered, during the evaluation of the method, mostly due to the fact that it contains patients with premature ventricular beats of contraction of R-over-T type, some of them very difficult to detect because of their closeness to the previous complex. Statistical indices for this database are not derived, because they can be compared with lim-ited number of articles working with AHA. The database consists of 80 recordings: 2-leads, 250 Hz sampling rate and 5 µV/bit resolution.
Method
The differentiated and summed signals from L leads are compared to the absolute value of a threshold MFR = M + F + R – a combination of three independent adaptive thresholds, where:
• M – Steep-slope threshold;
• F – Integrating threshold for high-frequency signal components;
• R – Beat expectation threshold.
Two algorithms were developed:
Algorithm 1 detects at the current beat.
The algorithms are self-adjusting to the thresholds and weighting constants, regardless of resolution and sam-pling frequency used. They operate with any number L of ECG leads, self-synchronize to QRS or beat slopes and adapt to beat-to-beat intervals.
Preprocessing
• Moving averaging filter for power-line interference sup-pression: averages samples in one period of the power-line interference frequency with a first zero at this frequency.
• Moving averaging of samples in 28 ms interval for elec-tromyogram noise suppression – a filter with first zero at about 35 Hz.
• Moving averaging of a complex lead (the sintesis is explained in the next section) in 40 ms intervals – a filter with first zero at about 25 Hz. It is suppressing the noise magnified by the differentiation procedure used in the process of the complex lead sintesis.
Complex lead
The algorithm operates with a complex lead Y of several primary leads L. In cases of 12-standard leads, synthesis of the three quasi-orthogonal Frank leads is recommended first [3,12], thus determining the complex lead as a spatial vector. The complex lead is obtained as:
where Xj(i) is the amplitude value of the sample i in lead j, and Y(i) is the current complex lead.
The above formula (except the normalizing coefficient 1/ L and the absolute value) was initially adopted from the work of Bakardjian [13]. Operating with unsigned (abso-lute) values proved convenient when dealing with QRSs and extrasystoles having different, for example positive (in one lead) and negative (in the other lead) deflections.
Adaptive steep-slope threshold – M
• Initially M = 0.6*max(Y) is set for the first 5 s of the sig-nal, where at least 2 QRS complexes should occur. A buffer with 5 steep-slope threshold values is preset:
MM = [M1M2M3M4M5],
where M1 ÷ M5 are equal to M.
• QRS or beat complex is detected if Yi ≥ MFR,
• No detection is allowed 200 ms after the current one. In the interval QRS ÷ QRS+200ms a new value of M5 is calculated:
newM5 = 0.6*max(Yi)
The estimated newM5 value can become quite high, if steep slope premature ventricular contraction or artifact appeared, and for that reason it is limited to newM5 = 1.1* M5 if newM5 > 1.5* M5.
The MM buffer is refreshed excluding the oldest compo-nent, and including M5 = newM5. M is calculated as an average value of MM.
• M is decreased in an interval 200 to 1200 ms following the last QRS detection at a low slope, reaching 60 % of its refreshed value at 1200 ms.
• After 1200 ms M remains unchanged.
The thresholds definitions are presented in more detail with the help of several examples. Two ECG leads are shown in Fig. 1a. Detected QRSs are marked with 'red O' on Lead 1. The summary lead and the steep-slope thresh-old are represented in Fig. 1b.
Adaptive integrating threshold – F
The integrating threshold F is intended to raise the com-bined threshold if electromyogram noise is accompany-ing the ECG, thus protectaccompany-ing the algorithm against 'erroneous beat detection'.
Initially F is the mean value of the pseudo-spatial velocity Y for 350 ms.
With every signal sample, F is updated adding the maxi-mum of Y in the latest 50 ms of the 350 ms interval and subtracting maxY in the earliest 50 ms of the interval.
F = F + (max(Yin latest 50 ms in the 350 ms interval) - max(Yin earliest
50 ms in the 350 ms interval))/150
The way F is updated means that not every sample in the interval is integrated, but just the envelope of the pseudo-spatial velocity Y. The weight coefficient 1/150 is empiri-cally derived.
Two ECG leads are shown in Fig. 2a. The pseudo-spatial velocity Y and the integrated threshold are presented in Fig. 2b. The correct detection is due to the rise of F (hence of MFR) with about 0.2 mV. The beat complex is included in the integration process (note the high rise of F after any of the complexes), thus making almost impossible a close detection to the previous complex.
Y(i) abs(Xj(i 1) Xj(i 1))
j 1 L = + − − =
∑
1 1Adaptive beat expectation threshold – R
The beat expectation threshold R is intended to deal with heartbeats of normal amplitude followed by a beat with very small amplitude (and respectively with very small slew rate). This can be observed for example in cases of electrode artifacts. Conversely to the integrating threshold protecting against erroneous QRS detection, R is protect-ing against 'QRS misdetection'.
A buffer with the 5 last RR intervals is updated at any new QRS detection. Rm is the mean value of the buffer.
• R = 0 V in the interval from the last detected QRS to 2/3 of the expected Rm.
• In the interval QRS + Rm * 2/3 to QRS + Rm, R decreases 1.4 times slower then the decrease of the previously dis-cussed steep slope threshold (M in the 200–1200 ms interval).
• After QRS + Rm the decrease of R is stopped.
The time-course of the beat expectation threshold R is shown in Fig. 3. The decrease of R (respectively MFR) with about 0.2 mV at the fourth QRS allows its detection, despite the lack of complex in Lead 2, which leads to a two-fold decrease of the summary lead amplitude Y (Fig. 3b).
Adaptive steep-slope threshold
Figure 1
Adaptive steep-slope threshold
Adaptive integrating threshold
Figure 2
Combined adaptive threshold – MFR
The combined adaptive threshold is a sum of the adaptive steep-slope threshold, adaptive integrating threshold and adaptive beat expectation thresholds. (Fig. 4)
MFR = M + F + R
Algorithm 2: pseudo-real-time detection with additional triggering of eventually missed heart beat in the last detected RR interval
All previous considerations relate to Algorithm 1, which detects a beat at its occurrence. Additional checking for an eventually missed heartbeat is performed by Algorithm 2. Its function is explained by the signal in Fig. 5. The fourth
complex at the 15.2 s in Fig. 5b should be missed due to the fact that, MFR is greater then the summary lead Y.
Let's mark the previous RR interval with t1 and the last – with t2 (Fig. 5a).
If t1 is not shortened, which is tested by logic OR of the 2 conditions t1>Rm OR Rm-t1<0.12*Rm AND in the same time t2 is quite long to fulfill the condition abs(t2-2*Rm)<0.5*Rm, the interval is subjected to check for a missed complex.
A test is performed on each of the primary leads where a sharp peak is searched (defined as a product > 4 µV of two Adaptive beat expectation threshold
Figure 3
Adaptive beat expectation threshold
Combined adaptive threshold
Figure 4
signal differences having one central and two lateral points 8 ms apart). If the test is passed, a second one is car-ried out for the amplitude of the summary lead at that point, which should be bigger then 1/3 of the mean value of the buffer MM, in order to define this point as a missed QRS complex.
Results and discussion
Normally the statistical indices Se and Sp are derived from the following parameters: correctly detected beats TP (true positive), falsely detected beats FP (false positive) and undetected beats FN (false negative). In addition, we used two parameters, adopted from Dotsinsky and Stoyanov [6], as described below.
SP – shifted positive error was introduced in order to explain cases like the one shown in Fig. 6. Here the algo-rithm made a false positive error before the 3rd QRS and missed the following QRS. Formally, this is a false positive error, immediately followed by a false negative. However, if the time interval between these two detections is reason-ably short, for example ≤ 200 ms, we accepted this as one error only, labeled as Shifted False Positive Error (SP).
Another example of SP error as a result of artifacts just before the normal complexes is shown in Fig. 7.
SN – shifted negative error was assumed by the same prin-ciple as SP, but in the opposite sense. It also included twin FN+FP error occurring within 200 ms. The first incoming FP or FN error of the shifted is defining it as SP or SN.
The logic of using shifted errors (instead of FP and FN or FN and FP in cases when they appear within 200 ms of each other) is that thus the total number of beats in a record retains its value. Otherwise it would change depending on the type and number of errors and thus impede correct computation of Se and Sp.
The sensitivity Se is calculated by summing FN SN, while the specificity Sp – by summing FP+SP.
Pseudo-real-time detection with additional triggering of eventually missed heart beat in the last RR interval
Figure 5
Pseudo-real-time detection with additional triggering of eventually missed heart beat in the last RR interval.
Shifted positive error at the P wave
Figure 6
Shifted positive error at the P wave
Se TP
TP FN SN Sp
TP TP FP SP
=
The method was developed in Matlab. All 48 recordings from the MIT-BIH Arrhythmia database, without any exception, were used for testing the two algorithms.
The processed files containing detection marks were auto-matically compared with the original MIT-BIH annotated beats by specially designed software. It shows all cases where the annotation and detection marks differ by more than 60 ms. These cases were examined by an independ-ent expert, thus excluding possible author's influence.
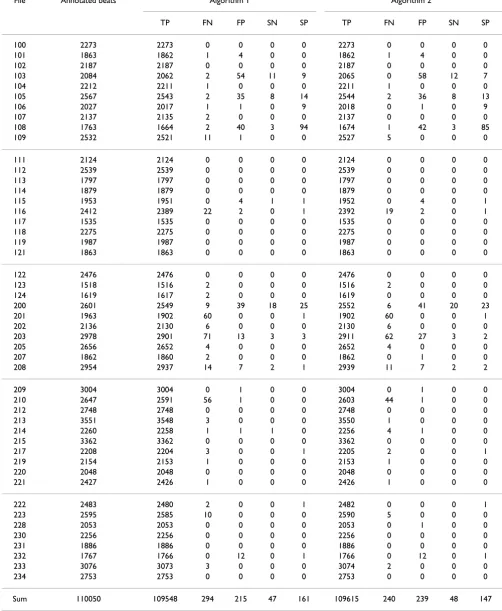
The results for the two algorithms are presented in Table 1.
Of all 110050 annotated beats ('unknown' or 'questiona-ble' were excluded from the study), true detected are 109548 for Algorithm 1 and 109616 for Algorithm 2. The statistical indices are:
Algorithm 1: Se = 99.69 %, Sp = 99.66 %;
Algorithm 2: Se = 99.74 %, Sp = 99.65 %.
The standard way of Se and Sp calculation,
considering the joint SP and SN errors as two separate errors gives the following results:
Algorithm 1: Se = 99.54 %, Sp = 99.61 %;
Algorithm 2: Se = 99.60 %, Sp = 99.60 %.
Algorithm 2 improved the sensitivity by 0.05 % (0.06 % for the standard evaluation) as a result of decreased number of undetected beats. This result can be observed for example in recordings 109,203, 210 and 223, where the additionally detected beats are respectively 6, 9, 12 and 5. The performance of both algorithms was especially tested with the file A5001 from the AHA containing R-over-T premature ventricular complexes, very close to the previous normal QRS complex (Fig. 5a). An improvement of 74 undetected by Algorithm 1 R-on-T complexes was observed. The detection of such premature ventricular complexes occurring at the time of ventricular repolarization was considered important, having in mind possible risk of ventricular fibrillation triggering by R-on-T events.
Conclusions
The proposed algorithms for real-time and pseudo-real-time implementation are adaptive, independent of thresholds and constants values. They are self-synchro-nized to the QRS steep slope and the heart rhythm, regard-less of the resolution and sampling frequency used. Due to the integration threshold, the algorithms are practically insensitive to electromyogram and similar high-frequency noise.
The algorithms can operate with one, two or more leads, using a combined lead signal derived from the sum of absolute values of the differentiated lead signals.
The statistical indices are higher than, or comparable to those, cited in the scientific literature.
Shifted positive errors, false positive + false negative twins
Figure 7
Shifted positive errors, false positive + false negative twins
Se TP
TP FN Sp
TP TP FP
=
Table 1: Statistical results for the two algorithms
File Annotated beats Algorithm 1 Algorithm 2
TP FN FP SN SP TP FN FP SN SP
100 2273 2273 0 0 0 0 2273 0 0 0 0
101 1863 1862 1 4 0 0 1862 1 4 0 0
102 2187 2187 0 0 0 0 2187 0 0 0 0
103 2084 2062 2 54 11 9 2065 0 58 12 7
104 2212 2211 1 0 0 0 2211 1 0 0 0
105 2567 2543 2 35 8 14 2544 2 36 8 13
106 2027 2017 1 1 0 9 2018 0 1 0 9
107 2137 2135 2 0 0 0 2137 0 0 0 0
108 1763 1664 2 40 3 94 1674 1 42 3 85
109 2532 2521 11 1 0 0 2527 5 0 0 0
111 2124 2124 0 0 0 0 2124 0 0 0 0
112 2539 2539 0 0 0 0 2539 0 0 0 0
113 1797 1797 0 0 0 0 1797 0 0 0 0
114 1879 1879 0 0 0 0 1879 0 0 0 0
115 1953 1951 0 4 1 1 1952 0 4 0 1
116 2412 2389 22 2 0 1 2392 19 2 0 1
117 1535 1535 0 0 0 0 1535 0 0 0 0
118 2275 2275 0 0 0 0 2275 0 0 0 0
119 1987 1987 0 0 0 0 1987 0 0 0 0
121 1863 1863 0 0 0 0 1863 0 0 0 0
122 2476 2476 0 0 0 0 2476 0 0 0 0
123 1518 1516 2 0 0 0 1516 2 0 0 0
124 1619 1617 2 0 0 0 1619 0 0 0 0
200 2601 2549 9 39 18 25 2552 6 41 20 23
201 1963 1902 60 0 0 1 1902 60 0 0 1
202 2136 2130 6 0 0 0 2130 6 0 0 0
203 2978 2901 71 13 3 3 2911 62 27 3 2
205 2656 2652 4 0 0 0 2652 4 0 0 0
207 1862 1860 2 0 0 0 1862 0 1 0 0
208 2954 2937 14 7 2 1 2939 11 7 2 2
209 3004 3004 0 1 0 0 3004 0 1 0 0
210 2647 2591 56 1 0 0 2603 44 1 0 0
212 2748 2748 0 0 0 0 2748 0 0 0 0
213 3551 3548 3 0 0 0 3550 1 0 0 0
214 2260 2258 1 1 1 0 2256 4 1 0 0
215 3362 3362 0 0 0 0 3362 0 0 0 0
217 2208 2204 3 0 0 1 2205 2 0 0 1
219 2154 2153 1 0 0 0 2153 1 0 0 0
220 2048 2048 0 0 0 0 2048 0 0 0 0
221 2427 2426 1 0 0 0 2426 1 0 0 0
222 2483 2480 2 0 0 1 2482 0 0 0 1
223 2595 2585 10 0 0 0 2590 5 0 0 0
228 2053 2053 0 0 0 0 2053 0 1 0 0
230 2256 2256 0 0 0 0 2256 0 0 0 0
231 1886 1886 0 0 0 0 1886 0 0 0 0
232 1767 1766 0 12 0 1 1766 0 12 0 1
233 3076 3073 3 0 0 0 3074 2 0 0 0
234 2753 2753 0 0 0 0 2753 0 0 0 0
Publish with BioMed Central and every scientist can read your work free of charge
"BioMed Central will be the most significant development for disseminating the results of biomedical researc h in our lifetime."
Sir Paul Nurse, Cancer Research UK
Your research papers will be:
available free of charge to the entire biomedical community
peer reviewed and published immediately upon acceptance
cited in PubMed and archived on PubMed Central
yours — you keep the copyright
Submit your manuscript here:
http://www.biomedcentral.com/info/publishing_adv.asp
BioMedcentral
Acknowledgements
The author gratefully acknowledges the contribution of Prof. Ivan Dotsin-sky, Centre of Biomedical Engineering, Bulgarian Academy of Sciences, for examining and testing the results of the proposed algorithms.
References
1. Moreas JCTB, Seixas MO, Vilani FN, Costa EV: A QRS complex detection algorithm using electrocardiogram leads.Comp in Card 2002, 29:205-208.
2. Friesen GM, Jannett TC, Jadallah MA, Yates SL, Quint SR, Nagle HT: A comparison of the noise sensitivity of nine QRS detection algorithms.IEEE Trans on Biomed Eng 1990, 37:85-98.
3. Daskalov IK, Dotsinsky IA, Christov II: Developments in ECG acquisition, preprocessing, parameter measurement and recording.IEEE Eng in Med & Biol 1998, 17:50-58.
4. Poli R, Cagnoni S, Valli G: Generic design of optimum linear and nonlinear QRS detection. IEEE Trans on Biomed Eng 1995, 42:1137-1141.
5. Afonso VX, Tompkins WJ, Nguyen TQ, Luo S: ECG beat detection using filter banks.Trans Biomed Eng 1999, 2:192-201.
6. Dotsinsky I, Stoyanov T: Ventricular beat detection in single channel electrocardiograms.BioMed Eng OnLine 2004, 3:3 [http:/ /www.biomedical-engineering-online.com/content/3/1/3].
7. Englese WAH, Zeelenberg C: A single scan algorithm for QRS detection and feature extraction.IEEE Comp in Card 1979:37-42. 8. Pan J, Tompkins W: A real-time QRS detection algorithm.IEEE
Trans Biomed Eng 1985, 32:230-236.
9. Ligtenberg A, Kunt M: A robust-digital QRS detection algo-rithm for arrhythmia monitoring. Computers and Biomed Res
1983, 16:273-286.
10. Li C, Zheng C, Tai C: Detection of ECG characteristic points using wavelet transforms. IEEE Trans on Biomed Eng 1995, 42:21-28.
11. Mark R, Moody G: MIT-BIH Arrhythmia data base directory.
Cambridge: Massachusetts Institute of Technology 1988.
12. Levkov C: Orthogonal electrocardiogram derived from the limb and chest electrodes of the conventional 12-lead system.Med Biol Eng Comput 1987, 25:155-164.