Open Access
Research
Maximum static inspiratory and expiratory pressures with different
lung volumes
Christopher G Lausted
1, Arthur T Johnson*
2, William H Scott
2,
Monique M Johnson
3, Karen M Coyne
4and Derya C Coursey
2Address: 1The Institute for Systems Biology, 1441 North 34th Street, Seattle, WA 98103, USA, 2Biological Resources Engineering, University of
Maryland, College Park, MD 20742, USA, 3GE Healthcare Technologies, 3114 N. Grandview Blvd W-553, Waukesha, WI 53188, USA and 4U.S.
Army Edgewood CB Center, APG, MD 21010, USA
Email: Christopher G Lausted - [email protected]; Arthur T Johnson* - [email protected]; William H Scott - [email protected]; Monique M Johnson - [email protected]; Karen M Coyne - [email protected]; Derya C Coursey - [email protected] * Corresponding author
Abstract
Background: Maximum pressures developed by the respiratory muscles can indicate the health of the respiratory system, help to determine maximum respiratory flow rates, and contribute to respiratory power development. Past measurements of maximum pressures have been found to be inadequate for inclusion in some exercise models involving respiration.
Methods: Maximum inspiratory and expiratory airway pressures were measured over a range of lung volumes in 29 female and 19 male adults. A commercial bell spirometry system was programmed to occlude airflow at nine target lung volumes ranging from 10% to 90% of vital capacity.
Results: In women, maximum expiratory pressure increased with volume from 39 to 61 cmH2O
and maximum inspiratory pressure decreased with volume from 66 to 28 cmH2O. In men, maximum expiratory pressure increased with volume from 63 to 97 cmH2O and maximum inspiratory pressure decreased with volume from 97 to 39 cmH2O. Equations describing pressures
for both sexes are:
Pe/Pmax = 0.1426 Ln( %VC) + 0.3402 R2 = 0.95
Pi/Pmax = 0.234 Ln(100 - %VC) - 0.0828 R2 = 0.96
Conclusion: These results were found to be consistent with values and trends obtained by other authors. Regression equations may be suitable for respiratory mechanics models.
Background
While maximum respiratory pressures at the mouth have been measured in numerous subjects, less data exists to characterize maximum pressures as they vary with lung volume. Maximum pressure is volume dependent because
muscle tension is length dependent, because muscle ten-sion produces higher pressure with a smaller radius of cur-vature, and because respiratory tissue is elastic. Rahn et al. [1] first produced static pressure-volume diagrams from a group of adult men, and later, Cook et al. [2] produced
Published: 05 May 2006
BioMedical Engineering OnLine 2006, 5:29 doi:10.1186/1475-925X-5-29
Received: 18 November 2005 Accepted: 05 May 2006
This article is available from: http://www.biomedical-engineering-online.com/content/5/1/29
© 2006 Lausted et al; licensee BioMed Central Ltd.
pressure-volume diagrams from a larger group of subjects including women and children. These diagrams were use-ful in modeling the energetics of respiration [3] and in monitoring the progress of respiratory muscle training [4]. Yet the total number of subjects tested remained small, particularly regarding females. The present paper provides additional static pressure-volume data obtained from adult volunteers, both women and men.
Methods
Subjects
Forty-eight normal subjects agreed to participate in the study. The subjects were recruited from students and staff at the University of Maryland. The study was approved by the Institutional Review Board and all subjects gave informed consent. The subjects' characteristics are shown in Table 1.
Protocol
Subjects were first acquainted with the spirometer and the test protocol. They were instructed in the definition of functional residual capacity (FRC) as the resting volume of the lung and given time to practice finding FRC. The subjects were then measured for inspiratory capacity (IC) and expiratory reserve volume (ERV) relative to FRC. Vol-ume measurements were repeated until three consecutive maneuvers produced volumes within a 100 ml range. The average of the three volumes was recorded. Vital capacity (VC) was calculated as the sum of IC and ERV.
Maximum pressure measurements were taken from occlu-sions occurring at nine predetermined target volumes. The volumes were randomly ordered and ranged from 10% to 90% of VC by 10% increments. Subjects began each maneuver at FRC. Subjects were instructed to inhale or exhale, as necessary, to the desired volume. When the tar-get volume was obtained, the occlusion valve automati-cally closed. The subject was told to inhale or exhale, as necessary, for two seconds. After two seconds of effort, the valve was released. This gave the subject access to fresh air for at least one minute of rest. More time was given, if desired. After all 18 measurements were taken, the test was repeated. The stronger effort, or higher maximum pressure, at each measurement was saved.
Measurements
A commercial spirometery system (Collins™, Braintree, MA) was used for all the measurements. Lung volumes were monitored by the dry-seal bell spirometer. The occlu-sion valve and pressure transducer utilized were those located in what Collins refers to as its "universal breathing valve." Collins "Research Assistant" (RA) software con-trolled the occlusion valve and collected pressure and vol-ume measurements. For the experiment, a supervisory program, "PV", was authored in Microsoft Visual Basic for Applications™ to configure RA and provide feedback to the
experimenters. PV was designed to fill the spirometer with an appropriate volume of fresh air prior to each measure-ment. It then calculated the spirometer volume corre-sponding to the target lung volume, taking thermal expansion into account. Occlusion was triggered automat-ically when the subject reached the target lung volume. As target lung volumes were randomly ordered, a randomiza-tion feature was built into PV. After each occlusion, RA returned pressure and volume data, which PV analyzed and saved to disk. The spirometer was calibrated each test day with a three-liter syringe and the pressure transducer
was calibrated each day with a 10 cmH2O manometer.
Data analysis
The maximum inhalation or exhalation pressure magni-tude (Pi or Pe) at each lung volume (VL) was recorded by the computer. The average pressure for the last one second of each effort was calculated. This pressure was then used to correct VL using the method by Cook et al. [2]. Absolute lung volumes were not measured and volumes were calcu-lated based on the assumption that residual volume was 26% that of TLC.
Results
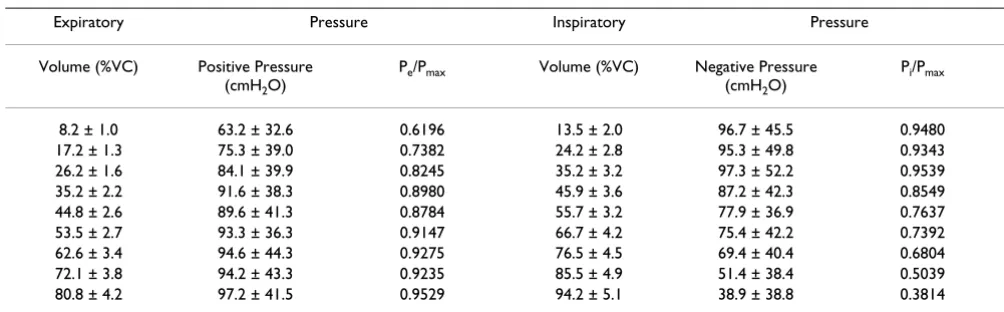
Average maximum pressure values for all of the female subjects tested appear in Table 2 and values for all of the male subjects appear in Table 3. Observations were grouped according to the lung volumes at which occlu-sion occurred and actual volumes within each group were averaged to produce the tabled values. The pressures pro-duced by the men were typically 64% higher than the women in expiration, and 53% higher in inspiration.
Data were then scrutinized in an exploratory manner to see if they could be easily and universally fit by a simple mathematical expression [5]. It was found that both
Table 1: Age, height, weight, and lung volume data in the two groups tested shown with standard deviations.
Group Number of Subjects Average Age (Range) Average Height, cm Average Mass kg Average Vital
Capacity, L
Females 29 25.5 ± 3.7 (18 to 31) 164 ± 6 60.5 ± 13.3 3.58 ± 0.63
men's and women's data could be described by an expres-sion of the form:
Pe/Pmax = A Ln (%VC) + B for exhalation
and
Pi/Pmax = C Ln (100 - %VC) + D for inhalation
Here, Pmax is the asymptotically maximum pressure that
could be developed by the respiratory muscles at any lung
volume and Pi is the maximum inspiratory pressure that
can be developed at specific lung volumes. The average value of Pmax found by determining the limit of the
non-linear P-V curve for the group of subjects was found to be
102 cmH2O for males and 66 cmH2O for females, and
was found to be the same for both inhalation and exhala-tion direcexhala-tions. Least squares regression using Microsoft Excel yielded the following two equations:
Pe/Pmax = 0.1426 Ln (%VC) + 0.3402 R2 = 0.9549
and
Pi/Pmax = 0.234 Ln (100% - %VC) - 0.0828 R2 = 0.9642
These equations are graphed in Figure 1.
Discussion
Greater (more positive) expiratory pressures were devel-oped at higher VL, while greater (more negative)
inspira-tory pressures were developed at lower VL. In women Pe
increased with volume from 39 to 61 cmH2O and Pi
decreased with volume from 66 to 28 cmH2O. In men, Pe
increased with volume from 63 to 97 cmH2O and P1
decreased with volume from 97 to 39 cmH2O. These
trends occur primarily for two reasons. First, respiratory muscles work both with and against respiratory tissue elastance to produce pressure. Expiratory efforts are aided by tissue elastance (lung recoil effects) at high VL and inhibited at low VL. Inspiratory efforts are inhibited by tis-sue elastance at high VL and aided at low VL. Second, res-piratory muscles exert greater tension when they are
Table 3: Maximal inspiratory and expiratory static pressure at different lung volumes for the male subjects.
Expiratory Pressure Inspiratory Pressure
Volume (%VC) Positive Pressure (cmH2O)
Pe/Pmax Volume (%VC) Negative Pressure
(cmH2O)
Pi/Pmax
8.2 ± 1.0 63.2 ± 32.6 0.6196 13.5 ± 2.0 96.7 ± 45.5 0.9480
17.2 ± 1.3 75.3 ± 39.0 0.7382 24.2 ± 2.8 95.3 ± 49.8 0.9343
26.2 ± 1.6 84.1 ± 39.9 0.8245 35.2 ± 3.2 97.3 ± 52.2 0.9539
35.2 ± 2.2 91.6 ± 38.3 0.8980 45.9 ± 3.6 87.2 ± 42.3 0.8549
44.8 ± 2.6 89.6 ± 41.3 0.8784 55.7 ± 3.2 77.9 ± 36.9 0.7637
53.5 ± 2.7 93.3 ± 36.3 0.9147 66.7 ± 4.2 75.4 ± 42.2 0.7392
62.6 ± 3.4 94.6 ± 44.3 0.9275 76.5 ± 4.5 69.4 ± 40.4 0.6804
72.1 ± 3.8 94.2 ± 43.3 0.9235 85.5 ± 4.9 51.4 ± 38.4 0.5039
80.8 ± 4.2 97.2 ± 41.5 0.9529 94.2 ± 5.1 38.9 ± 38.8 0.3814
Volumes are expressed in percent of vital capacity at ambient pressure. All values are shown with standard deviations. Pmax for males was determined to be 102 cmH2O.
Table 2: Maximal inspiratory and expiratory static pressures at different lung volumes for the female subjects.
Expiratory Pressure Inspiratory Pressure
Volume (%VC) Positive Pressure (cmH2O)
Pe/Pmax Volume (%VC) Negative Pressure
(cmH2O)
Pi/Pmax
8.9 ± 0.7 38.7 ± 25.0 0.5864 12.1 ± 0.9 65.9 ± 31.6 0.9985
18.4 ± 1.0 44.2 ± 25.9 0.6697 22.5 ± 1.3 65.0 ± 31.6 0.9848
27.6 ± 1.3 53.4 ± 30.7 0.8091 33.0 ± 1.8 59.6 ± 32.0 0.9030
37.3 ± 1.5 53.7 ± 28.8 0.8136 43.3 ± 2.0 55.0 ± 32.0 0.8333
46.8 ± 1.9 53.3 ± 28.9 0.8076 53.5 ± 2.2 53.0 ± 32.9 0.8030
56.2 ± 2.2 55.4 ± 29.6 0.8394 63.8 ± 2.6 47.6 ± 28.3 0.7212
65.7 ± 2.6 57.3 ± 33.2 0.8682 73.6 ± 2.6 42.3 ± 28.6 0.6409
74.7 ± 3.2 61.7 ± 38.5 0.9398 83.1 ± 2.7 34.2 ± 27.4 0.5182
84.4 ± 3.2 61.2 ± 39.0 0.9273 92.6 ± 2.4 28.0 ± 29.0 0.4242
stretched to greater lengths. Expiratory muscles are stretched when the lung is inflated, while inspiratory mus-cles are stretched when the lung is deflated. Both of these factors describe the general trend of the data.
The volume dependence of Pi was much more
pro-nounced than the volume dependence of Pe in both
women and men. This can be seen as a higher slope of the inspiratory equation compared to the expiratory equation in Figure 1. This may reflect a combination of strength dif-ferences between diaphragm (largely responsible for inha-lation) and abdominal muscles (largely responsible for exhalation) recruitment of intercoastal muscle (largely responsible for posture maintenance), and different mechanical advantages of each type of muscle as the lung volume varies.
The Laplace equation may be relevant here. This equation states that enclosed pressure is proportional to the prod-uct of wall tension and wall thickness and inversely pro-portional to the radius of curvature. The Laplace equation for a sphere differs from that of a cylinder by a factor of
two. Pressure in a sphere (P = ) is twice that of a
cyl-inder (P = ), all other things being equal.
The diaphragm is positioned under the lungs and curves upward in a somewhat spherical shape. As it contracts, it becomes flatter, meaning that its radius of curvature increases. Lung volume increases as the diaphragm con-tracts. If the Laplace equation can be applied to the respi-ratory system, then it would show that inspirespi-ratory pressure should decrease as radius, and thus lung volume,
increases (Pi ∝ , as long as wall tension and thickness
remain steady).
The abdominal muscles are arranged differently, more like wrapping around a cylinder. The abdominal muscles flatten at smaller lung volumes instead of larger lung vol-umes, and the Laplace equation indicates that higher pres-sures should be developed at larger lung volumes (P ∝ V).
2τ∆r r τ∆r
r
1
V
Graph of empirical equations determined to describe relative expiratory and inspiratory pressures for men and women Figure 1
Both effects have been observed. Inspiratory pressures increase as lung volume decreases and expiratory pressure increases as lung volume increases. There is roughly a fac-tor of two between the dependence of pressures upon lung volumes for inspiration and expiration. This could well be related to the difference in the Laplace equation for a sphere and a cylinder.
The pressure-volume data obtained in this study are of the same general magnitudes as those previously reported [1,2,6]. Rahn et al. [1] studied Pi in 11 men and Pe in 12 men using similar methods. The highest pressures from three efforts at each of six starting volumes were recorded. Measurements were read from a mercury manometer con-nected to the subjects' noses. Pressure-volume data closely match the results of the present study. Craig [6] produced pressure-volume diagrams from 10 men using methods similar to the present study. Pressures were taken from a mercury manometer connected to the subjects' mouths. These data also closely match the results of the present study. Cook et al. [2] studied 17 males and 9 females using two techniques. One technique was a conventional occlusion maneuver. The other technique involved sub-jects breathing into or out of large, fixed volumes. The compressibility of the air in differently sized containers provided for various ultimate lung volumes. The volumes were calculated from Boyle's Law using peak pressures that could be sustained for 1–2 seconds. Five volumes were used. It was concluded that the results of the occlu-sion method and the compresocclu-sion method were the same.
In women, the compression-method Pi values were
simi-lar to those of the present study at high volumes, but slightly higher at lower volumes. The Pe values were simi-lar at low volumes, but much higher at higher lung
vol-umes. In men, the compression-method Pi values agree
well with those of the present study. However, the Pe val-ues are much higher than those of the present study at the higher volumes. Cook et al. [2] suggested that their Pe val-ues might have been higher than the Rahn et al. valval-ues because of the use of mouth pressure measurements rather than nose pressure measurements. It was also hypothesized that these Pe values exceeded Craig's values due to better mouthpiece sealing.
As the results of this study are more in agreement with work of Rahn et al. [1] and Craig [6], it is more likely that there is another reason for the discrepancy. Aside from muscle strength alone, Pe and Pi are highly effort depend-ent. Subjects may limit their maximum pressures due to factors such as pain in the ear or general discomfort. Dur-ing some maximum pressure maneuvers, researchers have observed changes in hemodynamics leading to loss of consciousness [7]. It is possible that the subjects of the Cook et al. [2] study were more highly motivated. It is also
possible that these subjects were of above average strength.
Numerous authors have collected maximal pressures at a single VL. Most recently, Wilson et al. [8] measured
maxi-mal Pe and Pi in 87 women and 48 men using partial
occlusion and Bourdon gauges. The women were found to have Pe = 93 ± 17 cmH2O and Pi = 73 ± 22 cmH2O and the
men were found to have Pe = 148 ± 34 cmH2O and Pi =
106 ± 31 cmH2O. It could be expected that the Pi and Pe values from a single volume study would exceed the val-ues from a multiple volume study because more efforts
are made at the optimal VL in the single volume study,
while muscle fatigue can be a factor in the multiple vol-ume study.
Judging from inspiration values, this does not appear to be the case. In the present study, women were found to
have Pi = 66 ± 32 cmH2O at VL = 12%VC and men were
found to have Pi = 97 ± 46 cmH2O at VL = 14%VC. These
values are virtually identical to the Wilson et al. [8] data. On the other hand, women in this study were found to
have Pe = 61 ± 39 cmH2O at VL = 84%VC and men were
found to have Pe 97 ± 42 cmH2O at VL = 81%VC. These
values are considerably smaller than the Wilson et al. data. The Pe values of the single volume study fall in between
the maximum Pe values of the present study and the
max-imum Pe values of the Cook et al. [2] study.
Satisfactorily describing maximum lung pressures with mathematical expressions can be helpful for respiratory mechanical modeling [3]. It is not likely that maximal pressures would be developed in young, healthy adults during quiet breathing. During exercise, and especially during expiratory flow limitation, however, maximum pressures may well be developed. For example, modeling the effects of respiratory masks during hard work could use these equations to calculate respiratory work rate. These equation forms are good because pressures and lung volumes both appear as relative rather than absolute values. That way, both men's and women's pressures could be determined with the same equations despite large differences in absolute pressures developed. Respira-tory models for those conditions could well use the equa-tions developed here.
Publish with BioMed Central and every scientist can read your work free of charge "BioMed Central will be the most significant development for disseminating the results of biomedical researc h in our lifetime."
Sir Paul Nurse, Cancer Research UK
Your research papers will be:
available free of charge to the entire biomedical community
peer reviewed and published immediately upon acceptance
cited in PubMed and archived on PubMed Central
yours — you keep the copyright
Submit your manuscript here:
http://www.biomedcentral.com/info/publishing_adv.asp
BioMedcentral
equations developed here could have more universal value.
Conclusion
Maximum pressures at the mouth have been determined to depend on lung volumes. Equations to describe these pressures have been developed, and these are in a form that may be useful for modeling and predictive purposes.
Abbreviations
ERV expiratory reserve volume of the lung, L
FRC functional residual capacity of the lung, L
IC inspiratory capacity of the lung, L
Pe volume-dependent maximum expiratory pressure,
cmH2O
Pi volume-dependent maximum inspiratory pressure,
cmH2O
Pmax volume-independent maximum pressure, cmH2O
PV name of supervisory computer program
RA proprietary data acquisition and analysis program from Collins
TLC total lung capacity, L
VL lung volume, LVC
VC vital capacity of the lung, L
Competing interests
The author(s) declare that they have no competing inter-ests.
Authors' contributions
CGL wrote software and procedures, and conducted many of the tests. ATJ suggested the experiment, wrote much of the paper, and determined the form of equations. WHS provided support, including planning, protocol, and sup-plies. MMJ assisted with planning and conducted many of the tests. KMC assisted with planning and conducted many of the tests. DCC provided data analysis support.
Acknowledgements
This study was supported by the University of Maryland.
References
1. Rahn HA, Otis AB, Chadwick LE, Fenn WO: The pressure-volume diagram of the thorax and lung. Amer J Physiol 1946,
146:161-178.
2. Cook CD, Mead J, Orzalesi MM: Static volume-pressure charac-teristics of the respiratory system during maximal efforts. J Appl Physiol 1964, 19:1016-1022.
3. Johnson AT: How much work is expended for respiration.
Front Med Biol Engr 1993, 5:256-297.
4. Tzelpix GE, Vega DL, Cohen ME, Dennis McCool : Lung volume specificity of inspiratory muscle training. J Appl Physiol 1994,
77:789-794.
5. Johnson AT: Multidimensional curve-fitting program for bio-logical data. Comput Prog Biomed 1984, 18:59-64.
6. Craig AB: Maximal work of one breathing cycle. J Appl Physiol 1960, 15:1098-1100.
7. Milic-Emili J, Orzalesi MM, Cook CD, Turner JM: Respiratory tho-raco-abdominal mechanics in man. J Appl Physiol 1964,
19:217-223.