R E S E A R C H A R T I C L E
Open Access
A systematic comparison and evaluation of high
density exon arrays and RNA-seq technology
used to unravel the peripheral blood
transcriptome of sickle cell disease
Nalini Raghavachari
1*, Jennifer Barb
2, Yanqin Yang
1, Poching Liu
1, Kimberly Woodhouse
1, Daniel Levy
4,5,
Christopher J O
‘
Donnell
4,6, Peter J Munson
2and Gregory J Kato
3Abstract
Background:Transcriptomic studies in clinical research are essential tools for deciphering the functional elements of the genome and unraveling underlying disease mechanisms. Various technologies have been developed to deduce and quantify the transcriptome including hybridization and sequencing-based approaches. Recently, high density exon microarrays have been successfully employed for detecting differentially expressed genes and alternative splicing events for biomarker discovery and disease diagnostics. The field of transcriptomics is currently being revolutionized by high throughput DNA sequencing methodologies to map, characterize, and quantify the transcriptome.
Methods:In an effort to understand the merits and limitations of each of these tools, we undertook a study of the transcriptome in sickle cell disease, a monogenic disease comparing the Affymetrix Human Exon 1.0 ST microarray (Exon array) and Illumina’s deep sequencing technology (RNA-seq) on whole blood clinical specimens.
Results:Analysis indicated a strong concordance (R = 0.64) between Exon array and RNA-seq data at both gene level and exon level transcript expression. The magnitude of differential expression was found to be generally higher in RNA-seq than in the Exon microarrays. We also demonstrate for the first time the ability of RNA-seq technology to discover novel transcript variants and differential expression in previously unannotated genomic regions in sickle cell disease. In addition to detecting expression level changes, RNA-seq technology was also able to identify sequence variation in the expressed transcripts.
Conclusions:Our findings suggest that microarrays remain useful and accurate for transcriptomic analysis of clinical samples with low input requirements, while RNA-seq technology complements and extends microarray
measurements for novel discoveries.
Keywords:Sickle cell disease, RNA-Seq, Exon arrays, Transcriptome, Clinical genomics
* Correspondence:[email protected]
1Genomics Core Facility, Genetics and Development Biology, NHLBI, The
National Institutes of Health, 10 Center Drive, Bldg 10, 8C 103B, Bethesda 20892, USA
Full list of author information is available at the end of the article
Background
With the completion of the human genome project, the monitoring of changes in the entire human transcrip-tome is an increasingly attractive method for dissecting the molecular basis of disease processes [1,2]. In this re-gard, the ability to utilize a patient’s transcriptome to de-tect the onset of disease, monitor its progression, and even to suggest treatment modalities with the highest probability of success would greatly enhance the quality of medical care and treatment [3-6]. Peripheral whole blood is a nucleic acid-rich and inflammatory cell-rich information reservoir. Analytical methodologies to de-tect transcriptomic changes in these cells may reveal novel biomarkers for disease diagnosis and treatment.
Until recently, high throughput microarray technolo-gies have been the method of choice in clinical studies with limited amounts of RNA from blood samples, biopsy specimens, or enriched cell populations, to obtain gene expression profiles. The high density Affymetrix Human Exon 1.0 ST array (Exon array) with 1.2 million probesets targeting every known and predicted exon in the entire genome has been successfully employed in clinical investigations for obtaining gene expression pro-files and associated alternative splicing events in disease processes [7-9]. Despite these successes, inherent limita-tions in the dynamic range of arrays and the lack of complete coverage for detecting alternative splicing events have constrained the application of this technology.
With the advent of next-generation sequencing tech-nologies, RNA-seq has emerged as a powerful tool for transcriptome analysis [10-12]. By mapping millions of RNA-seq reads to individual transcripts, estimation of expression levels of individual exons and whole tran-scripts can be performed. It is likely that the microarray-based (analog) gene-expression profiling technology will be replaced by digital sequencing based gene-expression profiling (RNA-seq) [8,13,14]. The purported advantages of RNA-seq include generation of expression data for in-dividual annotated genes with nearly unlimited dynamic range; ability to comprehensively detect novel transcripts and mRNA variants resulting from alternative promoter usages, splicing, polyadenylation and sequence variation; and lowered background. However, the technology also brings with it new issues such as the requirement for large amounts of starting material, cumbersome library preparation; novel systematic biases during sample prep-aration and sequencing that must be accounted for when analyzing the data. Additionally, data processing of mul-tireads and splice junctions have been problematic when mapping the sequences back to a genome.
Considering the merits and limitations of each of the technologies, we undertook the current study using complex whole blood specimens from patients with
sickle cell disease (SCD) and matched healthy controls to address the following major questions:
(1). How do the technologies compare with regard to sensitivity, specificity, and variability of gene expression data? (2). Do the differentially expressed transcripts and alternatively spliced exons in SCD correlate well be-tween RNA-seq and Exon arrays? (3). Does the abun-dant expression of globin transcripts in SCD interfere with RNA-seq analysis? (4). Are we able to discover novel differentially expressed transcripts in SCD using RNA-seq? (5). Can we detect sequence variants in the expressed transcripts?
Although previous comparative studies [15,16] have reported the advantages of RNA-Seq and microarrays, to our knowledge, our study is the first to use a human monogenic disease model to compare RNA-Seq and microarrays. We report here our observations on the SCD transcriptome from RNA-seq and Exon arrays with the belief that our findings will be useful to clinical investigators in choosing the appropriate genomic tech-nique for understanding molecular mechanism of dis-eases for diagnosis and the development of novel therapeutics.
Methods
Subjects
The study was approved by the National Institute of Diabetes and Digestive and Kidney Diseases institutional review board (NIH protocol 03-CC-0015) and written informed consents were obtained from study partici-pants. Patients selected for this study included patients (n = 6) with sickle cell disease of mean age 41.6 ± 10.1 and the control group (n = 4) of self-identified African American subjects of mean age 42.2 ± 8.9, without sickle cell disease. The biosamples were collected in steady state condition and none of the individuals was receiving anti-platelet medication.
Isolation of RNA from whole blood specimens
manufacturer's protocol with on-column DNase diges-tion. Quality of the purified RNA from was verified on an AgilentW2100 Bioanalyzer (Agilent Technologies, Palo Alto, CA); RNA concentrations were determined using a NanoDropW ND-1000 spectrophotometer (NanoDrop Technologies, Wilmington, DE).
Total RNA from six SCD patients and four healthy controls were used for detailed analysis on RNA-seq and exon array platforms. Data analysis was carried out on 6 SCD and 3 healthy controls after removing a control sample which was identified to be an outlier based on principal component analysis (PCA) of the transformed data from RNA-seq.
Depletion of globin transcripts
Globin mRNA was depleted from a portion of each total RNA sample isolated from PAXgene tubes using the GLOBINclear™-Human kit (Ambion, Austin, TX). In brief 2 μg of total RNA from human whole blood was mixed with a biotinylated Capture Oligo Mix in hybridization buffer. The mixture was incubated for 15 minutes to allow the biotinylated oligonucleotides to hybridize with the globin mRNA species. Streptavidin magnetic beads were then added, to capture the globin mRNA and the magnetic beads were then pulled to the side of the tube with a magnet and the RNA, depleted of the globin mRNA, was transferred to a fresh tube. The RNA was further purified using a rapid magnetic bead-based purification method [17].
Preparation of biotinylated cDNA targets for exon array hybridizations in GCAS
50 ng RNA samples were amplified using the WT-Ovation™ Pico RNA Amplification System (NuGEN, San Carlos, CA) in a 3 step process as recommended by the manufac-turer. All processes were performed in an automated manner using the genechip array station (GCAS). In brief, first strand cDNA was prepared using a unique first strand DNA/RNA chimeric primer mix and reverse transcriptase. In the second step, DNA/RNA Heterodu-plex Double Stranded cDNA was generated which serves as the substrate for SPIA amplification - a linear isothermal DNA amplification process developed by NuGEN. RNase H degrades the RNA in the DNA/RNA heteroduplex at the 5´ end of the first cDNA strand ex-posing part of the unique priming site for the initiation of the next round of cDNA synthesis. The process of SPIA DNA/RNA primer binding, DNA replication, strand displacement and RNA cleavage is repeated, resulting in rapid accumulation of SPIA cDNA. Follow-ing amplification and purification, 3μg of the amplified cDNA were processed with the WT-Ovation Exon Module to produce sense strand ST-cDNA. Following purification and quantitation, 5 μg ST-cDNA was
fragmented and labeled with the FL-Ovation™ cDNA Biotin Module using a proprietary two-step fragmenta-tion and labeling process. The first step is a combined chemical and enzymatic fragmentation process that yields single-stranded cDNA products in the 50 to 100 base range. In the second step, this fragmented product is labeled via enzymatic attachment of a biotin-labeled nucleotide to the 3-hydroxyl end of the fragmented cDNA generated in the first step. Hybridization, wash-ing and laser scannwash-ing of Affymetrix Human Exon 1.0 ST microarrays were performed according to the manu-facturer’s protocol (Affymetrix, Santa Clara, CA). Hybridization was performed at 45 °C overnight, fol-lowed by washing and staining using FS450 fluidics sta-tion. Scanning was carried out using the 7 G GCS3000 scanner.
Microarray data collection and annotation
Exon-level core RMA-sketch intensity values for each of the chips were collected using Affymetrix Expression Console (EC) Software (Affymetrix, Santa Clara, CA). The 284,258 core probesets were annotated using the Affymetrix annotation file from Netaffx (www.netaffx. com, HuEx-1_0-st-v2.na29.hg18.probeset.csv).
Analysis of exon arrays
Gene level intensity values were obtained by taking the average RMA values over probesets for each transcript cluster. A two sample t-test (SCD N1= 6 and control
N2= 3) was computed on 9 samples in order to
deter-mine differential gene expression between SCD and con-trols. Microarray RMA values for each transcript cluster for each of 9 samples were submitted to a Principal Component Analysis in order to detect possible outliers. Alternative splicing analysis was computed using the ExonANOVA available from software developed by two of the authors, J.B and P.J.M (http://affylims.cit.nih.gov/ MSCLtoolbox). The ExonANOVA model fits the follow-ing formula
yijk ¼μþAiþACikþCkþβj ið ÞþEijk
to the data.
In the above formula,yijkis the log 2 expression
absolute interaction effect (maxik|ACik|) is greater than
or equal to 2. A p-AC<= 10^-8 corresponds to less than 1% false discovery rate (FDR) using the method of Benjamini and Hochberg [18].
Library construction for RNA-seq
High quality total RNA at 1.5μg was used for analysis on the Illumina GAII analyzer on six SCD samples and four healthy controls. cDNA library preparation and sequen-cing reactions were carried out using Illumina library prep, clustering and sequencing reagents following the manufacturer's recommendations (http://www.illumina. com). Briefly, mRNAs were purified using poly-T oligo-attached magnetic beads and then fragmented. The first and the second strand cDNAs were synthesized and end repaired. Adaptors were ligated after adenylation at the 3'-ends. After gel purification, cDNA templates were enriched by PCR. cDNA libraries were validated using a High Sensitivity Chip on the Agilent2100 Bioanalyzer™ (Agilent Technologies, Palo Alto, CA). The samples were clustered on a flow cell using the cBOT. After clustering, the samples were loaded on the Illumina GA-II machine. The samples were sequenced using a single lane with 36 cycles. Initial base calling and quality filtering of the Illu-mina GA-II image data were performed using the default parameters of the Illumina GA Pipeline GERALD stage (http://www.illumina.com).
Mapping and analysis of RNA-seq data
The raw data Fastq sequence files obtained from GAII were mapped to the human genome (build HG18) to get genomic addresses using Bowtie/Tophat [19] allowing up to two mismatches. Reads that mapped to more than 10 locations were discarded. We obtained ~15.1 million reads per sample. We mapped reads both to exons of known RefSeq transcripts (human genome build 18) and to Affymetrix probe selection region coordinates. Reads mapped to Refseq exons and to Affymetrix probeset se-lection regions were counted using the CoverageBed method in BedTools [20]. Reads were counted for exons within each RefSeq transcript. In order to compare RNA-seq data fairly to the Exon microarray, we counted reads mapped to each probeset selection region (or probeset) within each exon.
Transcript cluster level reads were counted per probe-set within each transcript cluster. Very low count tran-script clusters (fewer than 6 samples with 6 or more counts) were ignored. This filtered out a total of 7,146 transcript clusters leaving 11,562 for further statistical analysis. In order to normalize the data, transcript clus-ter counts were divided by the median transcript clusclus-ter count for that sample, and logarithm base 10 trans-formed, yielding transtrans-formed, normalized counts. After principal component analysis (PCA) of the transformed
data, one outlier, a control sample was detected and dis-regarded from further analysis leaving 9 samples. A two samplet-test (sickle cell N1= 6, control N2= 3) was used
on the normalized, transformed data to test for differen-tial expression. Alternative splicing analysis was com-puted using the ExonANOVA as with the microarrays data. A conservative and reasonable background limit at 4.5 RMA units was applied for Exon arrays and 1.0 in RPKM units as recommended by Mortazavi et al. [21] was applied for RNA_seq. The RMA level of 4.5 is slightly above the median RMA for detected exons (Affymetrix DABG value p<0.01, Affymetrix’s recom-mendation for a conservative detection of exons).
In order to identify novel transcription events, we counted reads mapping to each 200 base pair region of the genome. Only populated bins (5 or more samples had 6 or more reads) bins were considered further. This filter retained 187,764 bins for analysis. We disregarded bins that fell within annotated RefSeq exons. The remaining 48,462 bins, describe novel, unannotated tran-scription events. To normalize these data, counts were divided by the 90th percentile of counts for that sample and base 10 logarithm transformed. p-values were required to be 0.0005 or less (corresponding to FDR
<0.15), and the fold-change was required to be 2-fold or greater. If differential expression was found, it was classified as a novel transcript.
Real time Q-PCR analysis
Results
Principal component analysis
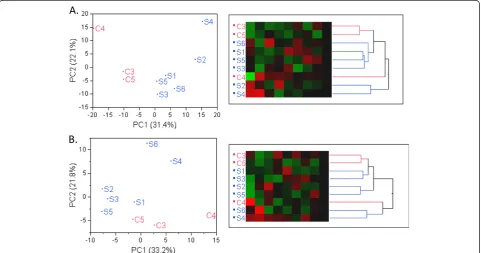
Principal component analysis was first used to identify outliers within the SCD and healthy controls groups. Figure 1A for RNA-seq data showed a clear segregation and clustering of SCD and healthy controls. Similarly with the Exon array analysis on the same set of samples, a clear separation of SCD patients and healthy controls was observed as depicted in Figure 1B. The first princi-pal component (PC1) accounted for 31% of total vari-ability in the RNA-seq data and 33% of total varivari-ability of Exon array data, and also fully separated the sickle cell group from the controls. Sample S6 displayed the largest value for the Affymetrix QC parameter all_probe-sets_rle_mean, a measure of hybridization quality, where larger values indicate lesser quality. This fact may ex-plain the divergence of patterns observed in the two dendrograms
Evaluation of dynamic range, within platform
reproducibility - coefficient of variation and sensitivity
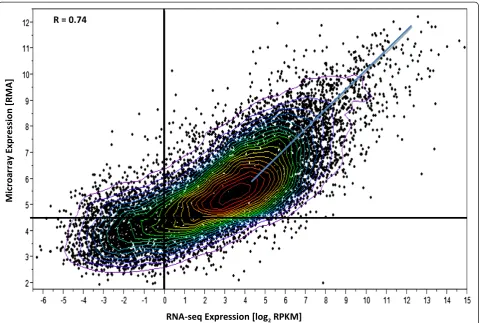
To assess the dynamic range (the ratio of the largest observable value to the background expression level (over all genes) of each platform, a scatter plot (Figure 2) was constructed using the results on control samples for each method. The base 10 logarithm of the RPKM
values from RNA-seq (normalized for gene length) is plotted versus the base 10 logarithm of signal intensity values for Exon array. As can be seen from the figure, RNA-seq shows a larger dynamic range of expression when compared to the Exon array and the magnitude of this increased dynamic range varied from 4 to 16 fold according to the expression levels of differentially expressed genes.
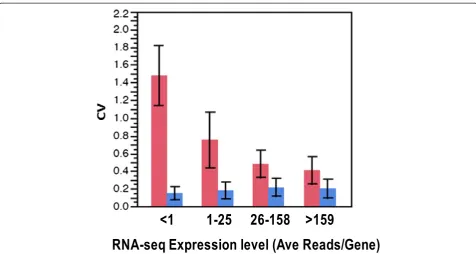
The technical reproducibility and coefficient of variation of the array and RNA-seq platforms at both the gene and exon levels was examined using the mean expression levels over all samples. The pooled coefficient of variation calculated over all samples were broken up into 4 bins (see Figure 3 legend) Figure 3 clearly shows that the coef-ficient of variation for exon array is much lower than that for RNA-seq and is also independent of the number of counts for each transcript suggesting that technical vari-ability within group is higher in the RNA-seq platform than the arrays, especially for genes with low-expression thereby demonstrating the potential advantage of micro-array in cases where the RNA-seq counts are very small. The RNA-seq CV drops to 40% for highly expressed genes while for the exon array the CV rises slightly, to about 20% . This difference is partly a consequence of the extended dynamic range for RNA-seq (or equivalently, the compressed dynamic range observed in microarray).
With the expectation that deeper sequencing and large amounts of starting material are needed to ad-equately cover low abundance transcripts, we tested the sensitivity of each of the platforms by examining the ex-pression of transcripts above background. With the ap-plication of conservative and reasonable background limits at 4.5 RMA units for Exon arrays and 1.0 in RPKM units for RNA_seq to one sample for a control subject C3 (Figure 2), we were able to detect 6% more transcripts (12,310/11,662 = 1.06) above background in exon arrays than in RNA-seq.
Differentially expressed genes in SCD
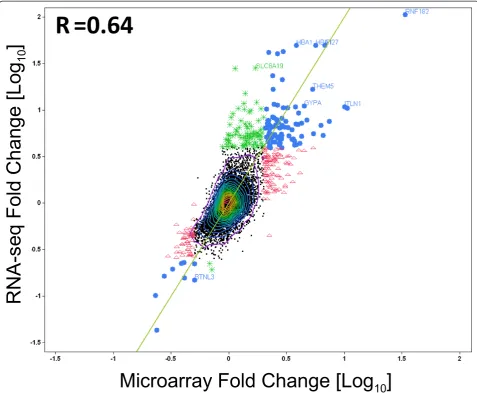
Global gene level expression analysis for each platform is shown in volcano plots (Figure 4). The fold changes from RNA-seq have generally larger magnitude than those from the arrays, with RNA-seq values ranging up to 100 fold, while with microarrays, we observed fold changes up to 31 fold. The relative magnitude of log fold changes can be clearly observed in Figure 4 and Figure 5,
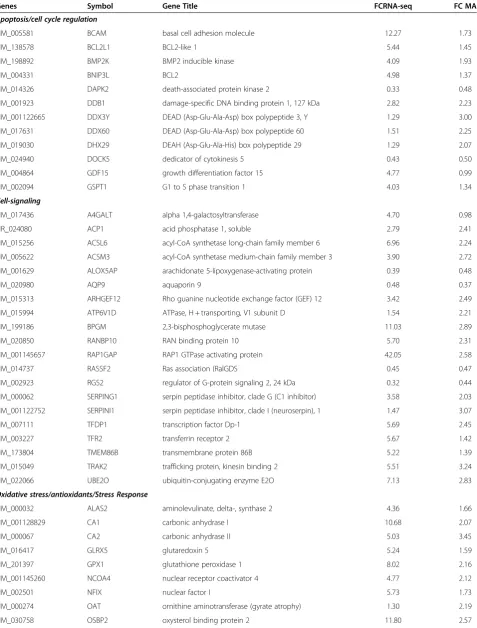
with RNA-seq reporting generally twice the log fold change compared with Exon array. In order to perform an unbiased comparative analysis of the two platforms and knowing that the microarrays have a compressed fold change, we chose two different conservative filters to select differentially expressed transcripts. We selected transcripts using different criteria for each method, spe-cifically, requiring at least a 2-fold change in microarray data or a greater than 4-fold change in RNA-seq data. Altogether, 331 transcripts were found to be differen-tially expressed one or the other method, by these cri-teria. Many of these genes fell into pathways related to SCD including inflammatory response, oxidoreductase pathways, stress response, cell signaling and apoptosis (Table 1).
methods and none of these were among the 96 passing both filters. The cross platform correlation for the differ-ential expression (Figure 5) was substantial (r = 0.64), in-dicating that the two methods give highly similar results overall. With the additional requirement of statistical significance p<0.005 corresponding to FDR <24% for RNA-seq and FDR<35% for Exon array, only 112 tran-scripts showed changes in one or both methods. Of these, 54 showed differential expression only in
RNA-seq, 27 showed differential expression in only Exon array, and 31 showed differential expression in both methods.
Genes identified as differentially expressed in SCD were subjected to gene ontology enrichment analysis to determine their molecular functions. This analysis selected 10 highly significant functional pathways includ-ing cell cycle regulators, apoptosis, oxidative stress re-sponse, inflammation and immune rere-sponse, free radical Figure 3Coefficient of Variation (CV) versus expression level for microarray and RNA-seq.RNA-seq expression level is grouped inot 4 bins according to RNA-seq average number of reads per gene lesser than1, 1–25, 26–158, 159 or higher. CV is calculated as sample standard deviation of expression level within group (SCD and control), pooled and dvidied by mean expression level for RNA-seq (Red). For microarray (Blue), the expression values (RMA units) are first divided by ln (2) = 0.693 to convert them to a natural log scale. Then the CV is calculated as the pooled standard deviation of natural log of the expression levels.
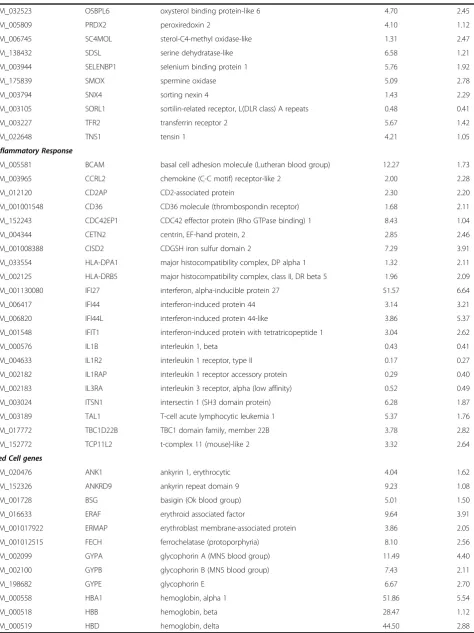
scavenging, protein modification, and hematopoiesis. (Additional file 1: Figure S1). Examination of these path-ways suggests that these differentially regulated genes are consistent with the homeostatic response to known pathobiological stresses in SCD, including oxidative and hemolytic stress, vascular injury, and participation in re-pair. We also observed upregulated expression of several reticulocyte specific genes such as ankyrin1, erythroid associated factor, hemoglobins, nuclear associated factor, glycophorin, transferrin receptor, and selenium binding protein, as expected with prominent reticulocytosis in SCD, thereby validating the performance of the two technologies in identifying biological alterations in the sickle cell disease model.
Effect of globin reduction on RNA-seq data quality
Currently, RNA-seq requires enrichment steps to select Poly A RNA for library construction from total RNA. Since ribosomal RNA represents over 90% of the RNA within a given cell, studies have shown that its removal increases the sensitivity to retrieve data from the remaining portion of the transcriptome. In large clinical studies where whole blood PAXgene RNA is used, there is an additional interference by the high levels of globins in whole blood RNA. This is further complicated in hematologic diseases such as sickle cell where globins account for more than 70% of mRNA.
Table 1 Selected Differentially Expressed Genes Grouped by Pathways of Interest
Genes Symbol Gene Title FCRNA-seq FC MA
Apoptosis/cell cycle regulation
NM_005581 BCAM basal cell adhesion molecule 12.27 1.73
NM_138578 BCL2L1 BCL2-like 1 5.44 1.45
NM_198892 BMP2K BMP2 inducible kinase 4.09 1.93
NM_004331 BNIP3L BCL2 4.98 1.37
NM_014326 DAPK2 death-associated protein kinase 2 0.33 0.48
NM_001923 DDB1 damage-specific DNA binding protein 1, 127 kDa 2.82 2.23
NM_001122665 DDX3Y DEAD (Asp-Glu-Ala-Asp) box polypeptide 3, Y 1.29 3.00
NM_017631 DDX60 DEAD (Asp-Glu-Ala-Asp) box polypeptide 60 1.51 2.25
NM_019030 DHX29 DEAH (Asp-Glu-Ala-His) box polypeptide 29 1.29 2.07
NM_024940 DOCK5 dedicator of cytokinesis 5 0.43 0.50
NM_004864 GDF15 growth differentiation factor 15 4.77 0.99
NM_002094 GSPT1 G1 to S phase transition 1 4.03 1.34
Cell-signaling
NM_017436 A4GALT alpha 1,4-galactosyltransferase 4.70 0.98
NR_024080 ACP1 acid phosphatase 1, soluble 2.79 2.41
NM_015256 ACSL6 acyl-CoA synthetase long-chain family member 6 6.96 2.24
NM_005622 ACSM3 acyl-CoA synthetase medium-chain family member 3 3.90 2.72
NM_001629 ALOX5AP arachidonate 5-lipoxygenase-activating protein 0.39 0.48
NM_020980 AQP9 aquaporin 9 0.48 0.37
NM_015313 ARHGEF12 Rho guanine nucleotide exchange factor (GEF) 12 3.42 2.49
NM_015994 ATP6V1D ATPase, H + transporting, V1 subunit D 1.54 2.21
NM_199186 BPGM 2,3-bisphosphoglycerate mutase 11.03 2.89
NM_020850 RANBP10 RAN binding protein 10 5.70 2.31
NM_001145657 RAP1GAP RAP1 GTPase activating protein 42.05 2.58
NM_014737 RASSF2 Ras association (RalGDS 0.45 0.47
NM_002923 RGS2 regulator of G-protein signaling 2, 24 kDa 0.32 0.44
NM_000062 SERPING1 serpin peptidase inhibitor, clade G (C1 inhibitor) 3.58 2.03
NM_001122752 SERPINI1 serpin peptidase inhibitor, clade I (neuroserpin), 1 1.47 3.07
NM_007111 TFDP1 transcription factor Dp-1 5.69 2.45
NM_003227 TFR2 transferrin receptor 2 5.67 1.42
NM_173804 TMEM86B transmembrane protein 86B 5.22 1.39
NM_015049 TRAK2 trafficking protein, kinesin binding 2 5.51 3.24
NM_022066 UBE2O ubiquitin-conjugating enzyme E2O 7.13 2.83
Oxidative stress/antioxidants/Stress Response
NM_000032 ALAS2 aminolevulinate, delta-, synthase 2 4.36 1.66
NM_001128829 CA1 carbonic anhydrase I 10.68 2.07
NM_000067 CA2 carbonic anhydrase II 5.03 3.45
NM_016417 GLRX5 glutaredoxin 5 5.24 1.59
NM_201397 GPX1 glutathione peroxidase 1 8.02 2.16
NM_001145260 NCOA4 nuclear receptor coactivator 4 4.77 2.12
NM_002501 NFIX nuclear factor I 5.73 1.73
NM_000274 OAT ornithine aminotransferase (gyrate atrophy) 1.30 2.19
Table 1 Selected Differentially Expressed Genes Grouped by Pathways of Interest(Continued)
NM_032523 OSBPL6 oxysterol binding protein-like 6 4.70 2.45
NM_005809 PRDX2 peroxiredoxin 2 4.10 1.12
NM_006745 SC4MOL sterol-C4-methyl oxidase-like 1.31 2.47
NM_138432 SDSL serine dehydratase-like 6.58 1.21
NM_003944 SELENBP1 selenium binding protein 1 5.76 1.92
NM_175839 SMOX spermine oxidase 5.09 2.78
NM_003794 SNX4 sorting nexin 4 1.43 2.29
NM_003105 SORL1 sortilin-related receptor, L(DLR class) A repeats 0.48 0.41
NM_003227 TFR2 transferrin receptor 2 5.67 1.42
NM_022648 TNS1 tensin 1 4.21 1.05
Inflammatory Response
NM_005581 BCAM basal cell adhesion molecule (Lutheran blood group) 12.27 1.73
NM_003965 CCRL2 chemokine (C-C motif) receptor-like 2 2.00 2.28
NM_012120 CD2AP CD2-associated protein 2.30 2.20
NM_001001548 CD36 CD36 molecule (thrombospondin receptor) 1.68 2.11
NM_152243 CDC42EP1 CDC42 effector protein (Rho GTPase binding) 1 8.43 1.04
NM_004344 CETN2 centrin, EF-hand protein, 2 2.85 2.46
NM_001008388 CISD2 CDGSH iron sulfur domain 2 7.29 3.91
NM_033554 HLA-DPA1 major histocompatibility complex, DP alpha 1 1.32 2.11
NM_002125 HLA-DRB5 major histocompatibility complex, class II, DR beta 5 1.96 2.09
NM_001130080 IFI27 interferon, alpha-inducible protein 27 51.57 6.64
NM_006417 IFI44 interferon-induced protein 44 3.14 3.21
NM_006820 IFI44L interferon-induced protein 44-like 3.86 5.37
NM_001548 IFIT1 interferon-induced protein with tetratricopeptide 1 3.04 2.62
NM_000576 IL1B interleukin 1, beta 0.43 0.41
NM_004633 IL1R2 interleukin 1 receptor, type II 0.17 0.27
NM_002182 IL1RAP interleukin 1 receptor accessory protein 0.29 0.40
NM_002183 IL3RA interleukin 3 receptor, alpha (low affinity) 0.52 0.49
NM_003024 ITSN1 intersectin 1 (SH3 domain protein) 6.28 1.87
NM_003189 TAL1 T-cell acute lymphocytic leukemia 1 5.37 1.76
NM_017772 TBC1D22B TBC1 domain family, member 22B 3.78 2.82
NM_152772 TCP11L2 t-complex 11 (mouse)-like 2 3.32 2.64
Red Cell genes
NM_020476 ANK1 ankyrin 1, erythrocytic 4.04 1.62
NM_152326 ANKRD9 ankyrin repeat domain 9 9.23 1.08
NM_001728 BSG basigin (Ok blood group) 5.01 1.50
NM_016633 ERAF erythroid associated factor 9.64 3.91
NM_001017922 ERMAP erythroblast membrane-associated protein 3.86 2.05
NM_001012515 FECH ferrochelatase (protoporphyria) 8.10 2.56
NM_002099 GYPA glycophorin A (MNS blood group) 11.49 4.40
NM_002100 GYPB glycophorin B (MNS blood group) 7.43 2.11
NM_198682 GYPE glycophorin E 6.67 2.70
NM_000558 HBA1 hemoglobin, alpha 1 51.86 5.54
NM_000518 HBB hemoglobin, beta 28.47 1.12
analysis on RNA-seq platform, we reduced the globins on one sickle cell patient sample and compared the glo-bin reduced and non-reduced samples on RNA-seq. Scatter plot analysis of the normalized transcript read counts for these two samples showed a high correlation (R = 0.93, Additional file 2: Figure S2). This suggests that the globin transcripts in the sickle cell sample do not affect the sequence reads and do not introduce much bias in the analysis.
Validation by QPCR analysis
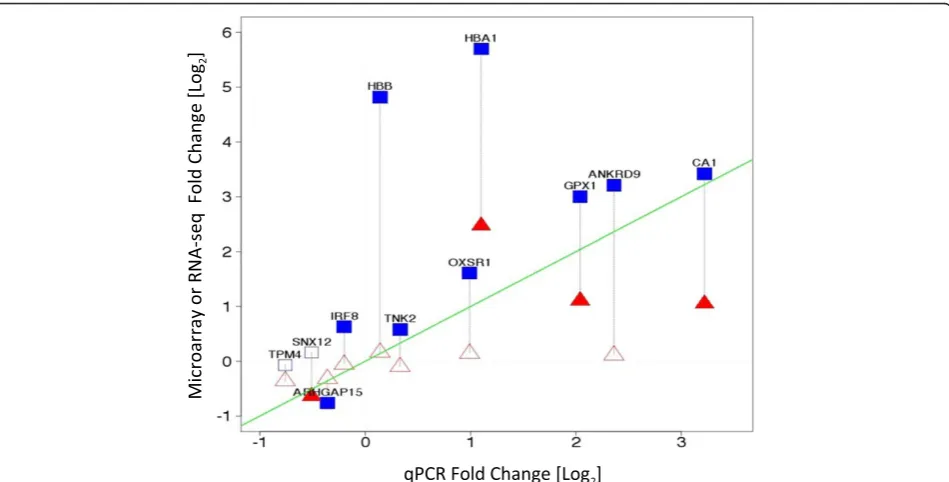
Taqman analysis was used to validate 11 selected differ-entially expressed genes identified by one or both the microarray and RNA-seq platforms. The concordance of each platform with QPCR analysis was measured by Pearson’s correlation on the fold changes. A good degree of correlation was observed for most of the genes across the three platforms (Additional file 3: Table S2). RNA-seq and QPCR showed a correlation R = 0.6; while QPCR and Exon array revealed a correlation of R = 0.58. The line of identity shown in Figure 7 illustrates the
concordance between the platforms. The most highly correlated genes between the platforms are those that lie closest to the line of identity in the figure. Genes IRF8, SNX12, and TPM 4 showed directional discrepancy be-tween microarray and RNA-seq, however QPCR analysis corroborated the microarray data for those genes. Con-versely, QPCR analysis of gene TNK2,which was found to be up-regulated by RNA-seq and down regulated by Exon array, corroborated the RNA-seq analysis.
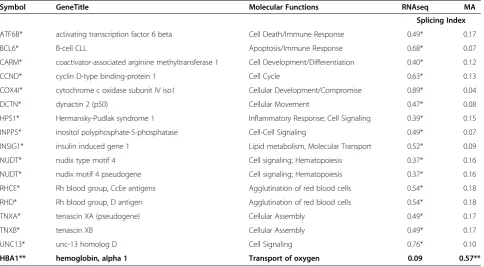
Detection of alternatively spliced exons
Using ExonAnova analysis and filtering criteria as set forth in the Methods section, we were able to identify 16 genes displaying alternative splicing using the RNA-seq platform including ATF6B, BCL6, CARM1, CCNDBP1, COX4I1, DCTN2, HPS1, INPP5D, INSIG1, NUDT,
NUDT4P1, RHCE, RHD, TNXA, TNXB,and UNC13Das
shown in Table 2. Exon array, on the other hand was able to identify onlyHBA1as a significantly alternatively spliced gene while the other genes did not meet the stat-istical filter for splicing.
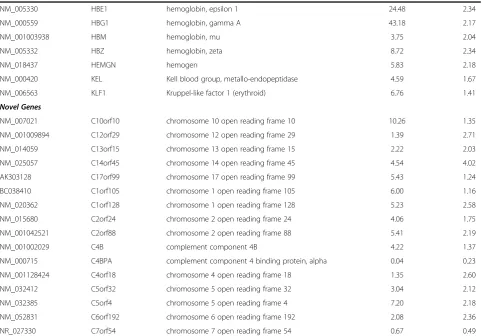
Table 1 Selected Differentially Expressed Genes Grouped by Pathways of Interest(Continued)
NM_005330 HBE1 hemoglobin, epsilon 1 24.48 2.34
NM_000559 HBG1 hemoglobin, gamma A 43.18 2.17
NM_001003938 HBM hemoglobin, mu 3.75 2.04
NM_005332 HBZ hemoglobin, zeta 8.72 2.34
NM_018437 HEMGN hemogen 5.83 2.18
NM_000420 KEL Kell blood group, metallo-endopeptidase 4.59 1.67
NM_006563 KLF1 Kruppel-like factor 1 (erythroid) 6.76 1.41
Novel Genes
NM_007021 C10orf10 chromosome 10 open reading frame 10 10.26 1.35
NM_001009894 C12orf29 chromosome 12 open reading frame 29 1.39 2.71
NM_014059 C13orf15 chromosome 13 open reading frame 15 2.22 2.03
NM_025057 C14orf45 chromosome 14 open reading frame 45 4.54 4.02
AK303128 C17orf99 chromosome 17 open reading frame 99 5.43 1.24
BC038410 C1orf105 chromosome 1 open reading frame 105 6.00 1.16
NM_020362 C1orf128 chromosome 1 open reading frame 128 5.23 2.58
NM_015680 C2orf24 chromosome 2 open reading frame 24 4.06 1.75
NM_001042521 C2orf88 chromosome 2 open reading frame 88 5.41 2.19
NM_001002029 C4B complement component 4B 4.22 1.37
NM_000715 C4BPA complement component 4 binding protein, alpha 0.04 0.23
NM_001128424 C4orf18 chromosome 4 open reading frame 18 1.35 2.60
NM_032412 C5orf32 chromosome 5 open reading frame 32 3.04 2.12
NM_032385 C5orf4 chromosome 5 open reading frame 4 7.20 2.18
NM_052831 C6orf192 chromosome 6 open reading frame 192 2.08 2.36
NR_027330 C7orf54 chromosome 7 open reading frame 54 0.67 0.49
Discovery of novel transcripts to be differentially expressed in SCD
RNA-seq technology is capable of discovering novel transcripts and novel isoforms as it is not constrained to
measure only pre-defined transcripts, as is the micro-array. Instead of mapping reads to known transcripts, we mapped reads to the entire genome, and collected them into 200 base pair bins (see Methods) to identify Figure 6Venn diagram showing the 331 differentially expressed genes between SCD and Healthy Controls for RNA-seq and
microarray.Gene selection Criteria for RNA-Seq -FC greater than or equal to 4; Exon array -FC greater than or equal to 2.
Figure 7Validation by QPCR - Log2 expression fold change (SCD vs. Control) measured by microarray (Red) or RNA-seq (Blue) vs. qPCR on selected genes.Closed symbols represent significant changes, open signals are not significant. The green line is the line of identity. Symbols closer to the line of identity are in better agreement with QPCR.▲Significantly differentially expressed genes by microarray,
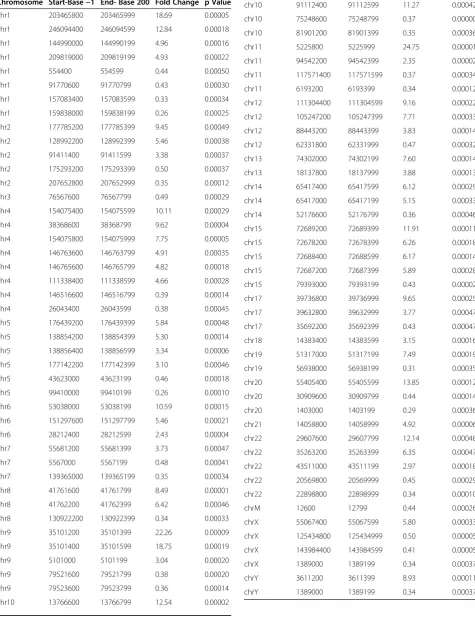
such novel transcripts. We identified 86 novel regions that manifest a significant (p<0.005; 15% FDR), greater than 2-fold change between sickle cell disease and con-trol groups (Table 3).
One novel region was found within the differentially expressed ALAS2 gene. Figure 8A shows the high ex-pression levels detected for each exon of that gene. Based on the known exons, the computed expression change was 4 fold. One 200 bp region (Table 3, chrX:55067400–55067599) falls between exons 4 and 5, and showed a significant (P<0.0003), 6 fold expression change, but with expression levels that are nearly invis-ible in the context of the surrounding exons (Figure 8). Figure 8 and the Additional file 4: Figure S3 (zoomedin exon 4A) show that expression is in fact present in this region for the SCD patients but nearly completely absent in controls. Curiously, expression in this apparently novel region has been previously observed in a single EST derived from T-cells (EST BX367133). It is likely that this represents a rarely used, alternative exon for the ALAS2 gene with greater expression in SCD (6-fold vs 2-fold). Similarly, 200 bp bin analysis showed several differentially expressed regions in chromosomes X, Y, M, 1–12, 19, 20 and 22 and these regions mapped to mito-chondrial genes with some regions representing psuedo-genes. These results are shown in Table 3. Additional file 5: Table S1 shows few examples of the alignment of sequences by BLAST.
Analysis for sequence variation in expressed transcripts
RNA-seq is an attractive method that enables the identi-fication of sequence variations in expressed transcripts. To illustrate the feasibility of identifying sequence vari-ation in expressed genes, we visualized the sequence of reads from the beta globin gene (DNAnexus, https:// dnanexus.com/) for SCD and control subjects in the neighborhood of the known single mutation driving sickle cell disease. In SCD, glutamic acid (coded by CTC) is replaced by Valine (coded by CAC). Figure 9 clearly identifies this mutation in the sickle cell sample as compared to the controls. Interestingly, one of our sickle cell patients (S1) was a compound heterozygous hemoglobin SC patient and the heterozygosity in this pa-tient is clearly seen in Figure 9. This demonstrates the ability of the RNA-seq technology to identify sequence variation in the expressed transcripts that would not be detected in the microarray analysis.
Discussion
Whole transcriptome sequencing (RNA-seq) is a power-ful transcriptional profiling technology using next gener-ation sequencing platforms [4,23-25] and has signaled a new age in clinical genomics. Several recent studies have indicated that RNA-seq will be more useful than the current microarray technology due to the increased dy-namic range of signal of sequencing [4,26-28] and its ability to identify the exact location of transcription
Table 2 Highly Significant Alternatively Spliced Genes
Symbol GeneTitle Molecular Functions RNAseq MA
Splicing Index
ATF6B* activating transcription factor 6 beta Cell Death/Immune Response 0.49* 0.17
BCL6* B-cell CLL Apoptosis/Immune Response 0.68* 0.07
CARM* coactivator-associated arginine methyltransferase 1 Cell Development/Differentiation 0.40* 0.12
CCND* cyclin D-type binding-protein 1 Cell Cycle 0.63* 0.13
COX4I* cytochrome c oxidase subunit IV iso1 Cellular Development/Compromise 0.89* 0.04
DCTN* dynactin 2 (p50) Cellular Movement 0.47* 0.08
HPS1* Hermansky-Pudlak syndrome 1 Inflammatory Response; Cell Signaling 0.39* 0.15
INPP5* inositol polyphosphate-5-phosphatase Cell-Cell Signaling 0.49* 0.07
INSIG1* insulin induced gene 1 Lipid metabolism, Molecular Transport 0.52* 0.09
NUDT* nudix type motif 4 Cell signaling; Hematopoiesis 0.37* 0.16
NUDT* nudix motif 4 pseudogene Cell signaling; Hematopoiesis 0.37* 0.16
RHCE* Rh blood group, CcEe antigens Agglutination of red blood cells 0.54* 0.18
RHD* Rh blood group, D antigen Agglutination of red blood cells 0.54* 0.18
TNXA* tenascin XA (pseudogene) Cellular Assembly 0.49* 0.17
TNXB* tenascin XB Cellular Assembly 0.49* 0.17
UNC13* unc-13 homolog D Cell Signaling 0.76* 0.10
HBA1** hemoglobin, alpha 1 Transport of oxygen 0.09 0.57**
Table 3 Highly Significant Novel Differentially Expressed 200 bp Regions
Chromosome Start-Base−1 End- Base 200 Fold Change p Value
chr1 203465800 203465999 18.69 0.00005
chr1 246094400 246094599 12.84 0.00018
chr1 144990000 144990199 4.96 0.00016
chr1 209819000 209819199 4.93 0.00022
chr1 554400 554599 0.44 0.00050
chr1 91770600 91770799 0.43 0.00030
chr1 157083400 157083599 0.33 0.00034
chr1 159838000 159838199 0.26 0.00025
chr2 177785200 177785399 9.45 0.00049
chr2 128992200 128992399 5.46 0.00038
chr2 91411400 91411599 3.38 0.00037
chr2 175293200 175293399 0.50 0.00037
chr2 207652800 207652999 0.35 0.00012
chr3 76567600 76567799 0.49 0.00029
chr4 154075400 154075599 10.11 0.00029
chr4 38368600 38368799 9.62 0.00004
chr4 154075800 154075999 7.75 0.00005
chr4 146763600 146763799 4.91 0.00035
chr4 146765600 146765799 4.82 0.00018
chr4 111338400 111338599 4.66 0.00028
chr4 146516600 146516799 0.39 0.00014
chr4 26043400 26043599 0.38 0.00045
chr5 176439200 176439399 5.84 0.00048
chr5 138854200 138854399 5.30 0.00014
chr5 138856400 138856599 3.34 0.00006
chr5 177142200 177142399 3.10 0.00046
chr5 43623000 43623199 0.46 0.00018
chr5 99410000 99410199 0.26 0.00010
chr6 53038000 53038199 10.59 0.00015
chr6 151297600 151297799 5.46 0.00021
chr6 28212400 28212599 2.43 0.00004
chr7 55681200 55681399 3.73 0.00047
chr7 5567000 5567199 0.48 0.00041
chr7 139365000 139365199 0.35 0.00034
chr8 41761600 41761799 8.49 0.00001
chr8 41762200 41762399 6.42 0.00046
chr8 130922200 130922399 0.34 0.00033
chr9 35101200 35101399 22.26 0.00009
chr9 35101400 35101599 18.75 0.00019
chr9 5101000 5101199 3.04 0.00020
chr9 79521600 79521799 0.38 0.00020
chr9 79523600 79523799 0.36 0.00014
chr10 13766600 13766799 12.54 0.00002
Table 3 Highly Significant Novel Differentially Expressed
200 bp Regions(Continued)
chr10 91112400 91112599 11.27 0.00042
chr10 75248600 75248799 0.37 0.00000
chr10 81901200 81901399 0.35 0.00036
chr11 5225800 5225999 24.75 0.00001
chr11 94542200 94542399 2.35 0.00002
chr11 117571400 117571599 0.37 0.00034
chr11 6193200 6193399 0.34 0.00012
chr12 111304400 111304599 9.16 0.00022
chr12 105247200 105247399 7.71 0.00033
chr12 88443200 88443399 3.83 0.00014
chr12 62331800 62331999 0.47 0.00032
chr13 74302000 74302199 7.60 0.00014
chr13 18137800 18137999 3.88 0.00013
chr14 65417400 65417599 6.12 0.00029
chr14 65417000 65417199 5.15 0.00033
chr14 52176600 52176799 0.36 0.00046
chr15 72689200 72689399 11.91 0.00011
chr15 72678200 72678399 6.26 0.00018
chr15 72688400 72688599 6.17 0.00014
chr15 72687200 72687399 5.89 0.00028
chr15 79393000 79393199 0.43 0.00002
chr17 39736800 39736999 9.65 0.00025
chr17 39632800 39632999 3.77 0.00047
chr17 35692200 35692399 0.43 0.00047
chr18 14383400 14383599 3.15 0.00016
chr19 51317000 51317199 7.49 0.00019
chr19 56938000 56938199 0.31 0.00035
chr20 55405400 55405599 13.85 0.00012
chr20 30909600 30909799 0.44 0.00014
chr20 1403000 1403199 0.29 0.00036
chr21 14058800 14058999 4.92 0.00006
chr22 29607600 29607799 12.14 0.00048
chr22 35263200 35263399 6.35 0.00047
chr22 43511000 43511199 2.97 0.00018
chr22 20569800 20569999 0.45 0.00029
chr22 22898800 22898999 0.34 0.00010
chrM 12600 12799 0.44 0.00026
chrX 55067400 55067599 5.80 0.00033
chrX 125434800 125434999 0.50 0.00005
chrX 143984400 143984599 0.41 0.00005
chrX 1389000 1389199 0.34 0.00037
chrY 3611200 3611399 8.93 0.00011
boundaries at single base resolution. RNA-seq also pro-vides the sequence information needed to identify single nucleotide variants, map variant transcription start sites, and detect novel transcript splicing. These features make RNA-seq particularly useful for studying complex tran-scriptomes, such as those found in the clinical blood samples.
Although attractive, clinical application of RNA-seq is feasible only if the tool can demonstrate high specificity,
sensitivity and reproducibility with limited amount of starting material. Although current technology for tran-scriptome sequencing requires at least 100 ng total RNA (tens of thousands of cell equivalents), along with add-itional enrichment steps to select for poly(A) + RNA and/or to reduce the content of ribosomal RNA (rRNA) prior to NGS library construction, to minimize the loss of input material researchers tend to start with a mini-mum of 1 microgram total RNA. The utility of RNA-seq
Controls
SCD
1
2
3
6
8
12
11 10 9
7
Controls
SCD
4
5
4
5
Figure 8Coverage Plot of RNA-seq data forALAS2 gene RNA-seq reads forALAS2 gene are shown in genomic context
data generated is believed to be sensitive to read length, mapping and assembly of reads and statistical and com-putational challenges. However, with the current avail-ability of substantially improved mapping software, these challenges are expected to be well tackled. Microarrays, on the other hand, are known to suffer from reduced dy-namic range of signals due to saturation biases and high background, and non-specific or cross-hybridization resulting in false-positive signals, especially for tran-scripts that have low expression levels.
Considering these challenges inherent to each of the high throughput platforms, we undertook this compara-tive study in an attempt to better understand the relacompara-tive merits of high density exon microarrays and RNA-seq for biomarker discovery in the clinical setting. We chose the sickle cell disease because strong differential expres-sion has been previously observed, and the phenotype of the disease is in manifested in blood, an accessible tissue for study. Sampling whole blood, a globin abundant tis-sue, allowed us to examine the potential interference of high abundant globin transcripts during sequencing and also to potentially discover novel genes that are asso-ciated with sickle cell disease from cell types such as nucleated red cells in addition to the conventional per-ipheral blood mononuclear cells. We believe that this is the first study that has compared the 2 platforms on a monogenic human disease model using easily accessible whole blood clinical specimens mimicking a large scale clinical research project.
In this study we used 50 ng of total RNA on exon arrays without any globin reduction or poly(A) + enrich-ment to identify differentially expressed genes and alter-native splicing events in sickle cell disease. The same samples were also analyzed by RNA-seq using 1.5 micro-grams of total RNA. RNA-seq analysis generated an average of 83% mappable reads from the whole blood samples after poly(A) + enrichment. The globin reduc-tion process had insignificant effect on the mappable read count, even for sickle cells samples which have high levels of globin RNA suggetsing that it is not necessary to reduce the globins while analyzing whole blood sam-ples by RNA-seq.
As expected, comparison of the dynamic range of the two platforms confirmed that RNA-seq has a dramatic-ally larger range varying from 4 to 16 fold. This enticing
feature of RNA-seq effectively removes the saturation biases inherent to the array platform. Examination of the technical reproducibility and coefficient of variation of the array and RNA-seq platforms at the gene and exon levels, as a function of the mean expression level, indi-cated that the coefficient of variation for microarray is much lower than that for RNA-seq and is also independ-ent of the expression level for each transcript, suggesting that technical variability within group is higher in the RNA-seq platform than the arrays. A similar observation has been reported by Marioni et al. [15]. They observed extremely high CVs when the read counts were low, a domain where Poisson counting error dominates in RNA-seq. In this domain, microarray produces moder-ately low CV (20%), suggesting that microarray may in fact be more effective at detecting expression changes for low-abundance genes.
Our comparative analysis of detection sensitivity with material from clinical samples revealed that even with the usage of 30 times less starting material (50 ng vs 1.5 micrograms) Exon arrays could detect as many tran-scripts above background as in RNA-seq. It should be noted that the sequencing depth in this study (~10 mil-lion reads) is comparable with most published RNA-seq studies. Xu and others [29] from their comparative study using GG Exon arrays to RNA-seq reported that al-though both platforms detect similar expression changes at the gene level, the Exon array is more sensitive at the exon level and deeper sequencing is required to ad-equately cover low abundance transcripts [29]. It should be mentioned here that with the latest much improved sequencing instruments, it would be easier to generate ~ 80 million reads and this would substantially increase the sensitivity of detection in RNA-seq platform.
We found 331 transcripts with differentially expressed transcripts in SCD. These included genes involved in pathways related to sickle cell disease such as inflamma-tory response, oxidoreductase pathways, stress response, cell signaling and apoptosis. Of these 331 transcripts which showed a high degree of correlation (R = 0.64), 96 genes were identified by both the technologies. A similar observation has also been reported by correlating gene expression arrays and RNA-seq on their study on differ-entially expressed liver and kidney tissues [15]. Only 11 genes out of the 331 genes from the current study (See figure on previous page.)
showed an opposite trend in differential expression in sickle cell disease, suggesting that the number of false positives was small, using either method.
Gene ontology analysis of these genes helped to clas-sify their molecular functions into ten highly significant functional pathway such as cellular cycle regulators, apoptosis, oxidative stress response, inflammation and immune response, free radical scavenging, protein modi-fication, and hematopoiesis. Examination of these path-ways suggests that differentially regulation may be in response to oxidant and hemolytic stress, vascular injury and participation in repair and homeostasis [17,30-34]. Interestingly, GDF15 expression was upregulated, which also has been observed in thalassemia intermedia, and associated with repression of hepcidin, an important me-diator of the inflammatory response on erythropoiesis [35].
We also observed upregulated expression of several re-ticulocyte specific genes as expected in SCD where a higher proportion of reticulocytes are observed. This finding validates the performance of both technologies in identifying alterations relevant to sickle cell disease. From a biological perspective, the whole blood expres-sion profile provided a window into real time erythro-cyte expression profiles. Insights into the transcription profile of these red blood cells may contribute greatly to our understanding of mechanism of disease, prognosis, and responses to therapeutics.
Using ExonAnova analysis on RNA-seq data, we iden-tified 16 alternatively spliced genes. While further valid-ation of these splice variants is needed, it is interesting to note that both RHCE and RHD are components of the important Rh antigen system on red cells. However the potential implications of altered Rh splicing in SCD is still unclear. Deficiency of UNC13D is known to re-sult in defective exocytosis of cytolytic granules of cyto-toxic T lymphocytes and natural killer cells, causing immune dysregulation [36]. Whether altered expression of UNC13D in SCD could contribute to the relative im-mune compromise of SCD may merit future investigation. To illustrate the power of RNA-seq in detecting differ-ential transcription not associated with known genes, we scanned the entire genome for novel differential expres-sion focusing only on unannotated genomic regions. By doing so, we found an interesting region to include an apparently novel, minor exon between exons 4 and 5 in the ALAS2gene with SCD patients showing at least six times higher expression levels compared to the control subjects (p = 0.003). This could suggest alternative spli-cing in SCD which might serve as an ALAS2 transcrip-tion regulator. Follow up of this suggestranscrip-tion would require a functional analysis of this newly identified re-gion of ALAS2 but is beyond the scope of the current study but is planned for the future. ALAS2 gene
expression is restricted to the erythroid lineage [37] and plays a pivotal role in heme synthesis. In addition to heme-mediated feedback inhibition of enzymatic func-tion, ALAS-2, a member of a small family of genes is modulated by iron [38]. This ability of RNA-seq to iden-tify regions in detail holds great promise for the future discovery of novel transcripts and biomarkers in clinical genomic studies.
Another key advantage of RNA-seq over existing tech-nologies for transcriptomic studies is its ability to iden-tify sequence variations in expressed transcripts. To illustrate the feasibility of identifying sequence variation in expressed genes, we focused on the known single nu-cleotide mutation in SCD in which glutamic acid-6 is replaced by valine (GAG replaced by GTG). We were able to successfully detect this mutation in all the sickle cell patients. Interestingly, we were also able to identify, that same mutation in heterozygous combination with a hemoglobin C beta globin variant having glutamic acid replaced by lysine (GAG replaced by AAG) in one com-pound heterozygous sickle cell patient, thereby demon-strating the ability of RNA-seq to reliably identify heterozygous single base mutations in the expressed transcripts.
In conclusion, our study clearly illustrates a high level of concordance between the array platform and the RNA-seq technology, and suggests that the high density Exon array still remains a powerful tool to generate meaningful data when the amount of material is limited. Although RNA-seq is still in the early stages of use in clinical studies, it has clear advantages over the array based transcriptomic methods, based on its ability to discover novel transcripts, identify sequence variants, and increased dynamic range of signals leading to in-crease fold change in measured expression levels. With the rapid evolution of NGS instruments and library preparation methods with multiplexing barcodes, longer read lengths and large number of paired end reads asso-ciated with reduced cost per lane is highly feasible in the near future. The use of picogram to few nanogram amounts to total RNA for RNAseq still needs to be opti-mized in order to capture low abundance transcripts.
associated with the disease in question, followed by high throughput and reliable screening of these elements on thousands of patient samples using the arrays. Integrat-ing data from both microarray and RNA-seq experi-ments may open up new possibilities for creating meaningful informational networks which will aid our understanding of disease pathology and development of novel therapeutics.
Additional files
Additional file 1:Figure S1.Gene Ontology analysis on the
differentially expressed genes. The top 13 highly significant classification/ functions of genes are shown in the figure.
Additional file 2:Figure S2.Effect of Globin Reduction on RNA-seq expression. Y-axis: Read counts per transcript, normalized by median for globin reduced sample; X-axis: Read counts normalized by median for same sample using standard preparation. Correlation coefficient is 0.93.
Additional file 3:Table S2.Validation of few differentially expressed genes by QPCR.
Additional file 4:Figure S3.Putative Exon 4A . UCSC Genome Browser view of the BAM files for each sample showing genomic region chromosome X: 55067500–5506725. The first 3 aligned tracks show the control samples, the following 5 tracks show the sickle cell disease samples. Aligned reads are Red if to the negative strands and blue if to the positive strands. The total reads per sample is: C3: 15,715,705, C4: 15,131,360, C5: 15,730,372, S6: 16,570,843, S1: 13,481,528, S2: 16,707,788, S3: 14,650,161, S4: 18,580,778 and S5: 16,460,443. S6: 16570843, S1.
Additional file 5:Table S1.Complete List of differentially expressed genes (n = 331).
Competing interests
The authors declare that they have no competing interests.
Acknowledgements
We gratefully acknowledge Drs. Kairong Cui and Keji Zhao for their help in library construction and sequencing. We thank Dr. Shurjo Sen NHGRI for his valuable time and advice in analyzing the sequence data. We acknowledge the help of Ms. Marlene Peters-Lawrence for her assistance in collecting these specimens from volunteers and thank the sickle cell and healthy control subjects who participated in this study. This work was funded by the NHLBI Division of Intramural Research (1 ZIA HL006013-03) and by the CIT Division of Computational Bioscience.
Author details
1Genomics Core Facility, Genetics and Development Biology, NHLBI, The
National Institutes of Health, 10 Center Drive, Bldg 10, 8C 103B, Bethesda 20892, USA.2Mathematical and Statistical computing Laboratory, Center for
Information Technology, National Institutes of Health, Bethesda, MD, USA.
3Hematology Branch, National Institutes of Health, Bethesda, MD, USA.4The
National Heart, Lung, and Blood Institute’s Framingham Heart Study, Framingham, MA, USA.5The Center for Population Studies and the Division
of Intramural Research, National Heart, Lung, and Blood Institute, Bethesda, MD, USA.6The Center for Cardiovascular Genomics and the Division of
Intramural Research, National Heart, Lung, and Blood Institute, Bethesda, MD, USA.
Authors’contributions
NR designed the study, wrote the manuscript, NR, PL, KW, performed the experiments. YY helped in mapping the NGS data. JB, PJM performed data analysis and edited the manuscript. GK initiated the NIH protocol for patient recruitment, sample collection and edited the manuscript. DL and CJO funded the study and edited the manuscript. All authors have read and approved the final manuscript.
Received: 23 November 2011 Accepted: 29 June 2012 Published: 29 June 2012
References
1. Melton SD, Genta RM, Souza RF:Biomarkers and molecular diagnosis of gastrointestinal and pancreatic neoplasms.Nat Rev Gastroenterol Hepatol 2010,7(11):620–628.
2. Rudan I:New technologies provide insights into genetic basis of psychiatric disorders and explain their co-morbidity.Psychiatr Danub 2010,22(2):190–192.
3. Weitzel JN, Blazer KR, Macdonald DJ, Culver JO, Offit K:Genetics, genomics, and cancer risk assessment: State of the Art and Future Directions in the Era of Personalized Medicine.CA Cancer J Clin2011,61(5):327–359. 4. Yang X, Jiao R, Yang L, Wu LP, Li YR, Wang J:New-generation high-throughput technologies based 'omics' research strategy in human disease.Yi Chuan2011,33(8):829–846.
5. Offit K:Personalized medicine: new genomics, old lessons.Hum Genet 2011,130(1):3–14.
6. Lam CW, Lau KC, Tong SF:Microarrays for personalized genomic medicine.Adv Clin Chem2011,52:1–18.
7. Abdueva D, Wing MR, Schaub B, Triche TJ:Experimental comparison and evaluation of the Affymetrix exon and U133Plus2 GeneChip arrays.PLoS One2007,2(9):e913.
8. Bradford JR, Hey Y, Yates T, Li Y, Pepper SD, Miller CJ:A comparison of massively parallel nucleotide sequencing with oligonucleotide microarrays for global transcription profiling.BMC Genomics2010,11:282. 9. Liu JM, Camilli A:Discovery of bacterial sRNAs by high-throughput
sequencing.Methods Mol Biol2011,733:63–79.
10. Cirulli ET, Singh A, Shianna KV, Ge D, Smith JP, Maia JM, Heinzen EL, Goedert JJ, Goldstein DB:Screening the human exome: a comparison of whole genome and whole transcriptome sequencing.Genome Biol2010,
11(5):R57.
11. Tang F, Barbacioru C, Nordman E, Li B, Xu N, Bashkirov VI, Lao K, Surani MA:
RNA-Seq analysis to capture the transcriptome landscape of a single cell. Nat Protoc2010,5(3):516–535.
12. Nagalakshmi U, Waern K, Snyder M:RNA-Seq: a method for
comprehensive transcriptome analysis.Curr Protoc Mol Biol2010,Chapter 4:11–13. Unit 4 11.
13. Tariq MA, Kim HJ, Jejelowo O, Pourmand N:Whole-transcriptome RNAseq analysis from minute amount of total RNA.Nucleic Acids Res2011,39(18): e120.
14. Zhao J, Grant SF:Advances in whole genome sequencing technology. Curr Pharm Biotechnol2010,12(2):293–305.
15. Marioni JC, Mason CE, Mane SM, Stephens M, Gilad Y:RNA-seq: an assessment of technical reproducibility and comparison with gene expression arrays.Genome Res2008,18(9):1509–1517.
16. Liu GE:Recent Applications of DNA Sequencing Technologies in Food, Nutrition and Agriculture.Recent Pat Food Nutr Agric2011,3(3):187–195. 17. Raghavachari N, Xu X, Munson PJ, Gladwin MT:Characterization of whole
blood gene expression profiles as a sequel to globin mRNA reduction in patients with sickle cell disease.PLoS One2009,4(8):e6484.
18. Benjamini Y, Hochberg Y:Controlling the False Discovery Rate: A Practical and Powerful Approach to Multiple Testing.Journal of the Royal Statistical Society Series B (Methodological)1995,57(1):289–300.
19. Trapnell C, Pachter L, Salzberg SL:TopHat: discovering splice junctions with RNA-Seq.Bioinformatics2009,25(9):1105–1111.
20. Quinlan AR, Hall IM:BEDTools: a flexible suite of utilities for comparing genomic features.Bioinformatics2010,26(6):841–842.
21. Mortazavi A, Williams BA, McCue K, Schaeffer L, Wold B:Mapping and quantifying mammalian transcriptomes by RNA-Seq.Nat Methods2008,5
(7):621–628.
22. Bieche I, Parfait B, Tozlu S, Lidereau R, Vidaud M:Quantitation of androgen receptor gene expression in sporadic breast tumors by real-time RT-PCR: evidence that MYC is an AR-regulated gene.Carcinogenesis2001,22
(9):1521–1526.
23. Ma Q, Lu AY:Pharmacogenetics, pharmacogenomics, and individualized medicine.Pharmacol Rev2011,63(2):437–459.
24. Mardis ER:A decade's perspective on DNA sequencing technology. Nature2011,470(7333):198–203.
26. Tommasi S, Danza K, Pilato B, De Summa S:Innovative technology for cancer risk analysis.Ann Oncol2011,22(Suppl 1):i37–43.
27. Schweiger MR, Kerick M, Timmermann B, Isau M:The power of NGS technologies to delineate the genome organization in cancer: from mutations to structural variations and epigenetic alterations.Cancer Metastasis Rev2011,30(2):199–210.
28. Settle SH, Sulman EP:Tumor profiling: development of prognostic and predictive factors to guide brain tumor treatment.Curr Oncol Rep2010,
13(1):26–36.
29. Xu W, Seok J, Mindrinos MN, Schweitzer AC, Jiang H, Wilhelmy J, Clark TA, Kapur K, Xing Y, Faham M,et al:Human transcriptome array for high-throughput clinical studies.Proc Natl Acad Sci U S A2011,
108(9):3707–3712.
30. Morris CR:Mechanisms of vasculopathy in sickle cell disease and thalassemia.Hematology Am Soc Hematol Educ Program2008,:177–185. 31. Jison ML, Munson PJ, Barb JJ, Suffredini AF, Talwar S, Logun C, Raghavachari
N, Beigel JH, Shelhamer JH, Danner RL, Gladwin MT:Blood mononuclear cell gene expression profiles characterize the oxidant, hemolytic, and inflammatory stress of sickle cell disease.Blood2004,104(1):270–280. 32. Steinberg MH, Brugnara C:Pathophysiological-based approaches to
treatment of sickle cell disease.Annu Rev Med2003,54:89–112. 33. Raghavachari N, Xu X, Harris A, Villagra J, Logun C, Barb J, Solomon MA,
Suffredini AF, Danner RL, Kato G,et al:Amplified expression profiling of platelet transcriptome reveals changes in arginine metabolic pathways in patients with sickle cell disease.Circulation2007,115(12):1551–1562. 34. Kato GJ, Hebbel RP, Steinberg MH, Gladwin MT:Vasculopathy in sickle cell
disease: Biology, pathophysiology, genetics, translational medicine, and new research directions.Am J Hematol2009,84(9):618–625.
35. Tanno T, Bhanu NV, Oneal PA, Goh SH, Staker P, Lee YT, Moroney JW, Reed CH, Luban NL, Wang RH,et al:High levels of GDF15 in thalassemia suppress expression of the iron regulatory protein hepcidin.Nat Med 2007,13(9):1096–1101.
36. Feldmann J, Callebaut I, Raposo G, Certain S, Bacq D, Dumont C, Lambert N, Ouachee-Chardin M, Chedeville G, Tamary H,et al:Munc13-4 is essential for cytolytic granules fusion and is mutated in a form of familial hemophagocytic lymphohistiocytosis (FHL3).Cell2003,115(4):461–473. 37. Cotter PD, Willard HF, Gorski JL, Bishop DF:Assignment of human
erythroid delta-aminolevulinate synthase (ALAS2) to a distal subregion of band Xp11.21 by PCR analysis of somatic cell hybrids containing X; autosome translocations.Genomics1992,13(1):211–212.
38. Cox TC, Bawden MJ, Martin A, May BK:Human erythroid 5-aminolevulinate synthase: promoter analysis and identification of an iron-responsive element in the mRNA.The EMBO journal1991,10(7):1891–1902.
doi:10.1186/1755-8794-5-28
Cite this article as:Raghavachariet al.:A systematic comparison and
evaluation of high density exon arrays and RNA-seq technology used to unravel the peripheral blood transcriptome of sickle cell disease.BMC Medical Genomics20125:28.
Submit your next manuscript to BioMed Central and take full advantage of:
• Convenient online submission
• Thorough peer review
• No space constraints or color figure charges
• Immediate publication on acceptance
• Inclusion in PubMed, CAS, Scopus and Google Scholar
• Research which is freely available for redistribution