JIEM, 2010 – 3(1): 87-115 – Online ISSN: 2013-0953 Print ISSN: 2013-8423
Towards improving the performance of flexible manufacturing
system: a case study
Ajay Singholi
1, Deepti Chhabra
1, Mohammad Ali
21
Guru Gobind Singh Indraprastha University (INDIA);
2Aligarh Muslim University (INDIA)
Received October 2009
Accepted April 2010
Abstract: Increasing global competition has evolved a manufacturing environment which
gleans vast product variety, reduced manufacturing lead times, increased quality standards
and competitive costs. Simultaneously, with a rising trend toward globalization, these
manufacturing environments must be designed to cater new challenges to survive and grow
in the marketplace. To deal with such multifaceted problems, new technologies support
increased flexibility and automation. These objectives intended for the improvement of the
manufacturing environment have been the key rationales for the introduction of flexible
manufacturing systems (FMSs). In this paper a case study of a firm is presented with a
contribution to suggest some methods of performance improvement for a flexible system
of manufacturing. The study is based on the mathematical models illustrated in literature to
estimate possible performance parameters like maximum production rate, make span time
and overall utilization. Through this study, an effort is also made to present the improved
design for existing flexible manufacturing system employed in the company. Various design
and performance parameters are then evaluated and compared for the existing and
improved FMS.
JIEM, 2010 – 3(1): 87-115 – Online ISSN: 2013-0953 Print ISSN: 2013-8423
1 Introduction
Competitive business environment offers new pressures to be confronted by the manufacturing systems, such as tailored product (increasing variety) with delivery on time along with emphasize conventional requirements of quality and competitive cost. Therefore, to sustain in the global scenario, the focus is to develop a manufacturing system that can fulfil all the demanded requirements within due dates at a reasonable cost. The introduction of Flexible manufacturing System (FMS) facilitates manufacturing industries to improve their performance along with the flexibility to make the customized product with medium volume. A Flexible manufacturing System (FMS) can be defined as a computer-controlled configuration of semi-dependent workstations and material-handling systems designed to efficiently manufacture various part types with low to medium volume. It combines high levels of flexibility with high productivity and low level of work- in-process inventory (Jang & Park, 1996). The exquisiteness of FMS is that it gleaned the ideas both from the flow shop and batch shop manufacturing system and is designed to imitate the flexibility of job shops while maintaining the effectiveness of dedicated production systems. Such FMS should be designed to improve productivity while fulfilling the demand with decreasing makespan time. A generic FMS is able to handle a variety of products in small to medium sized batches simultaneously. The flexibility of a flexible manufacturing system (FMS) has enabled it to become one of the most suitable manufacturing systems in the current manufacturing scenario of customized and varied products with shorter life cycles.
JIEM, 2010 – 3(1): 87-115 – Online ISSN: 2013-0953 Print ISSN: 2013-8423
it is quite reasonable to estimate some performance issues of existing and proposed FMS and subsequently suggest the design decisions. The employment of above mentioned tools and models to judge the FMS performance could be very useful to evaluate the system parameters like production rate, resource utilization, make span time etc. at a beginning stage of design decision making. The company selected for the case was under pressure from the market and was ready with the funds to introduce some major modifications in their existing system to improve the productivity along with the flexibility to survive in the competitive working domain.
This paper presents a study performed for performance evaluation of an existing system with the objective to improve the performance by designing a new FMS. The case company is located in National Capital Region of India and was striving to improve the performance of existing flexible system and setting up to make some investment decisions for up-gradation.
The remainder of this paper is described as following: Section 2 gives an overview of the literature surveyed to conduct the research; subsequently section 3 delineates the problem definition along with the objectives of the case and the data collection. Section 4 includes the design and simulation of new FMS while section 5 analyses and compares the results of the study. In section 6, the paper has been concluded with some issues and future intensions of the research.
2 Literature review
JIEM, 2010 – 3(1): 87-115 – Online ISSN: 2013-0953 Print ISSN: 2013-8423
JIEM, 2010 – 3(1): 87-115 – Online ISSN: 2013-0953 Print ISSN: 2013-8423
‘flexibility’ or more comprehensively an ability to cope with the uncertainty of changes (Correa & Slack, 1996; Barad & Sipper, 1988). An appropriate pre-planning is essential for FMS success to enhance the efficiency, flexibility, and utilization of resources and to decrease setup costs. The prominent literature has several descriptions of FMS and its inherent feature of flexibility has been addressed by many researchers (Browne et al., 1984; Upton, 1994; Wadhwa and Browne, 1989). The flexibility of an FMS is used to enhance versatility of the system and therefore the right type of flexibility is required to be implemented in the system. The case considered for the study is designed for some of the most basic flexibility types such as routing flexibility and volume flexibility. These flexibility types are very much required to make the system more responsive towards the machine failure (routing flexibility) and unexpected increase in demand (volume flexibility).
JIEM, 2010 – 3(1): 87-115 – Online ISSN: 2013-0953 Print ISSN: 2013-8423
the effect of various flexibility types and control rules on the performance of FMS. Simulation modeling has been broadly proposed by the researchers for the analysis of complex systems. It provides a simple platform to model the variables that are complicated to model mathematically or which involves improbable assumptions. Therefore, simulation is suitable for representing a complex system to get a feeling for the real system. It may be especially true for FMSs with a heterogeneous and dynamic environment where on-line control strategies with respect to time are employed (Chan & Chan, 2004). Tunali (1997) developed a simulation model of a job shop type FMS. The model was used to investigate how the performance of scheduling decisions (i.e. mean job flow time) is affected by the use of flexible or prefixed part process plans, in case of a machine breakdown situation. To deal with the operational problems of flexible manufacturing systems such as routing and scheduling, simulation modeling has proved to be practical. Many researchers used simulation to study the scheduling and routing decisions for FMS.
In general, there are two types of problem that need to be addressed in an FMS, namely design problems and operational problems (Kusiak, 1985). The former deals with selection of FMS components while the latter concerns the utilization aspects of FMSs. This paper focuses on both aspects of FMS problems, first the operational study of existing FMS has been performed using mathematical models available in literature, and secondly a new FMS has been designed and simulated to depict the proposed performance improvement plans of the firm. The case considered in this paper requires contribution in terms of introduction of performance improvement strategies to the firm. A simulation model has also been developed to design and estimate the performance measures of new FMS and simultaneously it identifies the machine or load/unload station as bottleneck point in the FMS. The effort is also made to suggest some improvement strategies to the company as a feedback statement which results in higher production rate and better utilization of system resources.
3 Description of case company and problem definition
JIEM, 2010 – 3(1): 87-115 – Online ISSN: 2013-0953 Print ISSN: 2013-8423
from the basic steels, superior alloys to titanium. The company is emerging and has become established among top five quality manufacturers internationally in this range with the certifications like CE, ISO & API 6D. The company’s world class manufacturing base spans over more than 100000 square feet area equipped with modern machining centers, large size material processing and material handling equipment. The company is forward looking and has been investing in to infrastructure and R & D very regularly, thus giving better scope for the study and analysis. The study intends to conduct a performance analysis of the existing flexible system of manufacturing using the modeling technique mentioned above. The analysis leads us to predict the strategies for the improvements in performance parameters of the system.
The study has been done by following a standard research methodology, a questionnaire was designed and circulated among various levels of people in the company and thus the data was formulated. The FMS is involved in manufacturing of four part types, dual plat check valve, concentric butterfly valve, double eccentric butterfly valve and triple eccentric butterfly valve. The FMS has been studied as a standard case of job shop type manufacturing. The design details and production processes along with the times are discussed below:
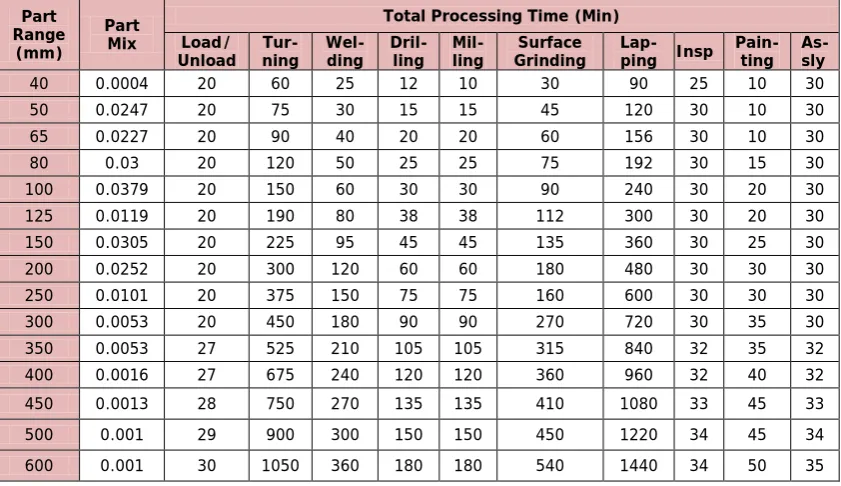
3.1 Dual plate check valve
Part Range
(mm)
Part Mix
Total Processing Time (Min) Load/
Unload Tur-ning Wel-ding Dril-ling ling Mil- Grinding Surface Lap-ping Insp Pain-ting As-sly
40 0.0004 20 60 25 12 10 30 90 25 10 30
50 0.0247 20 75 30 15 15 45 120 30 10 30
65 0.0227 20 90 40 20 20 60 156 30 10 30
80 0.03 20 120 50 25 25 75 192 30 15 30
100 0.0379 20 150 60 30 30 90 240 30 20 30
125 0.0119 20 190 80 38 38 112 300 30 20 30
150 0.0305 20 225 95 45 45 135 360 30 25 30
200 0.0252 20 300 120 60 60 180 480 30 30 30
250 0.0101 20 375 150 75 75 160 600 30 30 30
300 0.0053 20 450 180 90 90 270 720 30 35 30
350 0.0053 27 525 210 105 105 315 840 32 35 32
400 0.0016 27 675 240 120 120 360 960 32 40 32
450 0.0013 28 750 270 135 135 410 1080 33 45 33
500 0.001 29 900 300 150 150 450 1220 34 45 34
600 0.001 30 1050 360 180 180 540 1440 34 50 35
JIEM, 2010 – 3(1): 87-115 – Online ISSN: 2013-0953 Print ISSN: 2013-8423
It is a non-return valve used to reduce water hammer phenomenon in large hydraulic applications (oil and gas sector). Table 1a shows various processes and their times required to manufacture the valve. The sizes manufactured in the FMS are varying from 40mm to 600mm and their part mix ratios are also indicated.
3.2 Concentric butterfly valve
Butterfly valves are designed and manufactured to have optimal mix of structural stability, flow efficiency and effective seating coupled with the advantage of light weight, compact design and ease of operation. These valves offer an ideal as well as economic solution for sea water applications. Table 1b shows various processes and their times required to manufacture the valve. The sizes manufactured are varying from 50mm to 700mm.
Part Range
(mm)
Part Mix
Total Processing Time (Min) Load/
Unload ning Tur- Boring Drilling Matching Rubber Lap-ping Insp Pain-ting As-sly
50 0.2034 20 60 60 180 20 120 20 15 35
80 0.1426 20 100 100 250 22 180 21 20 45
100 0.1108 20 120 120 360 30 240 23 20 60
150 0.213 20 160 160 550 35 360 25 20 60
200 0.0574 20 240 240 720 40 480 27 30 70
250 0.0283 22 300 300 900 45 600 30 35 80
300 0.0119 25 360 360 1080 50 720 35 35 80
400 0.0057 28 420 420 1260 55 840 35 40 80
450 0.0026 30 480 480 1440 60 960 40 45 85
500 0.0027 32 540 540 1620 65 1080 45 50 90
600 0.0029 34 600 600 1800 70 1200 50 55 95
700 0.0016 36 720 720 2160 75 1440 55 60 95
Table 1b. “Concentric Butterfly Valve”. Source: Own contribution
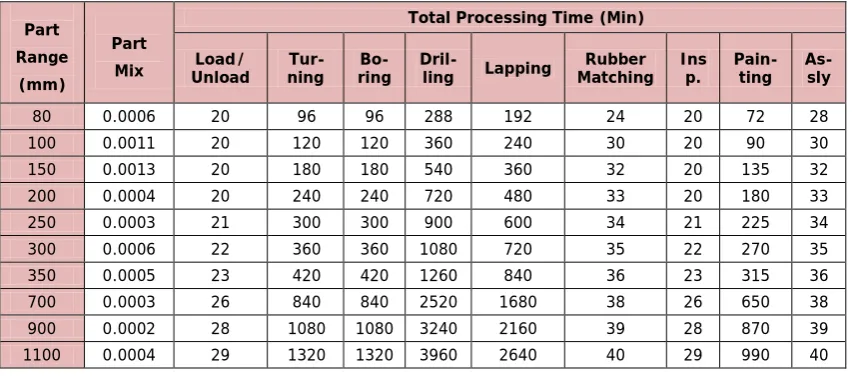
3.3 Double eccentric butterfly valve
JIEM, 2010 – 3(1): 87-115 – Online ISSN: 2013-0953 Print ISSN: 2013-8423
Part Range
(mm)
Part Mix
Total Processing Time (Min) Load/
Unload ning Tur- ring Bo- Dril-ling Lapping Matching Rubber Insp. Pain-ting As-sly
80 0.0006 20 96 96 288 192 24 20 72 28
100 0.0011 20 120 120 360 240 30 20 90 30
150 0.0013 20 180 180 540 360 32 20 135 32
200 0.0004 20 240 240 720 480 33 20 180 33
250 0.0003 21 300 300 900 600 34 21 225 34
300 0.0006 22 360 360 1080 720 35 22 270 35
350 0.0005 23 420 420 1260 840 36 23 315 36
700 0.0003 26 840 840 2520 1680 38 26 650 38
900 0.0002 28 1080 1080 3240 2160 39 28 870 39
1100 0.0004 29 1320 1320 3960 2640 40 29 990 40
Table 1c. “Double Eccentric Butterfly Valve”. Source: Own contribution
3.4 Triple eccentric butterfly valve
It is also used in similar applications and specifically suitable for larger installations with the general size varying from 100mm to 1000mm. Other details are illustrated in table 1d.
Part Range (mm)
Part Mix
Total Processing Time (Min) Load/
Unload Tur-ning ring Bo- Dril-ling Lap-ping Matching Rubber Insp Pain-ting As-sly
100 0.0086 20 120 120 360 240 30 20 90 30
150 0.0018 21 180 180 540 360 31 21 135 31
200 0.0013 22 240 240 720 480 32 22 180 32
250 0.0005 23 300 300 900 600 33 23 225 33
300 0.0007 24 360 360 1080 720 34 24 270 34
500 0.0005 25 600 600 1800 1200 35 25 450 35
600 0.0009 26 720 720 2160 1440 36 26 540 36
800 0.0002 28 960 960 2880 1920 38 28 720 38
1000 0.0009 30 1200 1200 3600 2400 40 30 900 40
Table 1d. “Triple Eccentric Butterfly Valve”. Source: Own contribution
4 Performance analysis and modeling of case system
JIEM, 2010 – 3(1): 87-115 – Online ISSN: 2013-0953 Print ISSN: 2013-8423
proposed by Solberg (1981) and further modified by Mejabi (1988). These models have been duly verified and validated in the literature to provide primary estimates of operational parameters such as production rate, workstation load etc. Some assumptions have been considered for the implementation of the model to study the case. These are mentioned below:
1. The study is purely deterministic in nature.
2. This study is not intended to evaluate the dynamic parameters such as build-up of queues, etc.
3. This study is presented by assuming that the output of the system has an upper limit it means the system has inbuilt bottleneck.
4. It is assumed that the product mix flowing through the system is fixed. 5. Throughout the study, operation frequency is unity.
The considered research case involves the assessment and analysis of performance of a flexible manufacturing system at operational level under various parameters. Primary step may be to identify the various such parameters that can affect performance of the system. An overview of the mathematical model used in the research is discussed below:
4.1 Operational parameters
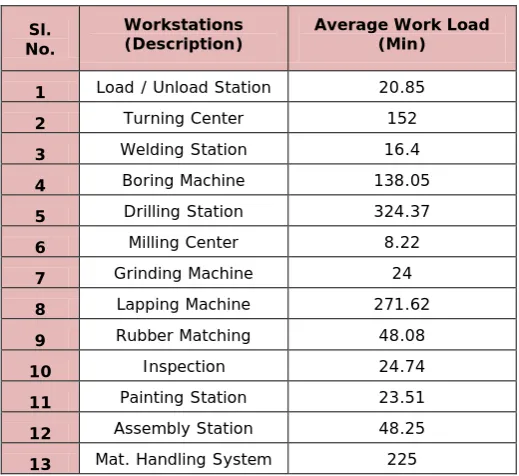
To estimate various performance measures, it is required to first calculate the average workload on each work station of FMS which is defined as the mean total time spent at a machining station per part. It will also help to identify the bottleneck in the system if any.
Average workload
𝑊𝐿
𝑖=
∑ ∑ 𝑡
𝑗 𝑘 𝑖𝑗𝑘𝑓
𝑖𝑗𝑘𝑃
𝑗(1)
Where WLi = average workload for station i (Minutes), tijk = Processing time for
operation k in process plan j at station i (Min), fijk = operation frequency for
operation k in part j at station i, pj = part-mix fraction for part j. The average
JIEM, 2010 – 3(1): 87-115 – Online ISSN: 2013-0953 Print ISSN: 2013-8423
Sl. No.
Workstations
(Description) Average Work Load (Min)
1 Load / Unload Station 20.85
2 Turning Center 152
3 Welding Station 16.4
4 Boring Machine 138.05
5 Drilling Station 324.37
6 Milling Center 8.22
7 Grinding Machine 24
8 Lapping Machine 271.62
9 Rubber Matching 48.08
10 Inspection 24.74
11 Painting Station 23.51
12 Assembly Station 48.25
13 Mat. Handling System 225
Table 2. “Average Workload on Workstations”. Source: Own contribution
The case FMS has a bottleneck station which can easily be found by calculating following ratio (Table 3).
Estimation of bottleneck station
Bottleneck station = Largest workload to no. of server ratio, i.e. 𝑊𝐿𝑖
𝑆𝑖
Workstations
(Description) Average Work Load (Min) Servers No. of Bottleneck? (WLi / Si)
Load / Unload Station 20.85 40 0.521288
Turning Center 152 32 4.757088
Welding Station 16.4 1 16.4013
Boring Machine 138.05 16 8.627814
Drilling Station 324.37 4 81.09159 (Yes)
Milling Center 8.22 2 4.10927
Grinding Machine 24 6 3.997323
Lapping Machine 271.62 16 16.97648
Rubber Matching 48.08 4 12.02082
Inspection 24.74 12 2.061528
Painting Station 23.51 4 5.878682
Assembly Station 48.25 4 12.06337
Mat. Handling System 225 16 14.0625
JIEM, 2010 – 3(1): 87-115 – Online ISSN: 2013-0953 Print ISSN: 2013-8423
4.2 FMS performance measures
Various performance evaluation studies can be found in literature and many of them have used performance measures like makespan time (Wadhwa et. al. 2007), lead time, average flow time, (Chan 2006), machine utilization, system utilization etc. Here popular performance measures have been used i.e. production rate of all parts, production rate of each part type, average utilization of workstations, manufacturing lead time and mean waiting time experienced by a part at the stations.
The maximum production rate (pc per minute) of all parts is limited by the capacity of bottleneck station and therefore can be calculated as the ratio of s* (No. of servers at bottleneck station) to WL* (Workload at Bottleneck Station).
Maximum production rate of all parts
𝑅
𝑝∗=
𝑠 ∗𝑊𝐿∗
(2)
Similarly individual part production rate (of part type j) can be obtained by multiplying R*p by the respective part mix ratios (Pj
𝑅
𝑝𝑗∗=
𝑃
𝑗�𝑅
𝑝∗�
=
𝑃
𝑗 𝑠 ∗𝑊𝐿∗
(3)
).
Implementing the above formula maximum production rate of all parts is found to be O.74026 Pc./hr. for our case.
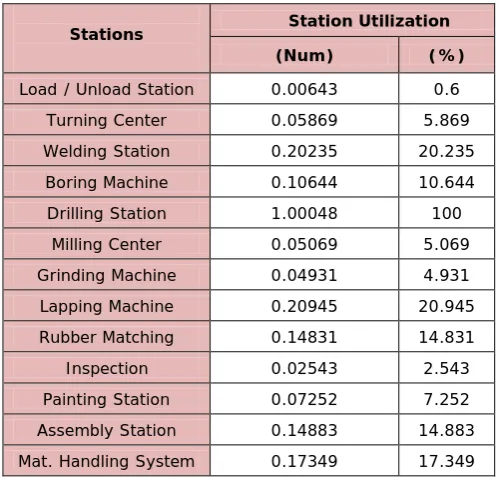
The mean utilization of each workstation is defined as the amount of time that the servers at the station are working and not idle. The utilization of bottleneck station will be 100% at R*
Utilization of each workstation
p. considering the above mentioned notations, mean utilization
Ui
𝑈
𝑖=
𝑊𝐿𝑠𝑖𝑖(𝑅
𝑃∗) =
𝑊𝐿𝑠𝑖𝑖 𝑠 ∗𝑊𝐿∗ (4)
is represented as (Table 4)
Average station utilization (Uav
𝑈
𝑎𝑣=
∑ 𝑈𝑖 𝑛+1 𝑖=1𝑛+1 (5)
JIEM, 2010 – 3(1): 87-115 – Online ISSN: 2013-0953 Print ISSN: 2013-8423
Stations Station Utilization
(Num) (%)
Load / Unload Station 0.00643 0.6
Turning Center 0.05869 5.869
Welding Station 0.20235 20.235
Boring Machine 0.10644 10.644
Drilling Station 1.00048 100
Milling Center 0.05069 5.069
Grinding Machine 0.04931 4.931
Lapping Machine 0.20945 20.945
Rubber Matching 0.14831 14.831
Inspection 0.02543 2.543
Painting Station 0.07252 7.252
Assembly Station 0.14883 14.883
Mat. Handling System 0.17349 17.349
Table 4. Station Utilization. Source: Own contribution.
It is a very useful performance measure and can be calculated using a weighted average, by considering number of servers at each station (n) without using transport system. The overall FMS utilization in the case has been calculated as 88.53%.
Overall FMS utilization
𝑈
𝑂𝑣𝑒𝑟𝑎𝑙𝑙=
∑ 𝑠𝑖𝑈𝑖 𝑛 𝑖=1∑𝑛𝑖=1𝑠𝑖
(6)
Mejabi (1988) considered a closed queuing network with work in process inventory in FMS and discussed the importance of WIP in FMS operation and estimation of manufacturing lead time (MLT). WIP (N) and MLT are correlated; if N is small, then MLT will be lowest due to the least waiting time. If mean waiting time (T
Manufacturing lead time
w
𝑀𝐿𝑇
=
∑
𝑛𝑖=1𝑊𝐿
𝑖+
𝑊𝐿
𝑛+1+
𝑇
𝑤 (7)) and average workloads at stations are known then WIP (N) and MLT can be calculated using following equations.
𝑊𝐼𝑃
= 𝑁
=
𝑅
𝑃(𝑀𝐿𝑇)
(8)JIEM, 2010 – 3(1): 87-115 – Online ISSN: 2013-0953 Print ISSN: 2013-8423
Waiting Time = 295.736 Minutes
4.3 Proposed FMS: sizing and other issues
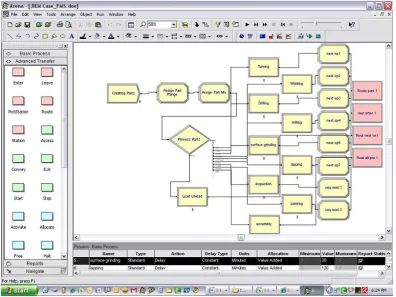
The existing FMS in the company has been extensively analyzed in section 4.1 and 4.2 based on the data collected through questionnaire distributed to all levels. Various operational and performance parameters have been calculated using the mathematical models available in the literature, it is found that existing FMS is not really running efficiently and therefore the performance of existing system is less than the optimum level. The management of company was keen to invest in achieving more productive system and was desirous to see the designs and recommendations suggested by us. We decided to redesign the existing FMS and therefore proper design procedures were followed and based on the inputs received from the management, the sizing of FMS, layout selection etc. have been done using a mathematical models found in the literature. After the calculation of desired operational parameters, it is decided to assess the performance of proposed system by developing the simulation models. Arena is SIMAN based simulation package which uses various inbuilt modules to model any situation in a graphical user interface. Models have been developed and critical performance parameters such as Average Machine Utilization, Production Rate have been determined. The shift size used for the model run is 480 minutes and the production of parts per shift has been observed also the machine utilization has also been noted from the run for various conditions. A snapshot of Arena model window is also given in figure 1. The simulation results have shown the huge increase in the system performance.
Number of servers required at each station to realize a specified production rate can be calculated by the mathematical models suggested by Mejabi (1988) and Solberg (1981). Such estimations are required in the initial stage of FMS design to decide the size (number of stations and servers) of the system. Based on the data provided in table 1a, 1b, 1c and 1d regarding the part mix, process sequence, and process times, the number of servers at each station i can be calculated as
Sizing of proposed FMS
𝑠
𝑖=
𝑚𝑖𝑛𝑖𝑚𝑢𝑚 𝑖𝑛𝑡𝑒𝑔𝑒𝑟
≥
𝑅
𝑃(𝑊𝐿
𝑖)
(9)
JIEM, 2010 – 3(1): 87-115 – Online ISSN: 2013-0953 Print ISSN: 2013-8423
Figure 1. “Arena V.11, Model Snapshot”. Source: Own contribution
Table 5 shows the estimated number of servers required for various stations in the proposed FMS.
Workstations
(Description) No. of Servers (Proposed)
Load / Unload Station 4
Turning Center 29
Welding Station 4
Boring Machine 27
Drilling Station 62
Milling Center 2
Grinding Machine 5
Lapping Machine 10
Rubber Matching 52
Inspection 5
Painting Station 5
Assembly Station 10
Mat. Handling System 43
JIEM, 2010 – 3(1): 87-115 – Online ISSN: 2013-0953 Print ISSN: 2013-8423
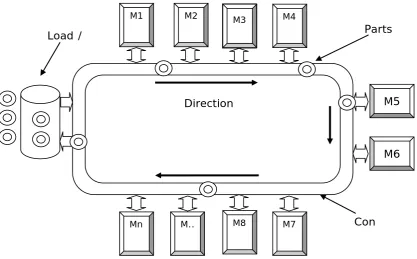
The material handling system generally is a key factor in determining the type of layout to be used in any FMS. In literature, number of popular layout types have been highlighted, some of them are in-line layout, loop layout, ladder layout, open field layout etc. After the detailed study about the plant including space availability, number of operators working etc, the loop layout was considered for the implementation for the new FMS. The key rationales are given below:
Layout and flow diagram of proposed FMS
a. Loop layout is suitable for mid variety and mid volume range of the case company.
b. Loop layout consists of secondary handling system which is required to provide desirable flexibility of routing.
c. It has reduced material transfer time.
d. In the case company, the manpower will be greatly reduced as workers are required only at load/unload station.
e. Traffic control is easy to implement in loop layout.
The layout configuration and flow diagram for loop layout are given in figure 2 and 3 respectively.
Figure 2. “Loop Layout configuration”. Source: Own contribution
M1 M2
M7 M8
M.. Mn
M4
M5
M6
Parts
Con
Direction
Load /
JIEM, 2010 – 3(1): 87-115 – Online ISSN: 2013-0953 Print ISSN: 2013-8423
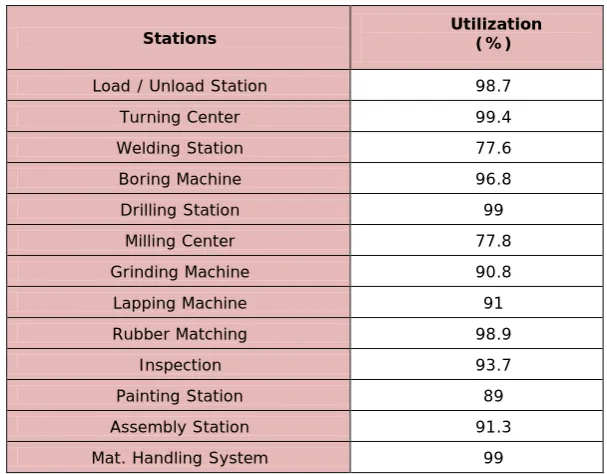
Initial sizing calculations in previous section are helpful for the estimation of performance measures for the proposed FMS. Same mathematical model described in section 4.1 and 4.2 can be exploited to evaluate crucial performance parameters like increased station utilization, maximum production rate, overall system utilization of proposed FMS etc. The increase station utilization and various performance parameters of proposed FMS have been shown in Table 6 and 7 respectively.
Calculation of performance measures of proposed FMS
Stations Utilization (%)
Load / Unload Station 98.7
Turning Center 99.4
Welding Station 77.6
Boring Machine 96.8
Drilling Station 99
Milling Center 77.8
Grinding Machine 90.8
Lapping Machine 91
Rubber Matching 98.9
Inspection 93.7
Painting Station 89
Assembly Station 91.3
Mat. Handling System 99
Table 6. “Increased Station Utilization in proposed FMS”. Source: Own contribution
Sl. No. Performance Parameters Estimated Value
1 Maximum Production Rate (Pc./Hr) 11.4306
2 Most Utilized Station 99.40%
3 New Bottleneck Station Turning Station
4 Overall Utilization of System (%) 99.99%
JIEM, 2010 – 3(1): 87-115 – Online ISSN: 2013-0953 Print ISSN: 2013-8423
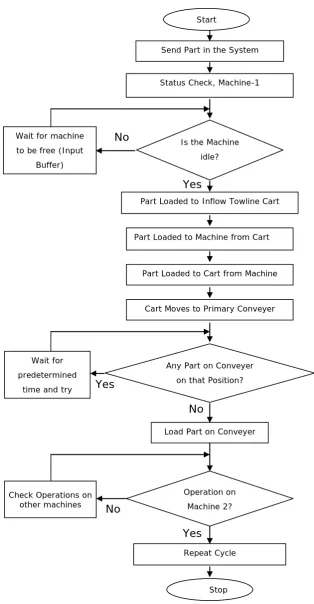
Figure 3. “Flow diagram for Loop Layout”. Source: Own contribution Start
Send Part in the System
Status Check, Machine-1
Wait for machine to be free (Input
Buffer)
Part Loaded to Inflow Towline Cart
Load Part on Conveyer Part Loaded to Machine from Cart
Repeat Cycle
Part Loaded to Cart from Machine
Cart Moves to Primary Conveyer Is the Machine
idle?
Any Part on Conveyer on that Position?
Operation on Machine 2? Wait for
predetermined time and try
Check Operations on other machines
Stop
Yes
Yes
Yes
No
JIEM, 2010 – 3(1): 87-115 – Online ISSN: 2013-0953 Print ISSN: 2013-8423
Simulation modeling is a universal paradigm for analyzing complex systems and often used to develop a simplified representation of a complex system with the objective of providing predictions of the system's performance measures. Number of commercial languages and packages are available for simulation modeling. Hlupic and Paul (1995) critically assessed the WITNESS, Arena, SIMFACTORY, Pro-Model, and XCELL packages. O’Keefe and Haddock (1991) described the various advantages of data driven generic simulators for flexible manufacturing systems. Ali and Wadhwa (2005) developed Arena based simulators to improve the performance of FMS. Previous sections evaluate various parameters pertaining to the proposed FMS using the mathematical models suggested in literature. In view of the complexity of the proposed system it was decided to develop the simulation models for the system so that the behavior and key performance measures can be predicted and verified simultaneously. The use of software package ARENA has been found extensively in the literature for the performance modeling of complex systems; therefore ARENA Version 11.0 professional was used to model the system. The graphical model of the proposed FMS has been prepared and subsequently the behavior of system was recorded for various real life situations. Various performance parameters were also estimated during the simulation run and it is found that the mathematical results are in concurrence with simulation results with the deviation ranging from 4 to 9.3% in various parameters.
Simulation modeling of proposed FMS
5 Results and discussion
JIEM, 2010 – 3(1): 87-115 – Online ISSN: 2013-0953 Print ISSN: 2013-8423
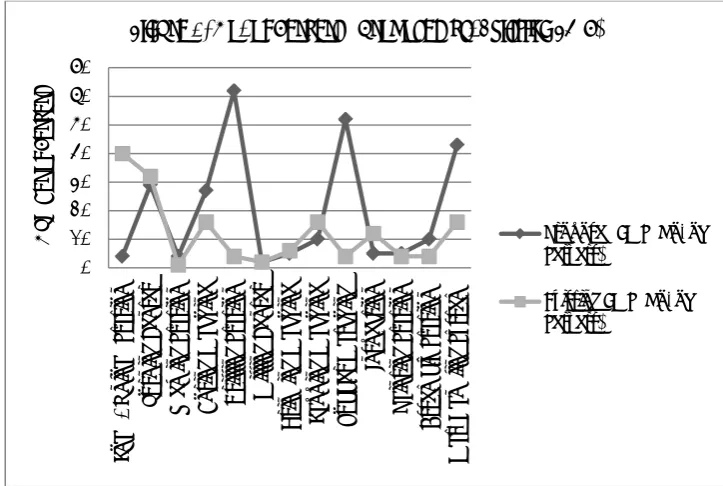
bottleneck to some other convenient station or by neutralizing the effect of bottleneck. This finding has been utilized while designing the proposed system and the bottleneck has been shifted to turning station with the adequate number of servers to cater the workload requirement. Another important performance measure of any FMS is the mean utilization of workstations. For the existing system, the utilizations of stations have been calculated and summarized in table 4 and it observed that few stations are underutilized (like load/unload, inspection, turning) whereas some are highly loaded (100% utilized like drilling), this kind of load distribution was creating a chaos in the system resulting in less overall system performance. This problem was considered as a major barrier in achieving the optimum performance level of the system and therefore has been addressed while the sizing of proposed FMS. The workload requirement has been studied carefully and by the use of mathematical model described in section 4.3, calculations for the optimum number of servers for each workstation have been done and presented in table 5. A comparison of number of servers and station utilizations for the old and proposed system is shown in figure 4 and figure 5 respectively.
Figure 4. “No. of Servers (Proposed vs. Existing)”. Source: Own contribution. 0 10 20 30 40 50 60 70 Load / U nl oad S tat ion Tur ni ng C ent er W el di ng St at io n Bo rin g M ach in e Dr ill in g St at io n M ill in g C en te r Gr in di ng M ach in e La ppi ng M ac hi ne Rubbe r M at chi ng In sp ect io n Pa in tin g St at io n As se m bl y S ta tio n M at . H andl ing S ys te m N umb er o f S erv ers
Figure 4, No. of Servers (Proposed vs. Existing FMS)
Proposed FMS (No. of Servers)
JIEM, 2010 – 3(1): 87-115 – Online ISSN: 2013-0953 Print ISSN: 2013-8423
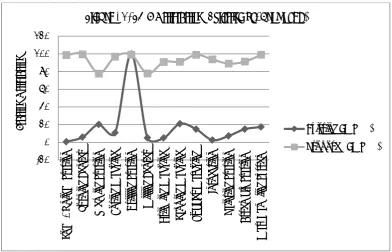
Figure 5. “FMS Utilization (Proposed vs. Existing)”. Source: Own contribution
The study of existing FMS reveals that due to the problems encountered as above, the maximum production rate of all parts was very less. The performance improvement can be seen from the calculations of maximum production rate of all parts for the proposed system and the difference is huge. Similarly other parameters like overall FMS utilization, average production rate etc. have been seen improving for the proposed system. A comparison chart of all these parameters showing the performance improvement (verified with simulation) is presented in table 8.
Sl. No. Performance Parameters Proposed Existing
1 Maximum Production Rate (Pcs./Hr) 11.4306 0.74026
2 Most Utilized Station 99.40% 99.99%
3 New Bottleneck Station Turning Station Drilling Station
4 Overall Utilization of System (%) 99.99% 88.53%
Table 8. “Comparison Chart of Performance Parameters of FMS (Proposed vs. Existing)”. Source: Own contribution.
6 Conclusion
In this paper, a case study of a manufacturing firm is presented on the basis of the mathematical model given by Solberg (1981) and Mejabi (1988). The objective of
-20 0 20 40 60 80 100 120 Load / U nl oad S tat ion Tur ni ng C ent er W el di ng St at io n Bo rin g M ach in e Dr ill in g St at io n M ill in g C en te r Gr in di ng M ach in e La ppi ng M ac hi ne Rubbe r M at chi ng In sp ect io n Pa in tin g St at io n As se m bl y S ta tio n M at . H andl ing S ys te m % S ta tio n U tiliz at io n
Figure - 5, FMS Utilization (Existing vs. Proposed)
JIEM, 2010 – 3(1): 87-115 – Online ISSN: 2013-0953 Print ISSN: 2013-8423
the study was to analyze the existing system and prepare a plan to improve the performance of system. Various techniques like quantitative modeling, simulation modeling have been utilized to achieve the objectives. Initially various operational and performance parameters were calculated then the new FMS has been proposed with the optimum number of servers. It is discovered that the maximum workload per server in the existing system is in drilling station which is also established by the fact that the machine utilization of this station is 99.99%. These results reveal that the drilling station is a bottleneck station. Since this station is crucial for the processing of all part types, It is suggested that the bottleneck should be shifted from this station to some other less important process in the proposed FMS. The system utilization was another important issue which has been addressed in this study, The overall system utilization of existing system was 88.53% and the proposed FMS has been designed to deliver 99.99% overall utilization with appropriate loading on all stations. It is also found that in existing system the resources were not properly utilized as some stations like loading/unloading, inspection, grinding, milling and turning were underutilized ranging from 0.6% to 5.8%, and therefore it was mandatory to adequately distribute the workload on all stations. The proposed FMS has increased the number of servers from 157 to 258 (about 64% increase) which has contributed in the increase of the maximum production rate from 0.740 to 11.43 pc per hour (14 times the existing production) and an increase in overall utilization of resources (88% to 99.99%). This justifies the return on investment as a huge increase in productivity and overall utilization is observed on just 64% rise in no. of servers.
JIEM, 2010 – 3(1): 87-115 – Online ISSN: 2013-0953 Print ISSN: 2013-8423
Appendices
QUESTIONAIRE 1. Product Details
Q1) What types of products are manufactured in the production units?
Q2) What are the different components that go into making the products?
Q3) What is the processing time of all the operations involved in the manufacturing of each product?
Q4) What is the facility provided for material handling and part transport in the units? Is it manual or automated? State clearly the type if it is automated.
Q5) In case the material handling system is entirely manual, then how many workers are involved in the same?
Q6) How is loading/unloading done on the machine, manually or there is automated station provided?
Q7) How many machines are provided in production units for manufacturing each product?
Q8) What is the level of organization in the production plant?
Q9) What is the idle time on various machines employed in the production of the each product?
Q10) What is the lead time in production?
2. Production Facility Design
Q1) What is the total area occupied by inventories?
Q2) Is there any plant layout followed if yes then state the type.
Q3) What is the level of automation in production units?
Q4) Are the production units flexible enough to accommodate changes in?
JIEM, 2010 – 3(1): 87-115 – Online ISSN: 2013-0953 Print ISSN: 2013-8423
3. Financial Parameters
Q1) What is the total projected cost of the new production facility?
Q2) What is the allocated cost of the following?
a)Machines and Equipment
b)Manpower
c) Inventory
d)Electricity
e)Labor training
f) Miscellaneous
Q3) Would you be interested in automating the new facility at additional cost?
o YES
o NO
Q4) Is there any process that you will prioritize for automation, if yes then name the process(s)?
Q5) What is the total cost that the company is ready to bear for implementing flexible manufacturing system (F.M.S.) in the upcoming unit?
LIST OF NOTATIONS
Pj
f
: Part mix fraction for part j
ijk
t
: Operation frequency for operation k in part j at station i
ijk
j: Part
: Processing time for operation k in process plan j at station i
k: Operation i: Station WLi
s
: Average workload for station i in minutes
i
S*: no. servers at bottleneck station : Number of servers
JIEM, 2010 – 3(1): 87-115 – Online ISSN: 2013-0953 Print ISSN: 2013-8423
Uav
MLT: Manufacturing lead time : Overall FMS utilization
WIP: Work in Process Tw
R
: Mean Waiting time
p: Production Rate
Sample calculation of workload for load/ unload station
Part Name Range Part Part Mix (P
j)
Frequency
(fijk)
Load/unload Time
(tijk)
WLi
(Minutes)
Dual Plat Check
Valve
40 0.00038 1 20 0.0076
50 0.0247 1 20 0.494
65 0.02267 1 20 0.4534
80 0.03 1 20 0.6
100 0.03787 1 20 0.7574
125 0.01193 1 20 0.2386
150 0.0305 1 20 0.61
200 0.0252 1 20 0.504
250 0.0101 1 20 0.202
300 0.00528 1 20 0.1056
350 0.00528 1 27 0.14256
400 0.0016 1 27 0.0432
450 0.00128 1 28 0.03584
500 0.00103 1 29 0.02987
600 0.00097 1 30 0.0291
Concentric Butterfly
Valve
50 0.2034 1 20 4.068
80 0.1426 1 20 2.852
100 0.11078 1 20 2.2156
150 0.213 1 20 4.26
200 0.0574 1 20 1.148
250 0.0283 1 22 0.6226
300 0.01186 1 25 0.2965
400 0.00568 1 28 0.15904
450 0.00257 1 30 0.0771
500 0.00274 1 32 0.08768
600 0.00288 1 34 0.09792
JIEM, 2010 – 3(1): 87-115 – Online ISSN: 2013-0953 Print ISSN: 2013-8423
Sample calculation of workload for load/ unload station
Part Name Range Part Part Mix (P
j)
Frequency
(fijk)
Load/unload Time
(tijk)
WLi
(Minutes)
Double Eccentric Butterfly
Valve
80 0.00063 1 20 0.0126
100 0.00113 1 20 0.0226
150 0.0013 1 20 0.026
200 0.00037 1 20 0.0074
250 0.00025 1 21 0.00525
300 0.00056 1 22 0.01232
350 0.00051 1 23 0.01173
700 0.00033 1 26 0.00858
900 0.00024 1 28 0.00672
1100 0.00038 1 29 0.01102
Triple Eccentric Butterfly
Valve
100 0.00857 1 20 0.1714
150 0.00178 1 21 0.03738
200 0.00131 1 22 0.02882
250 0.00054 1 23 0.01242
300 0.00067 1 24 0.01608
500 0.00051 1 25 0.01275
600 0.0009 1 26 0.0234
800 0.000158 1 28 0.004424
1000 0.0009 1 30 0.027
∑WLi 20.8534
References
Ali, M., & Wadhwa, S. (2005). Performance analysis of partial flexible manufacturing systems. Global Journal of Flexible Systems Mgt, 6(1), 9-19.
Barad, M., & Sipper, D. (1988). Flexibility in manufacturing systems: definitions and Petri net modeling. International Journal Production Resesearch, 26, 237– 248.
Browne, J., Dubois, D., Rathmill, K., Sethi, S. P., & Stecke, K. E. (1984). Classification of flexible manufacturing systems. The FMS Magazine, 114.
JIEM, 2010 – 3(1): 87-115 – Online ISSN: 2013-0953 Print ISSN: 2013-8423
Chan, F. T. S. (2003). Effects of dispatching and routing decisions on the performance of a flexible mfg systems. International Journal Manufacturing
Technology, 21, 328-338.
Chan, F. T. S., Bhagwat, R., & Wadhwa, S., (2006). Increase in flex: prod. or counterprod? A study on FMS. International Journal of Production Research, 44(7), 1431–1445.
Chan, F. T. S., Chan, H. K., (2004). Analysis of dynamic control strategies of an FMS under different scenarios. Robotics and Computers International
Manufacturing, 20, 423–437.
Chan, F. T. S., Wadhwa. S., Bibhushan (2007). Inventory performance of some supply chain inventory policies under impulse demands. International Journal of Production Research, Manuscript ID: TPRS-2007-IJPR-0111.
Correa, H. L., & Slack, N. (1996). Framework to analyze flexibility and unplanned change in mfg systems. Computer-Integrated Manufacturing Systems, 9, 57–64.
Hlupic, V., & Paul, R. J. A. (1995). A critical evaluation of four manufacturing simulators. Int Journal of Production Research, 33(10), 2757–2766.
Jang, S. Y., Park, J., & Park, N. (1996). An integrated decision support system for FMS prod planning and scheduling problems. International Journal Advance Manufacturing Technology, 11, 101–110.
Kumar, S., & Sridharan, R. (2007). Simulation modeling and analysis of tool sharing and part scheduling decisions in single-stage multi-machine flexible manufacturing systems. Robotics and Computer-Integrated Manufacturing, 23, 361–370.
JIEM, 2010 – 3(1): 87-115 – Online ISSN: 2013-0953 Print ISSN: 2013-8423
Mac Carthy, L. (1993). A new classification scheme for flexible manufacturing systems. International Journal of Production Research, 31, 299-309.
Mejabi, O. (1988). Modeling in flexible manufacturing systems design. Ph.D. Dissertation, Lehigh University, Bethlehem, Pennsylvania, USA.
Montazeri, M., & Van Wassenhove, L. N. (1990). Analysis of scheduling rules for an FMS. International Journal of Production Research, 28(4), 785–802.
O’Keefe, R. M., & Haddock, J. (1991). Data-driven generic simulators for FMSs. International Journal of Production Research, 29(9), 1795–1810.
Ramasesh, R. V., & Jayakumar, M. D. (1991). Measurement of mfg flexibility: a value based approach. Journal of Operational Management, 10(4), 446-468.
Shnits, B., Rubinovittz, J., & Sinreich, D. (2004). Multi-criteria dynamic scheduling methodology for controlling a FMS. International Journal of Production Research., 42, 3457–3472.
Solberg, J. J. (1981). Capacity planning with a stochastic work flow model. AIIE
Transaction, 13(2), 116-122.
Stecke, K. E., & Solberg, J., J. (1981). Loading and control policies for a flexible manufacturing system. International Journal of Production Research, 19(5), 481– 490.
Tunali, S. (1997). Evaluation of alternate routing policies in scheduling a job-shop type FMS. Comp Ind Eng, 32(2), 243–325.
Upton, D. (1994). The management of manufacturing flexibility. California Management Review, 36(2), 72-89.
JIEM, 2010 – 3(1): 87-115 – Online ISSN: 2013-0953 Print ISSN: 2013-8423
Wadhwa, S., Rao, K. S., & Chan, F. T. S. (2005). Flexibility-enabled lead-time reduction in flexible Sys. International Journal of Production Research, 43(15), 3131-3163.
Weber, D. M., & Moodie, C. L. (1989). An intelligent information system for an automated, Integrated Mfg System. Journal of Manufacturing Systems, 8, 99– 113.
Womack, J. P., Jones, D. T., & Roos, D. (1990). The machine that changed the world. New York: Rawson Associates, 11–15.
©© Journal of Industrial Engineering and Management, 2010
Article's contents are provided on a Attribution-Non Commercial 3.0 Creative commons license. Readers are allowed to copy, distribute and communicate article's contents, provided the author's and Journal of Industrial Engineering and