* Corresponding author
Abstract
Background: Large chemical databases require fast, efficient, and simple ways of looking for similar structures. Although such tasks are now fairly well resolved for graph-based similarity queries, they remain an issue for 3D approaches, particularly for those based on 3D shape overlays. Inspired by a recent technique developed to compare molecular shapes, we designed a hybrid methodology, alignment-recycling, that enables efficient retrieval and alignment of structures with similar 3D shapes.
Results: Using a dataset of more than one million PubChem compounds of limited size (< 28 heavy atoms) and flexibility (< 6 rotatable bonds), we obtained a set of a few thousand diverse structures covering entirely the 3D shape space of the conformers of the dataset. Transformation matrices gathered from the overlays between these diverse structures and the 3D conformer dataset allowed us to drastically (100-fold) reduce the CPU time required for shape overlay. The alignment-recycling heuristic produces results consistent with de novo alignment calculation, with better than 80% hit list overlap on average.
Conclusion: Overlay-based 3D methods are computationally demanding when searching large databases. Alignment-recycling reduces the CPU time to perform shape similarity searches by breaking the alignment problem into three steps: selection of diverse shapes to describe the database shape-space; overlay of the database conformers to the diverse shapes; and non-optimized overlay of query and database conformers using common reference shapes. The precomputation, required by the first two steps, is a significant cost of the method; however, once performed, querying is two orders of magnitude faster. Extensions and variations of this methodology, for example, to handle more flexible and larger small-molecules are discussed.
Background
Databases of chemical structures are a key component of chemical information infrastructures. Searching these databases requires specialized methods, for example, to find similar chemical structures.
There are many ways [1-4] to define "similarity" between chemical structures. Generally, chemical similarity is determined by comparison of "fingerprints" using the Tanimoto equation (Eq. 1). The fingerprints are often binary bit strings with each set bit, or pattern of set bits, Published: 6 June 2007
Chemistry Central Journal 2007, 1:12 doi:10.1186/1752-153X-1-12
Received: 4 April 2007 Accepted: 6 June 2007
This article is available from: http://journal.chemistrycentral.com/content/1/1/12
© 2007 Fontaine et al
representing the presence of a particular topological frag-ment in a molecule.
where AB is the count of common set bits and A and B are the count of set bits Similarity measures of this type make it possible to perform searches of chemical databases, containing millions of compounds, in a matter of sec-onds. While fast, these "2D similarity" methods tend to prefer compounds of similar structural class or topology as the query; however, "3D similarity" methods use geo-metric constraints and are valued for their ability to find compounds belonging to diverse chemical families [5] (Figure 1).
The computational cost of 3D methods, however, is dra-matically greater than 2D methods, due to the relative complexity of generating, selecting, and comparing vari-ous 3D representations of chemical structures. The cost is particularly severe when the comparisons are done by structural overlay, when considering the additional step of determining an optimal 3D overlay. As such, some groups have focused, for example, on extending 2D methods for the discovery of topologically non-obvious similar com-pounds using reduced-graph approaches [6-8]. With the increase of available computer power, fast 3D structural overlay software, such as ROCS [9], has become attractive for large database screening.
ROCS performs rapid overlays of 3D chemical structures using atom-centered Gaussians to compute geometric overlap [10]. Similarity is measured with the shape Tani-moto equation (Eq. 2); unlike 2D, an estimate of molec-ular volume overlap is used, instead of bit counts.
where OAB is the volume overlap between conformer A and conformer B, OA is conformer A volume, and OB is
conformer B volume
Several published applications of ROCS demonstrate its usefulness in practical medicinal chemistry projects [11-13]. ROCS can screen the dataset used in this work at the rate of ~1 800 conformers per second per (64-bit 3-GHz Intel dual core Xeon) processor. Although this is a remark-able speed for this kind of software, it can still take hours to perform a single search of a moderately sized 3D data-base containing millions of conformers.
Innovative overlay-based approaches [14,15] have been created to avoid brute-force comparison between a query
conformer and each and every conformer in a 3D data-base. One approach [15] involves finding a small "dic-tionary" of 3D structures that represent the overall diversity of possible 3D shapes. These diverse shapes are then used to create a binary "3D fingerprint" for each con-former in a database, with each set bit corresponding to a computed similarity above a predefined threshold between the diverse shape and the database conformer. This technique shifts the substantial 3D computational overhead into the initial selection of diverse shapes and the generation of the 3D fingerprint for all conformers in the database. For each 3D similarity query, the workflow now becomes identical to that of 2D binary fingerprint methods: compute the fingerprint for the query; loop over the database contents; and determine the bits in common for computation of Eq. 1. After a 3D fingerprint is designed and created, such an approach can significantly reduce the time to search moderately sized 3D databases, e.g., by shape similarity, from hours to minutes.
There are two major differences between the results from brute-force ROCS shape overlay comparison and the 3D shape fingerprint [15] similarity method. Firstly, the two methods use very different measures for the Tanimoto val-ues and are not guaranteed to give similar results. Sec-ondly, the 3D shape fingerprint similarity approach does not provide a 3D alignment with the query, thus making the results difficult to analyze or visualize. In this study, we attempt to modify an earlier 3D shape similarity approach [15] to mimic results provided by brute-force ROCS similarity searching, but at a fraction of the compu-tational expense. A novel aspect of our method, which we call "alignment-recycling", comes from recycling the translational and rotational matrices resulting from the shape overlay during the initial selection of diverse shapes.
Results
Subset extraction
At the time of project initiation, the PubChem Com-pound [16] database contained approximately 5.3 mil-lion unique chemicals and mixtures. We focused our attention on a subset of PubChem by targeting only sin-gle-component molecules with size and flexibility below lead-like [17] or drug-like [18] filtering cut-offs. Our strat-egy was to work with a simple but relevant subset that could be incrementally updated with more challenging compounds in future studies.
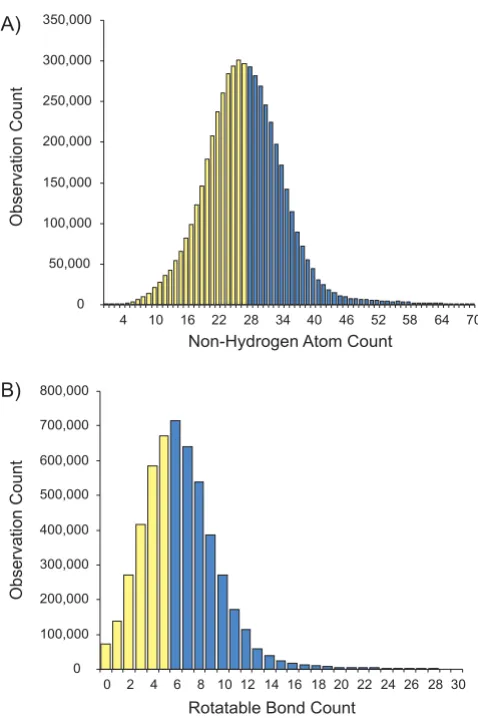
The distributions of non-hydrogen (heavy) atoms and rotatable bonds for PubChem single component struc-tures are presented in Figure 2. For this study, we limited our work to the first half of each distribution, i.e., just those small molecules (less than twenty-eight non-hydro-gen atoms) with low flexibility (less than six rotatable
Tanimoto AB A B AB
=
+ − (1)
shapeTanimoto O O O O
AB
A B AB
=
bonds). Furthermore, we removed all compounds with incomplete stereochemistry (stereo atoms or bonds), to avoid enumerating multiple stereo-configurations. We also removed ionic forms of structures, since their neutral-ized forms will be contained in the PubChem compound dataset. The PubChem compound subset selected is sum-marized in Figure 3. Despite restrictions, the final dataset resulted in approximately one million (1 035 040) unique PubChem compounds representing about 19% of PubChem at the time of dataset extraction. Most of the structures are drug-like organic compounds and, there-fore, are well suited for the MMFF94s force field [19] implemented in the 3D conformer generator OMEGA 1.8.1 and 2.0 Beta [20] used for this study.
Algorithms
The alignment-recycling (AR) methodology is intended to obviate performing the optimization required to maxi-mize the volume overlap of the query conformer to each and every conformer in a 3D conformer dataset. This is achieved by selecting representative conformers to com-pletely cover the "shape space" of the 3D conformer data-set. The granularity of coverage is defined by an empirical cutoff named "Design-Tanimoto" (see section Reference shape selection). Each conformer in the dataset is over-laid to each representative conformer and the overlay information is retained, if the similarity with a represent-ative conformer is of sufficient magnitude.
The empirical criterion to decide if two overlaid conform-ers can be considered similar is named "Transform-Tani-moto" (see section Alignment recycling). Its value greatly influences the number of reference shapes associated with each conformer. By means of analogy to a binary
finger-print, the Transform-Tanimoto threshold defines when a bit is set.
To search the dataset by shape similarity, the query finger-print, to extend the analogy, is compared to the dataset fingerprints to find common reference shapes. The Tanim-oto value computed between query and database finger-prints with AR is not that from Eq. 1, as is typical with 2D fingerprint methods and used by the 3D fingerprint method of Haigh et al. [15]. Instead, finding a common reference shape triggers computing, via Eq. 2, the shape Tanimoto between the query conformer and database conformer, as may be performed by a typical brute-force ROCS approach. In our method, the 3D conformer over-lay used in computing the shape Tanimoto is generated by
Distribution of PubChem single component compounds
Figure 2
Distribution of PubChem single component com-pounds. A) According to number of heavy atoms. B) According to number of rotatable bonds. Yellow bars repre-sent the range of compounds included in the dataset. For a better scaling of the histograms, covalent units above 70 heavy atoms and above 30 rotatable bounds were excluded from the plots.
Examples of output from a shape search using the proton pump inhibitor omeprazole on a subset of PubChem organ-ized by structural class
Figure 1
simply reusing the transformation, i.e., the rotation matrix and translation vector, from the overlay to the common reference shape. This trivial transformation, while specific to alignment of a reference conformer, when applied, can yield a relatively accurate shape overlay between the query and database conformers without the need to perform the conformer overlay alignment optimization. Usually, when the query and a database conformer are fairly simi-lar, multiple reference shapes are found to be in common. In such cases, all reference shape alignments are reused to find a maximum shape Tanimoto between conformers.
Reference shape selection
As described in the Method section, we implemented the clustering algorithm of Haigh et al. [15] to select a diverse set of reference shapes. For this study, we chose a Design-Tanimoto value of 0.75, which, according to their work, represented the best trade-off between sampling speed and granularity. This means, by definition, no pair of ref-erence shapes has a similarity above 0.75, after diversity selection, and that every conformer in the entire dataset is associated with at least one reference shape with a shape Tanimoto similarity above 0.75.
Diverse reference shape selection for the one million com-pound dataset was performed in two stages. In the first stage, only a single conformer representative generated by OMEGA 1.8.1 [20] was used. The single conformer dataset was entirely covered after the inclusion of 2 458 reference shapes. In the second stage, we sampled the conforma-tional space of each compound using OMEGA 2.0 Beta[20] at an RMSD of 1.0 Å. This generated approxi-mately fifteen million (14 925 817) conformers. The dis-tribution of conformers per compound is strongly skewed towards low values, with 50% of the compounds having six or fewer conformers and only 10% of the compounds
accounting for 49% of the total conformer count. Interest-ingly, 99.8% of the fifteen million conformers in the sec-ond stage can be clustered at a Design-Tanimoto of 0.75 using one of the initial 2 458 reference shapes of the single conformer subset, revealing a large amount of shape redundancy in the multi-conformer models. However, the shape space of the remaining 0.2% conformers increases the number of diverse reference shapes from 2 458 to 5 534. This potentially surprising result may be a conse-quence of the sphere-exclusion algorithm variant used for the reference shape selection. In the attempt to cover the entire dataset shape space with a minimum number of ref-erence shapes, the algorithm tends to leave 'holes' in the shape space, thus producing unequally sampled regions. Given the substantial redundancy of conformer shapes in the multi-conformer model dataset, it is very likely that a large fraction of the additional 3 076 reference shapes is necessary to fill these holes. There is no direct indication that the additional reference shapes resulted from any-thing more than sampling deficiency, i.e., were not directly attributable to the size or flexibility of molecules. Use of more efficient sampling algorithms designed to avoid empty spaces, e.g., DISE [21], may lead to more effi-cient shape space coverage than that used in this study.
Because we aim at selecting a diverse set of shapes, the ref-erence conformers appear to represent particular struc-tural features to a greater extent than are present in the entire dataset. For example, only 20% of the PubChem dataset contain chiral centers; however, 33% of the refer-ence shapes contain a chiral center. Similarly, a (non-exhaustive) trend is found between the dataset and refer-ence conformers for triple bonds (8% versus 37%), lack of aromatic atoms (6% versus 21%), and presence of a ring system with more than six atoms (3% versus 28%). As a consequence, reference shapes generated from structures with less common features tend to cluster fewer database conformers than those coming from compounds with more common features.
Alignment-recycling (AR)
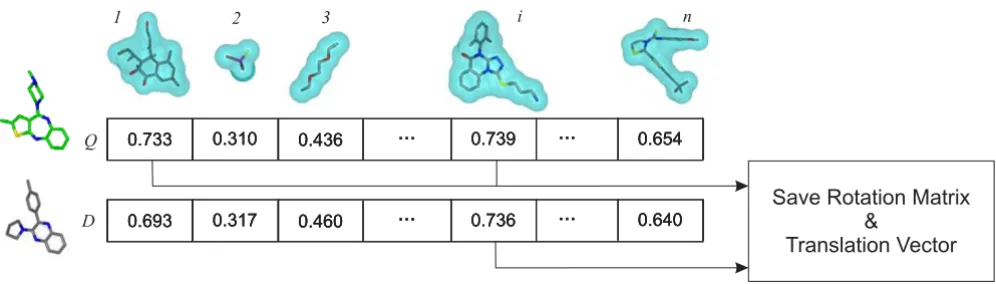
AR takes advantage of information created upon compar-ison of the reference shapes to a conformer during shape fingerprint generation. When a conformer is overlaid on a reference shape, and the computed shape Tanimoto is above the Transform-Tanimoto, the data required to reproduce that alignment are saved (Figure 4). Such infor-mation has the form of a three-by-three rotation matrix and a translation vector. In contrast to ROCS, AR can only occur when the query conformer structure is found to have a reference shape in common with a database con-former. The alignment between the query conformer and database conformer is determined using the retained rota-tional matrices and translarota-tional vectors relative to that reference shape.
Selection of study compound subset from the entire PubChem Compound database
Figure 3
The procedure to align the query conformer, Q, and data-base conformer, D, is the following (as depicted in Figure 5). The three-by-three rotation matrix and the translation vector to overlay the database conformer D on the refer-ence shape R are merged into a single four-by-four affine transformation matrix (MRD). Similarly, one can construct the four-by-four affine transformation matrix MQR by using the transpose of the three-by-three rotational matrix and the minus of the translational vector from the overlay of the query conformer Q on the reference shape R. The matrix MQD is produced by the matrix multiply of MQR with MRD. Conformer D is aligned on conformer Q by
multiplying the coordinate vector of each atom of D with MQD. In some aspects, the method is conceptually similar
to structural alignments performed in 3D-QSAR method-ologies for which all the conformers of the dataset are aligned on the same reference template. In our case, the reference template is a reference shape pre-selected during the initial diverse selection.
Each time an alignment is attempted after transformation matrices combination, the quality of the alignment is evaluated by a single point shape Tanimoto estimation via a Gaussian Grid approximation similar to ROCS, as
Conformer alignment to reference shapes
Figure 4
Conformer alignment to reference shapes. Q is the query conformer. D is the dataset conformer. Reference shapes are numbered from 1 to n. Any alignment with a shape Tanimoto above the Transform-Tanimoto value of, in this case, 0.73 is stored for reuse during database screening.
Alignment recycling
Figure 5
Alignment recycling. Q is the query conformer. D is the dataset conformer. R is the reference shape. MQD is the 4 × 4
detailed in the Methods section. The final number of matrix multiplications and alignments depends on the Transform-Tanimoto value as well as the number of refer-ence shapes in the vicinity of the query conformer.
In practice, a single combination of transformation matri-ces cannot guarantee a result close to an optimal structural alignment. Some conformers may have different optimal alignments with a reference shape due to structural sym-metry; however, the presence of multiple reference shapes greatly increases the chance of finding an alignment very close to the analytical maximum overlap solution. A con-venient property of the method is that similar structures tend to have more reference shapes in common than dis-similar ones, thus far more CPU time is dedicated to the alignment of similar structures than for dissimilar struc-tures.
Finding the right Transform-Tanimoto
Similarity searches often require a threshold as a simple criterion to prune the hit list. The threshold value is some-what subjective although a reasonable range of useful val-ues can be deduced from the literature involving ROCS. Rush et al. [11] mention a general rule-of-thumb that a shape Tanimoto value greater than 0.75 provides visual shape similarity, although they used a 0.85 threshold to select their ZipA-FtsZ protein-protein inhibitors. Accord-ing to a regression plot from Bostrom et al. [22] and our own in-house experience, a RMSD cut-off of 1.0 Å used during conformational sampling with OMEGA 2.0 Beta roughly corresponds to a shape Tanimoto between 0.75 and 0.85. In their virtual screening study, Muchmore et al. [13] found a melanin-concentrating hormone receptor 1 antagonist with nanomolar IC50 at a shape Tanimoto above 0.80. Taking these studies into account, our range of interest in finding similar shapes is limited to ROCS shape Tanimoto between 0.75 and 1.0, alignments with lower similarity values were not considered for this work.
The suitable Transform-Tanimoto value, which deter-mines if two structures have a reference shape in common and enables alignment via matrix multiplication, was determined empirically. For that, we performed a set of random overlays using both ROCS and alignment-recy-cling. Our objective was to keep the Transform-Tanimoto value as high as possible to limit the possible number of matrix combinations and, in doing so, save substantially on CPU time. We started by setting the Transform-Tanim-oto value to the Design-TanimTransform-Tanim-oto value, i.e., 0.75. When applying the AR technique, alignment cases where two conformers do not share a common reference shape are assigned a shape Tanimoto value of zero. Because the ini-tial Transform-Tanimoto threshold was not providing the quantity of hits to be consistent with the brute-force approach, primarily due to not finding appropriate
refer-ence shapes in common, we progressively decreased the Transform-Tanimoto value by 0.01.
The relation between ROCS and alignment-recycling at several Transform-Tanimoto values is plotted on Figure 6. The plots are based on ~1.3 million (1 283 211) align-ments with a ROCS shape Tanimoto in the range 0.75– 1.0. This subset is part of a training set of thirty million random shape-overlays, generated by comparing 2 000 random conformers against 15 000 random conformers from the fifteen million PubChem conformer dataset. The particular nature of the distribution is unveiled by bin-ning the data every 0.01 shape Tanimoto and plotting the isocontour lines at commonly used thresholds for propor-tion estimapropor-tion. The scale on the side of each plot gives an indication of the proportion of the data points between each isocontour. All the data points are contained between the minimum and the maximum of each bin, the other isocontour lines (i.e. first and last percentile, decile, and quartile) highlight the intrinsic distribution of the data among each bin. The plots indicate that there is no hard shape Tanimoto limit between finding and not find-ing a common reference shape between ROCS and AR, but rather some probabilistic distribution. For example, at 0.75 Transform-Tanimoto, 25% of the alignments with a 0.75 ROCS shape Tanimoto do not share an associated AR reference shape. This proportion decreases to less than 10% at a Transform-Tanimoto of 0.74, and less than 1% at 0.73. By means of comparison, an AR reference shape is always found in common for the Transform-Tanimoto values 0.75, 0.74, and 0.73 at ROCS shape Tanimoto val-ues of 0.89, 0.86, and 0.82, respectively. Although we could have further decreased the Transform-Tanimoto to even lower values, in order to further decrease or elimi-nate the chance of not finding an AR reference shape in common, we felt that a Transform-Tanimoto equal to 0.73 produced satisfying results.
ROCS versus alignment-recycling (AR) shape Tanimoto
Figure 6
required by a user depends strongly on the intended use of the alignment, and AR alignments could certainly be used as a very good starting point for subsequent shape overlap optimization, e.g., using ROCS.
The distribution in Figure 7 also indicates that about 1% of the time alignment-recycling performs relevantly better (shape Tanimoto difference > 0.01) than ROCS. One pos-sible explanation for this observation is that ROCS gets locked into a local minimum during overlap optimiza-tion. A more likely explanation is differences in the numerical precision of the ROCS Grid method versus ours (see section Gaussian shape overlay). Overall, the chance of getting a poor AR alignment, as compared to one pro-duced by ROCS, is relatively rare, when using a 0.73 Transform-Tanimoto value and considering the full 0.75– 1.0 shape Tanimoto range.
Comparing speed and hit lists
The test set used here for speed and hit list comparison contained 65 compounds extracted from a dataset of leads and drugs from Oprea et al. [17]. Each test set compound was represented by a single random low-energy con-former. Together, the 65 conformers span a diverse range of shapes derived from simple structures, e.g., salicylic acid, to fairly complex ones, e.g., morphine. The CPU time required to query the fifteen million conformer dataset using the various methods is shown in Table 1. To com-pute ROCS shape overlays for the entire conformer
data-set takes, on average, 2.3 hours, while the time required to perform AR screening at 0.73 Transform-Tanimoto is about 1.3 minutes. This represents more than a 100-fold speedup.
This increase in throughput is not surprising. For each conformer, we are only ever optimizing the overlay to the query for the 5 534 reference shapes. Also, the conformer database reference shape fingerprints are quite sparse, having only 1, 40, or 141 reference shapes set at mini-mum, average, or maximini-mum, respectively. In contrast, ROCS requires optimizing the overlay of the query con-former to all fifteen million database concon-formers. As a means of comparison, CPU times required to search the dataset at Transform-Tanimoto values equal to 0.74 and 0.75 are also shown in Table 1. These timings indicate a two- and four-fold decrease, respectively, directly related to a substantial decline in the number of reference shapes considered during screening. This also suggests that each additional 0.01 decrease in the Transform-Tanimoto will increase the AR method CPU requirement by a factor of two.
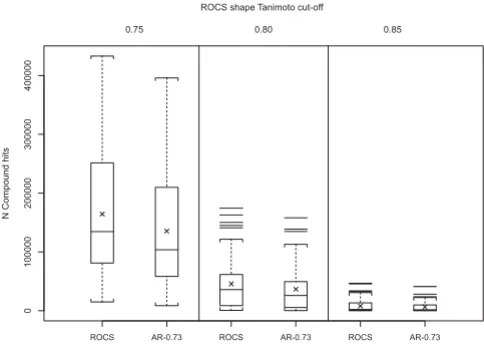
The overlap of AR using a 0.73 Transform-Tanimoto value (AR-0.73) and ROCS hit lists were examined to see if the AR-0.73 method produces results similar to ROCS using the shape Tanimoto similarity thresholds 0.75, 0.80, and 0.85. Figure 9 compares the count of compound hits using both methods. As shown in Table 2, AR-0.73 con-sistently produced ~20% fewer hits than ROCS on aver-age, when using identical shape Tanimoto search thresholds. According to Figure 7, the AR-0.73 shape Tan-imoto is, on average, 0.01 less than that resulting from an optimized alignment using ROCS. This suggests that a fairly small decrease in the AR-0.73 screening shape Tani-moto threshold, relative to that of ROCS, should bring the hit count, with similar alignment quality, into sync. Figure 10a shows how the relative count of hits grows as the AR-0.73 screening threshold is decreased, relative to ROCS. Figure 10a also shows that a similar count of query hits may be obtained at AR-0.73 shape Tanimoto values equal to 0.740, 0.792 and 0.844 for ROCS shape Tanimoto equal to 0.75, 0.80 and 0.85, respectively. Comparable hit counts, however, do not imply commonality of hit lists.
Figure 10b shows the ability of AR-0.73 to reproduce a growing percentage of the ROCS compound hit list as the AR-0.73 screening threshold is decreased, while keeping the ROCS screening threshold constant. As Figure 10c shows, however, that simply decreasing the AR-0.73 screening threshold only improves the union of the two compound hit lists to a point, after which diminishing returns sets in and the hit list overlap becomes worse. This result is expected considering decreasing the AR-0.73 screening threshold results in both ROCS hits missed by
Alignment-recycling (AR-0.73) minus ROCS shape Tanimoto
Figure 7
AR-0.73 and AR-0.73 hits that would be found by ROCS, if the ROCS screening threshold was not kept constant.
In each case, the AR-0.73 shape Tanimoto values 0.740, 0.792 and 0.844, originally highlighted as providing a
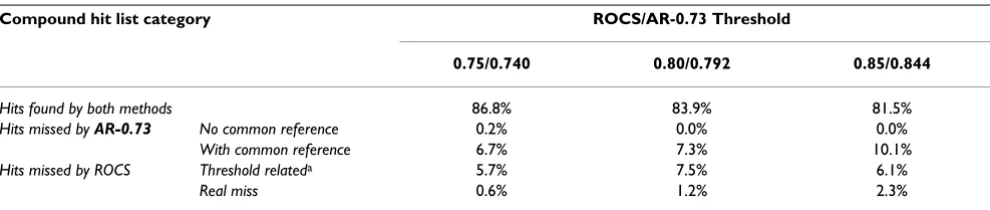
hits found by AR-0.73 but just missed by ROCS, due to finding a suboptimal solution during the maximization of the volume overlap or variation in the grid numeric preci-sion (0.6–2.3%); hits missed by AR-0.73, but found by ROCS, due to the inability to find a reference shape in common (0.0–0.2%); and hits missed by AR-0.73, but found by ROCS, due to suboptimal volume overlap using alignment-recycling only, i.e., without overlap maximiza-tion optimizamaximiza-tion (6.7–10.1%). Regarding this last cate-gory, the AR-0.73 missed hits were only narrowly missed, with the missed hits having average shape Tanimoto val-ues of 0.731, 0.787, and 0.840, just 0.009, 0.005, and 0.004 below the AR-0.73 similarity thresholds of 0.740, 0.792, and 0.844, respectively. This shows that even though the hit list intersection appears to decrease slightly with increasing shape Tanimoto value, the missed hits are increasingly proximate to the shape Tanimoto threshold.
The observed correction for maximum overlap of AR-0.73 and ROCS hit lists as a function of shape Tanimoto appears to be linear. If this relationship holds across the entire range of ROCS shape Tanimoto values of 0.75 to 1.0, one could employ Eq. 3 to select the appropriate AR-0.73 shape Tanimoto cut-off to use for a desired ROCS shape Tanimoto value to achieve maximum overlap of results.
STAR-0.73 = 1.04 * STROCS - 0.04 (3)
Table 1: CPU time to query the fifteen million conformer database with a single conformer
Method CPU Time (min.)
Average Minimum Maximum
ROCS 136 113 216
AR-0.73 (Total)a 1.28 0.33 3.32
AR-0.73 (Screening part) 1.11 0.17 3.13
AR-0.74 (Screening part) 0.65 0.15 1.85
AR-0.75 (Screening part) 0.38 0.11 1.15
Query vs. 5 534 AR Reference Shapes
0.17 0.12 0.27
a Total time includes screening plus the required 5 534 initial alignments between reference shapes and the query.
Impact of lower alignment quality
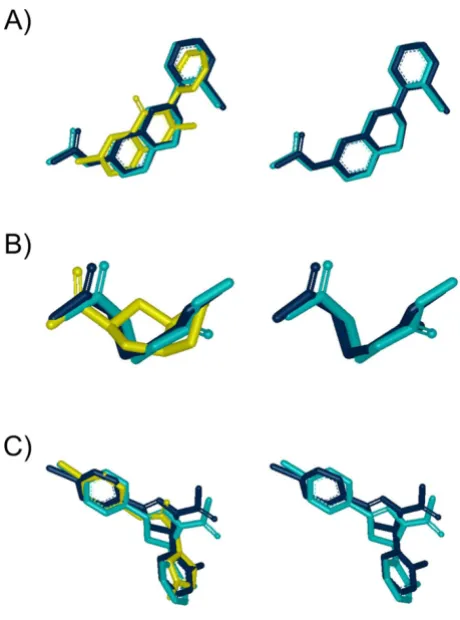
Figure 8
Impact of lower alignment quality. Examples of ROCS versus AR-0.73 alignments from Figure 7. Left side: Query (yellow), ROCS alignment (dark blue) and AR alignment (cyan). Right side: Same as left side but with query
where STAR-0.73 is the suggested optimum AR-0.73 shape Tanimoto value to use for a corresponding shape Tanim-oto value, STROCS, in the range of 0.75 to 1.0.
Discussion
The AR-0.73 method consistently reproduces ROCS results emphasizing that conformers with similar shapes tend to overlay to each other in a similar way. As such, overlay of two conformers, A and B, to a reference con-former, R, may generate an excellent approximation to the ideal alignment of conformers A and B by simply (re)using the alignments AR and BR. After finding a suita-ble set of reference shapes, the CPU cost to search for sim-ilar conformers across datasets of millions can be dramatically reduced. While efficient, the alignment-recy-cling method, AR-0.73, outlined in this work does have its limitations.
AR-0.73, in its current form, cannot be used for sub-shape comparison since global alignments are used. One can, however, readily imagine a subshape-based 3D
finger-print, much like dictionary-based 2D fingerprints. The implementation of such a method is beyond the scope of this work.
If a similar (enough) reference shape is not present when comparing two conformers, poor shape alignments may result, causing hits to be found by ROCS but missed by AR-0.73. If no reference shape is found to be in common, AR-0.73 cannot produce an alignment.
As the molecular size and flexibility increase, the number of required reference shapes is likely to increase dramati-cally to generate accurate shape overlays, which is proba-bly the most important drawback of the AR-0.73 method. Reductions in the Design-Tanimoto can counter large increases in the number of reference shapes; however, in our experience, such a reduction in the Design-Tanimoto threshold, and concomitant reduction of the Transform-Tanimoto, can result in a reduction in the average quality of reproduction of the optimal overlay and an increased computational cost due to the consideration of additional conformers in alignment-recycling portion of the method. The overlay quality can be dramatically improved, in this situation, by slightly altering the methodology provided in this work to perform a post overlay optimization, using the near-optimal alignment-recycling overlay as a starting point for shape overlay optimization, providing substan-tial computational savings in the absence of such infor-mation. This proposed methodology extension may provide the means to apply aspects of the alignment-recy-cling method to larger and more flexible small molecules by eliminating the requirement that the recycled align-ment reproduce the optimal alignalign-ment, thus allowing the Design-Tanimoto and Transform-Tanimoto thresholds to be (substantially) reduced.
Another drawback to AR-0.73 is that the primary compu-tational expense is borne before any shape similarity searches are performed. For the fifteen million conform-ers used in this study, it took about four CPU years to compute the shape fingerprints using 64-bit 3-GHz Intel dual-core Xeon processors. Computational cost of the fin-gerprint generation is essentially recovered, however, after performing the same number of searches as there are ref-erence shapes.
ROCS versus AR-0.73 number of hits
Figure 9
ROCS versus AR-0.73 number of hits. Box plots show-ing the distribution of the number of compounds found at 0.75, 0.80 and 0.85 shape Tanimoto cut-offs. Crosses repre-sent the mean of each distribution. AR-0.73 retrieves fewer compounds than ROCS using the same cut-off.
Table 2: Average compound hit list size resulting from querying the fifteen million conformer database with a single conformer
Method Shape Tanimoto Threshold
0.75 0.80 0.85
ROCS 164 337.3 45 596.5 7 886.8
AR-0.73 135 505.9 36 670.3 6 267.1
ROCS versus AR at lower thresholds
Figure 10
AR-0.73, while substantially reducing the CPU cost of shape similarity searching, adds concomitant demands on storing alignments to the reference shapes that must be available during the search. For the fifteen million con-former dataset, the (non-optimized) storage requirement for the fingerprints and rotational/translational informa-tion is 32 GB. If one is not careful, simultaneous access to this data can be a significant bottleneck.
If the AR-0.73 method is used with a dynamic database of conformers, additional computational costs can be envi-sioned. As new conformers are added, new reference shapes must be added dynamically whenever existing ref-erence shapes cannot represent a new conformer. Addi-tion of a new reference shape will require the precomputation step of comparing all existing database conformers to the new reference shape. After many new reference shapes are added (> 50% more of the initial total), a complete re-sampling of the reference shapes may be warranted to improve overall search performance through a reduction in the number of reference shapes. Also, for efficiency purposes, as conformers are deleted from the database, care must be taken to ignore reference shapes that no longer represent any database conformer to prevent unnecessary comparisons to a redundant refer-ence shape.
With the above caveats in mind, the AR-0.73 method as described should be useful to speed the search of any 3D conformer dataset, regardless of size or flexibility. There should be no need to further modify the Transform-Tani-moto and Design-TaniTransform-Tani-moto values of 0.73 and 0.75, respectively, to provide, e.g., complementary results to a ROCS search in the shape Tanimoto range of 0.75 – 1.0. The diverse reference shapes used in this work (see Addi-tional files1 and 2) should be useful in helping create the initial reference shapes required to implement this method for arbitrary conformer databases. It is also rea-sonable to believe that the spirit of this methodology could be made to work using other shape searching pack-ages besides ROCS.
Alterations to the AR-0.73 parameters, Transform-Tanim-oto and Design-TanimTransform-Tanim-oto, may be made depending on the desired purpose. If one was only interested in use of this methodology as a shape search screen to dramatically reduce the number of conformers considered prior to shape overlay optimization and to provide reasonable starting points for overlay optimization, reduced values of the two parameters could be used, resulting in substan-tially fewer reference shapes and a significant reduction in the pre-computation cost. If one was only interested in reproduction of hit lists with shape Tanimoto values of 0.90 or greater, the Transform-Tanimoto could be increased closer to the Design-Tanimoto values, providing a further speed up in the shape search speed by reducing the number of conformers considered by alignment-recy-cling.
Overall, it appears clear that the AR-0.73 method, while an approximation to the optimal shape overlay, is very capable at routinely producing the vast majority of the ROCS results in a fraction of the CPU time.
Conclusion
One of the main advantages of 3D overlay is that it allows visualization of the superimposed compounds and a bet-ter understanding of their similarity. Unfortunately, at the scale of large databases containing millions or billions of conformers, 3D alignment-based similarity searches are reserved to only entities with substantial computing capa-bilities and modeling resources. Even for such entities, it would be a major breakthrough to get nearly all of the desired alignments in just a couple of minutes using only a single CPU node. The alignment-recycling method described in this work shows promise in dramatically improving the speed of shape similarity searches of large databases through pre-computation of a small subset of shape overlays. Although the pre-computation requires significant computing resources, it is within the reach of modern, yet modest, computer clusters. The pre-com-puted transformation matrices to obtain the alignments with the subset can be effectively recombined to generate Table 3: Comparison between ROCS and AR-0.73 hit lists when using reduced similarity thresholds for AR-0.73
Compound hit list category ROCS/AR-0.73 Threshold
0.75/0.740 0.80/0.792 0.85/0.844
Hits found by both methods 86.8% 83.9% 81.5%
Hits missed by AR-0.73 No common reference 0.2% 0.0% 0.0%
With common reference 6.7% 7.3% 10.1%
Hits missed by ROCS Threshold relateda 5.7% 7.5% 6.1%
Real miss 0.6% 1.2% 2.3%
• Extract all the live records from the PubChem Com-pound [16] database
• Split mixtures into single covalent units
• Remove each structure not compliant with MMFF94s as implemented in OMEGA [20]
• Neutralize each ionic structure using a hydrogen atom, if chemically sensible
• Remove duplicate structures by comparing CACTVS stereo hash codes [23]
• Remove structures with incomplete stereochemistry (i.e., cis/trans double bonds or R/S stereo centers that are undefined)
• Remove structures with more than twenty-seven heavy atoms and more than five rotatable bonds
• Build the single conformer dataset using OMEGA 1.8.1 [20]
• Build the multiple conformer ensemble using OMEGA 2.0 Beta [20] and RMSD 1.0 Å spacing
Gaussian shape overlay
The volume of a molecule is generally represented as the finite union of overlapping spheres, each one representing an atom. Although the most intuitive, the hard-sphere model involves complicated analytical expressions and gradient discontinuities. Grant and Pickup [24] overcame these problems by replacing the hard-sphere density func-tion by a soft-sphere Gaussian equivalent, allowing rapid computation of molecular volumes. The smoothness of the Gaussian function and the simplicity of its derivatives greatly facilitate shape overlay optimizations [10]. Grant and Pickup algorithms are currently implemented in the OpenEye OEShape C++ toolkit [25]. The ROCS applica-tion is built using this toolkit. When we refer to ROCS, we are actually referring to the OEShape toolkit.
ble from the OpenEye OEChem C++ library [26], and only non-hydrogen atoms are considered during shape comparisons. The shape similarity measure used is the Gaussian shape Tanimoto depicted in Eq. 2.
Alignment-recycling evaluates alignment-quality after each matrix multiplication through a single point shape Tanimoto computation. We used our own implementa-tion of the ROCS Grid method. The results from our method are in essence identical to the results produced by ROCS (R2 = 0.9998, SD = 0.00073, with N = 9 401 620
and maximum difference = 0.012).
Diverse reference shape selection
The methodology for reference shape selection has been explained in great detail by Haigh et al. [15]. The dataset of conformers are clustered using a simple sphere exclu-sion algorithm. In the first step, a starting conformer is randomly selected as a reference shape. In the second step, all the conformers with a shape Tanimoto to the current reference shape greater than a pre-defined cut-off value (i.e., the "Design-Tanimoto" value) are assigned to the current reference shape cluster. For all the unassigned con-formers, the shape Tanimoto to the most similar reference shape is stored. In the third step, the one conformer with the lowest stored similarity is selected as a new reference shape. The second and third steps are repeated until all conformers are assigned to a reference shape cluster. The Design-Tanimoto defines the resolution of coverage of the "shape space" of the dataset. The structure of the reference shapes is available in supporting information.
Speed comparison
Open access provides opportunities to our colleagues in other parts of the globe, by allowing
anyone to view the content free of charge.
Publish with
Chemistry
Central and every
scientist can read your work free of charge
W. Jeffery Hurst, The Hershey Company.
available free of charge to the entire scientific community peer reviewed and published immediately upon acceptance cited in PubMed and archived on PubMed Central yours you keep the copyright
Submit your manuscript here:
http://www.chemistrycentral.com/manuscript/ Intel dual-core Xeon processors on the SuSE Enterprise 9.3
platform.
Authors' contributions
FF wrote the first draft of the manuscript, developed the algorithms, and performed the testing experiments. EB participated in preparation of the PubChem dataset, design of experiments, and helped write the manuscript. YB participated in the conformer generation, gave advice on the design of experiments, and the writing of the man-uscript. SHB supervised the work and provided critical review of the manuscript. All authors read and approved the final manuscript.
Additional material
Acknowledgements
The authors are thankful to Anthony Nicholls for constructive comments, Wolf-D. Ihlenfeldt who helped write CACTVS scripts, and OpenEye Scien-tific Software for intuitive insights and useful 3D tools. This research was supported by the Intramural Research Program of the National Institutes of Health, National Library of Medicine.
References
1. Sheridan RP, Kearsley SK: Why do we need so many chemical similarity search methods? Drug Discovery Today 2002, 7(17):903. 2. Nikolova N, Jaworska J: Approaches to Measure Chemical
Sim-ilarity ± a Review. QSAR Comb Sci 2003, 22:1006-1026.
3. Barbosa F, Horvath D: Molecular similarity and property simi-larity. Curr Top Med Chem 2004, 4(6):589-600.
4. Bender A, Glen RC: Molecular similarity: a key technique in molecular informatics. Org Biomol Chem 2004, 2(22):3204-3218. 5. Good AC, Hermsmeier MA, Hindle SA: Measuring CAMD tech-nique performance: a virtual screening case study in the design of validation experiments. J Comput Aided Mol Des 2004,
18(7-9):529-536.
6. Takahashi Y, Sukekawa M, Sasaki S: Automatic Identification of Molecular Similarity Using Reduced-Graph Representation of Chemical Structure. J Chem Inf Comput Sci 1992, 32:639-643. 7. Rarey M, Dixon JS: Feature trees: a new molecular similarity
measure based on tree matching. J Comput Aided Mol Des 1998,
12(5):471-490.
8. Barker EJ, Buttar D, Cosgrove DA, Gardiner EJ, Kitts P, Willett P, Gil-let VJ: Scaffold hopping using clique detection applied to reduced graphs. J Chem Inf Model 2006, 46(2):503-511.
9. ROCS - Rapid Overlay of Chemical Structures 2.2th edition. 2006 [http://www.eyesopen.com]. OpenEye Scientific Software, Inc. 10. Grant JA, Gallardo MA, Pickup BT: A fast method of molecular shape comparison: A simple application of a Gaussian description of molecular shape. J Comput Chem 1996,
17(14):1653-1666.
11. Rush TS 3rd, Grant JA, Mosyak L, Nicholls A: A shape-based 3-D scaffold hopping method and its application to a bacterial protein-protein interaction. J Med Chem 2005, 48(5):1489-1495. 12. Gundersen E, Fan K, Haas K, Huryn D, Steven Jacobsen J, Kreft A, Martone R, Mayer S, Sonnenberg-Reines J, Sun SC, Zhou H: Molec-ular-modeling based design, synthesis, and activity of substi-tuted piperidines as [gamma]-secretase inhibitors. Bioorganic & Medicinal Chemistry Letters 2005, 15(7):1891.
13. Muchmore SW, Souers AJ, Akritopoulou-Zanze I: The Use of Three-Dimensional Shape and Electrostatic Similarity Searching in the Identification of a Melanin-Concentrating Hormone Receptor 1 Antagonist. Chemical Biology & Drug Design 2006, 67(2):174-176.
14. Ghuloum AM, Sage CR, Jain AN: Molecular Hashkeys: A Novel Method for Molecular Characterization and Its Application for Predicting Important Pharmaceutical Properties of Mol-ecules. J Med Chem 1999, 42(10):1739-1748.
15. Haigh JA, Pickup BT, Grant JA, Nicholls A: Small Molecule Shape-Fingerprints. J Chem Inf Model 2005, 45(3):673-684.
16. Wheeler DL, Barrett T, Benson DA, Bryant SH, Canese K, Chetvernin V, Church DM, DiCuccio M, Edgar R, Federhen S, Geer LY, Helmberg W, Kapustin Y, Kenton DL, Khovayko O, Lipman DJ, Madden TL, Maglott DR, Ostell J, Pruitt KD, Schuler GD, Schriml LM, Sequeira E, Sherry ST, Sirotkin K, Souvorov A, Starchenko G, Suzek TO, Tatusov R, Tatusova TA, Wagner L, Yaschenko E: Database resources of the National Center for Biotechnology Infor-mation. Nucleic Acids Res 2006, 34(Database issue):D173-80. 17. Oprea TI, Davis AM, Teague SJ, Leeson PD: Is there a difference
between leads and drugs? A historical perspective. J Chem Inf Comput Sci 2001, 41(5):1308-1315.
18. Lipinski CA, Lombardo F, Dominy BW, Feeney PJ: Experimental and computational approaches to estimate solubility and permeability in drug discovery and development settings. Advanced Drug Delivery Reviews 1997, 23(1-3):3.
19. Halgren TA: MMFF VI. MMFF94s option for energy minimiza-tion studies. J Comput Chem 1999, 20(7):720-729.
20. OMEGA 2006 [http://www.eyesopen.com]. OpenEye Scientific Software, Inc.
21. Gobbi A, Lee ML: DISE: directed sphere exclusion. J Chem Inf Comput Sci 2003, 43(1):317-323.
22. Bostrom J, Greenwood JR, Gottfries J: Assessing the performance of OMEGA with respect to retrieving bioactive conforma-tions. J Mol Graph Model 2003, 21(5):449-462.
23. Ihlenfeldt WD, Gasteiger J: Hash Codes For The Identification And Classification Of Molecular-Structure Elements. J Com-put Chem 1994, 15(8):793-813.
24. Grant JA, Pickup BT: A Gaussian Description of Molecular Shape. J Phys Chem 1995, 99(11):3503-3510.
25. OEShape - C++ . 1.6.1 edition. Santa Fe , OpenEye Scientific Soft-ware, Inc.; 2006.
26. OEChem - C++ . 1.4.2 edition. Santa Fe , OpenEye Scientific Soft-ware, Inc.; 2006.
Additional file 1
diverse set of reference shapes. MDL SD File containing 5 534 reference shapes with their 3D coordinates. The first 2 458 structures were selected using the single-conformer dataset.
Click here for file
[http://www.biomedcentral.com/content/supplementary/1752-153X-1-12-S1.zip]
Additional file 2
65 test compounds used to query the multi-conformer database. MDL SD File containing 65 randomly selected 3D conformers, one for each compound.
Click here for file