R E S E A R C H
Open Access
Integration of proteomic and transcriptomic
profiles identifies a novel PDGF-MYC network in
human smooth muscle cells
Wei Yang
1,2†, Aruna Ramachandran
3,4†, Sungyong You
1†, HyoBin Jeong
5, Samantha Morley
3,4, Michelle D Mulone
3,
Tanya Logvinenko
6, Jayoung Kim
1,2,3,4, Daehee Hwang
5,7, Michael R Freeman
1,2,3,4and Rosalyn M Adam
3,4,8*Abstract
Background:Platelet-derived growth factor-BB (PDGF-BB) has been implicated in the proliferation, migration and synthetic activities of smooth muscle cells that characterize physiologic and pathologic tissue remodeling in hollow organs. However, neither the molecular basis of PDGFR-regulated signaling webs, nor the extent to which specific components within these networks could be exploited for therapeutic benefit has been fully elucidated.
Results:Expression profiling and quantitative proteomics analysis of PDGF-treated primary human bladder smooth muscle cells identified 1,695 genes and 241 proteins as differentially expressed versus non-treated cells. Analysis of gene expression data revealed MYC, JUN, EGR1, MYB, RUNX1, as the transcription factors most significantly networked with up-regulated genes. Forty targets were significantly altered at both the mRNA and protein levels. Proliferation, migration and angiogenesis were the biological processes most significantly associated with this signature, and MYC was the most highly networked master regulator. Alterations in master regulators and gene targets were validated in PDGF-stimulated smooth muscle cells in vitro and in a model of bladder injury in vivo. Pharmacologic inhibition of MYC and JUN confirmed their role in SMC proliferation and migration. Network analysis identified the diaphanous-related formin 3 as a novel PDGF target regulated by MYC and JUN, which was necessary for PDGF-stimulated lamellipodium formation.
Conclusions:These findings provide the first systems-level analysis of the PDGF-regulated transcriptome and proteome in normal smooth muscle cells. The analyses revealed an extensive cohort of PDGF-dependent biological processes and connected key transcriptional effectors to their regulation, significantly expanding current knowledge of PDGF-stimulated signaling cascades. These observations also implicate MYC as a novel target for pharmacological intervention in fibroproliferative expansion of smooth muscle, and potentially in cancers in which PDGFR-dependent signaling or MYC activation promote tumor progression.
Keywords:Visceral smooth muscle, Proteomics, Transcriptomics, Network analysis, PDGF, DIAPH3, ProteomeXchange PXD000624
* Correspondence:[email protected] †Equal contributors
3Urological Diseases Research Center, Boston Children’s Hospital, Boston, MA
02115, USA
4Department of Surgery, Harvard Medical School, Boston, MA 02115, USA
Full list of author information is available at the end of the article
Introduction
Smooth muscle-rich hollow organs such as the vascula-ture, airways, gut and urinary tract undergo tissue remod-eling following injury. These alterations in tissue structure include cellular hypertrophy and hyperplasia, increased synthesis and secretion of extracellular matrix, dediffe-rentiation of smooth muscle cells (SMC) and progressive loss of normal contractile function. Importantly, even after removal or attenuation of the inciting stimulus, tissue damage resulting from pathologic remodeling persists, sometimes indefinitely, and there are typically limited options for treatment.
Among the soluble factors implicated in the pathologic responses of SMC to injury, the potent mitogen and motogen platelet-derived growth factor-BB (PDGF-BB) has emerged as an important soluble driver [1]. PDGF-BB elicits biological effects, such as proliferation and migration, through dimerization and activation of PDGF receptor (PDGFR) tyrosine kinases and initi-ation of downstream kinase cascades that impinge on transcriptional complexes (reviewed in [2]). Signaling through the PDGFR axis has been implicated in a range of pathological conditions, including atherosclerosis, air-way remodeling in asthma [3,4] and fibroproliferative changes in the bladder wall [5]. However, neither the mo-lecular basis of the PDGFR signaling repertoire, nor the extent to which specific elements within these cascades could be exploited for therapeutic benefit has been fully elucidated.
The downstream targets of PDGFR activation in smooth muscle have, for the most part, been defined at the level of small numbers of proteins or genes [5-8]. Expression profiling of smooth muscle exposed to PDGF has thus far been restricted to SMC of vascular origin, and has identi-fied NFAT family members and target genes as important effectors of vascular SMC behavior in the setting of vascular injury [9,10]. Genome-wide evaluation of PDGF-stimulated visceral smooth muscle gene expression has yet to be reported. Several groups, including our own, have employed mass spectrometry-based proteo-mics to interrogate PDGF-induced changes in cells of mesenchymal origin [11-15]. In a previous study, we used isotope-coded affinity tagging (ICAT) analysis coupled with mass spectrometry to quantify PDGF-induced protein alterations in a human visceral SMC sub-proteome [14]. In that study we observed marked enrichment in proteins associated with endocytosis and the cytoskeleton in lipid raft microdomains of cells treated with PDGF, consistent with other studies linking PDGF to alterations in cell morphology and the actin cytoskeleton.
In this study, we present the first integrated analysis of gene expression and proteome-level alterations in human visceral SMC challenged with PDGF.
Results
Gene expression regulated by PDGF
In order to interrogate global responses to PDGF-BB at both gene and protein levels, we used primary human bladder smooth muscle cells (pBSMC) to perform RNA expression profiling in concert with quantitative analysis of the entire proteome using the SILAC method.
Expres-sion of PDGFRα and PDGFRβ isoforms was verified in
pBSMC by real-time RT-PCR and immunoblot analysis (Figure S2A & S2B (see Additional file 1)). Cells subjected to triplex SILAC labeling were treated with 1 nM PDGF-BB for 0, 4 or 24 h. Total protein lysates were analyzed using mass spectrometry, and total RNA was analyzed by expression profiling (workflow shown in Figure S2, (see Additional file 2)).
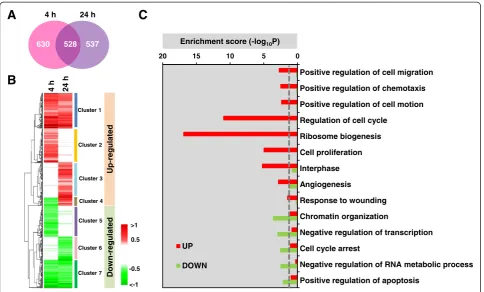
Microarray data were assessed and determined to be of high quality (Figure S3 (see Additional file 3)); a high degree of reproducibility was observed based on inter-and intra-group variation of the arrays, with all pairwise correlation coefficients between samples >0.98. A total of 1695 differentially expressed genes (DEGs) with overall
p<0.05 (Table S1 (see Additional file 4)) were identified at either 4 or 24 h using an integrative statistical method previously reported ([16], Materials and Methods). Of these, 528 DEGs were significantly changed at both 4 h and 24 h following PDGF treatment, while 630 and 537 DEGs were significantly changed only at the 4 or 24 h time point, respectively (Figure 1A). DEGs were grouped into clusters (Clusters 1 to 7), based on time-dependent differential expression patterns, by hierarchical cluster analysis. The seven clusters could be sub-categorized into those representing up-regulated genes (Clusters 1 to 4) and those reflecting down-regulated genes (Clusters 5 to 7). These data showed that 487 (88%) of the 528 DEGs identified at both times were consistently up- or down-regulated (Clusters 1 or 7 in Figure 1B), while 63 (12%) of the 528 genes perturbed at both times were down-regulated at 4 h but up-regulated at 24 h (Cluster 4 in Figure 1B). Functional enrichment analysis of Gene Ontology Biological Processes using Database for Annota-tion, Visualization and Integrated Discovery (DAVID) software suggested that cell cycle transit, cell prolifer-ation, cell migration and motility, ribosome biogenesis and angiogenesis were the most prominent biological processes in the group of genes up-regulated by PDGF, whereas cell cycle arrest, chromatin organization and apoptotic pathways were the most prominent processes in the down-regulated group (Figure 1C).
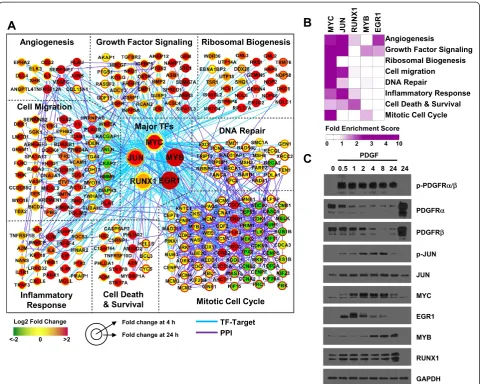
Significantly up-regulated DEGs were mainly downstream targets of EGR1, JUN, MYB, RUNX1, and MYC (Figure 2A) while the significantly down-regulated DEGs were largely regulated by DDIT3, NFAT5, and SOX5 (data not shown). The up-regulated DEGs were enriched in eight biological processes: angiogenesis, growth factor signaling, ribosomal biogenesis, cell migration, inflammatory response, cell death and survival, mitotic cell cycle, and DNA repair (Figure 2B). In addition, the enrichment analysis showed that MYC targets were significantly enriched in all 8 processes and JUN targets were enriched in 6 out of the 8 processes, indicating that MYC and JUN are the two most prominent TFs downstream of PDGF in pBSMCs. Consistent with these results, a time-dependent assessment of these TFs confirmed that expression and/or phosphorylation of EGR1, JUN, MYB, RUNX1, and MYC was increased (Figure 2C) while that of DDIT3, NFAT5, and SOX5 was decreased by PDGF treatment at some but not all time points within 24 h (Figure S1D (see Additional file 1)).
Protein expression regulated by PDGF
To identify proteins regulated by PDGF, triplex SILAC analysis was performed in three replicates. A total of 2489
proteins were identified with FDR < 0.01. Representative mass spectra of SILAC peptide triplets are shown in Figure S4 (see Additional file 5). After quality assessment, 241 differentially expressed proteins (DEPs) with overall
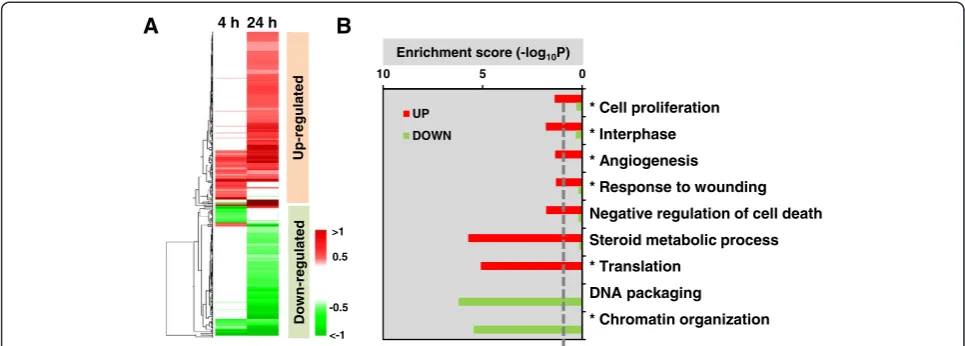
p< 0.05 (Table S2 (see Additional file 6)) were identified using integrated statistics ([16], Materials and methods). Hierarchical clustering showed that the DEPs were broadly grouped into up- and down-regulated clusters, with the majority of DEPs only significantly differentially expressed at 24 h (Figure 3A). Enrichment analysis of Gene Ontology processes indicated that cell proliferation, response to wounding, angiogenesis, translation and ster-oid metabolic pathways were significantly up-regulated. Conversely, DNA compaction and chromatin organization pathways were down-regulated (Figure 3B). Biological processes common to the transcriptome and proteomic profiles are indicated by asterisks.
Integration of microarray and SILAC datasets
Next we performed an integrated analysis to explore the concordance between mRNA and protein levels in PDGF-treated pBSMCs. The correlation coefficient between mRNA and protein levels in pBSMCs treated without or with PDGF ranged from 0.41 to 0.45 (Figure S5
0 5
10 15 20
UP
DOWN
<-1 -0.5 0.5 >1
4 h 24 h
528
630 537
4 h 24 h
Up
-regulated
Dow
n
-regulated
Positive regulation of cell migration
Positive regulation of chemotaxis
Positive regulation of cell motion
Regulation of cell cycle
Ribosome biogenesis
Cell proliferation
Interphase
Angiogenesis
Response to wounding
Chromatin organization
Negative regulation of transcription
Cell cycle arrest
Negative regulation of RNA metabolic process
Positive regulation of apoptosis Enrichment score (-log10P)
A
B
C
Cluster 1
Cluster 2
Cluster 3
Cluster 4
Cluster 5
Cluster 6
Cluster 7
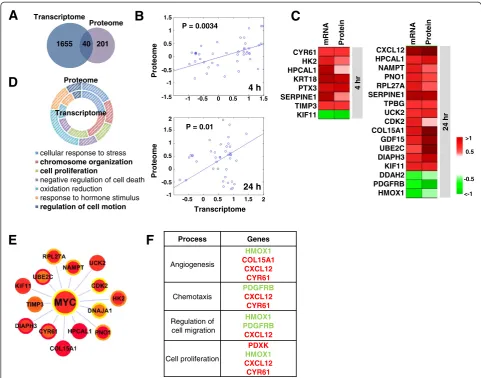
(see Additional file 7)). This is consistent with a previ-ous global-scale correlation study showing that the coefficient of determination between mRNA and pro-tein copy numbers in mouse NIH3T3 fibroblasts is 0.41 [23]. Among the 1695 DEGs and 241 DEPs, 40 tar-gets were significantly changed at both mRNA and protein levels (Figure 4A, Table S3 (see Additional file 8)) and the changes at both levels were significantly
corre-lated (p≤0.01) (Figure 4B). 22 mRNA and protein species
were consistently up- or down-regulated at 4 and 24 h (Figure 4C). Despite only 40 shared species, there was
remarkable similarity in biological processes represented by the DEGs and DEPs (Figure 4D). This indicates that the shared alterations induced by PDGF are clearer at the cellular process or pathway levels than at the molecular level. Computational integration of all known transcrip-tion factors and their predicted potential to regulate the 40 shared RNA and protein species, identified MYC as the central transcriptional regulator of this signature (Figure 4E). The dominant biological processes represented by this signature were angiogenesis, chemotaxis, regulation of cell migration and cell proliferation (Figure 4F).
Target validation in vitro and in vivo
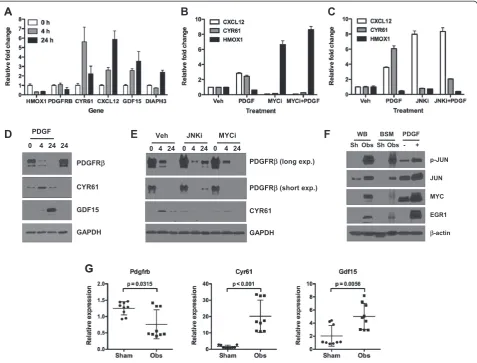
The up- or down-regulation of a cohort of the molecules most significantly associated with the shared processes was validated by real-time RT-PCR analysis. As shown in Figure 5A, expression of HMOX1, PDGFRB, CYR61, CXCL12, GDF15 and DIAPH3 displayed time-dependent changes in expression following PDGF treatment. Find-ings presented in Figure 4 implicate MYC as a central regulator of the pBSMC response to PDGF. Notably, JUN/ AP-1 also emerged from this global analysis (Figure 2), a finding that appears to confirm a series of published stud-ies that identified JUN/AP-1 as a key regulator of mechan-ical signals in pBSMC [5,24-28]. To probe the functional significance of these observations, we determined the impact of pharmacologic inhibition of MYC and JUN activation on expression of a subset of the validated gene targets. After confirming that MYC and JUN were effectively inhibited with the MYC inhibitor 10058-F4 (hereafter MYCi, [29]) and the JNK inhibitor SP600125 (hereafter JNKi) respectively, in pBSMCs (Figure S6 (see Additional file 9)), expression of 3 PDGF targets (HMOX1, CXCL12, and CYR61) was assessed by real-time RT-PCR. MYCi suppressed PDGF-regulated expression of all 3 targets, (Figure 5B) whereas JNKi only suppressed PDGF-regulated expression of HMOX1 but not of CXCL12 or CYR61 (Figure 5C). As independent validation of the net-work, additional targets were verified at the protein level (Figure 5D) and shown to be differentially sensitive to pharmacologic inhibition of JUN or MYC. PDGF-induced
down-regulation of PDGFRβ was attenuated following
inhibition of JNK, but insensitive to MYC inhibition. In contrast, inhibition of either JNK or MYC attenuated PDGF-stimulated up-regulation of CYR61 (Figure 5E).
To extend these findings, we determined whether signal-ing pathways and targets were altered in a mouse model of bladder injury. A previous study from our group demon-strated acute activation of the PDGFR axis and down-stream effectors in response to bladder wall distension in rodents [5,28]. As shown in Figure 5F, acute obstruction injury increased the level and/or phosphorylation of 3
tran-scription factors– JUN, MYC, and EGR1 –identified as
key regulatory nodes in PDGF-stimulated transcription (Figure 2). In addition, expression of Pdgfrb, Cyr61 and Gdf15 transcripts was altered in the bladder injury model in a manner consistent with that observed following PDGF treatment of pBSMC (Figure 5G), further validating the network predictions.
Functional interrogation of key regulatory nodes
To determine the biological significance of MYC- and JUN-mediated transcriptional events, we measured the impact of pharmacologic inhibition of MYC and JUN activation on pBSMC proliferation and migration. Inhib-ition of MYC or JUN attenuated PDGF-induced pBSMC cell proliferation (Figures 6A and 6B) and migration (Figures 6C and 6D), respectively.
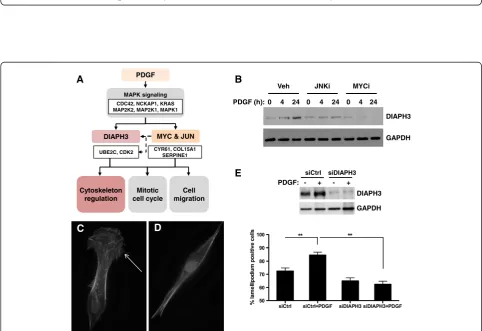
A common process underlying the dominant biological processes we identified (cell proliferation, chemotaxis, migration and angiogenesis) is actin cytoskeletal dynam-ics. Among the PDGF-responsive species identified at both the RNA and protein levels, the diaphanous-related formin protein DIAPH3 has been identified as a mediator of actin remodeling [30-32]. Our hypothetical model pre-dicted a potential involvement of a MYC-JUN-DIAPH3 pathway in regulation of cytoskeletal remodeling in re-sponse to PDGF (Figure 7A). We investigated the effect of
0 5
10
UP
DOWN
* Cell proliferation
* Interphase
* Angiogenesis
* Response to wounding
Negative regulation of cell death
Steroid metabolic process
* Translation
DNA packaging
* Chromatin organization Enrichment score (-log10P)
4 h 24 h
<-1 -0.5 0.5 >1
Up-regulated
Dow
n
-regulated
A
B
PDGF on DIAPH3 levels in pBSMC and demonstrated DIAPH3 down-regulation in PDGF-stimulated cells treated with MYC or JUN inhibitors (Figure 7B). RNAi-mediated silencing of DIAPH3 did not alter pBSMC proliferation or migration (data not shown), however it attenuated the PDGF-induced increase in lamellipodium formation in pBSMC (Figures 7C-E). Together, these findings suggest DIAPH3 may be a novel MYC and JUN target in pBSMC that regulates PDGF-induced alterations in cell morphology.
Discussion
In this study we present a global analysis of gene and protein responses to PDGF in normal human visceral smooth muscle cells. To our knowledge this is the first
integrated, quantitative proteomics and transcriptomics analysis in smooth muscle of any type. The proteomics dataset we have reported here represents the largest pro-tein database of human SMCs ever assembled. Network analysis validated the importance of MYC and JUN/AP-1 in promoting SMC proliferation and migration, and also suggested the formin DIAPH3 may be a novel PDGF-sensitive regulator of SMC behavior. Our integrated ana-lysis extends current understanding of PDGF-stimulated networks by uncovering a comprehensive list of PDGF-dependent biological processes and pathways and linking key transcription factors to their regulation. Moreover, integration of transcriptomics and proteomics revealed shared pathways, processes and master regulators. It also enhanced the reliability of both target identification and
40 201 1655
Proteome Transcriptome
A
D
B
F
cellular response to stress chromosome organization cell proliferationnegative regulation of cell death oxidation reduction
response to hormone stimulus regulation of cell motion
Transcriptome
Proteome Proteome
Proteome
P = 0.0034
4 h
P = 0.01
Transcriptome 24 h 0
0
-0.5
-1
-1.5 -1 -0.5 0.5 1 1.5
0.5 1 1.5
0
-0.5
-1
2
0.5 1 1.5
0
-0.5 0.5 1 1.5 2
Process Genes
Angiogenesis
HMOX1
COL15A1 CXCL12
CYR61
Chemotaxis
PDGFRB
CXCL12 CYR61
Regulation of cell migration
HMOX1 PDGFRB
CXCL12
Cell proliferation
PDXK
HMOX1
CXCL12 CYR61
E
mRNA Protein CYR61
HK2 HPCAL1 KRT18 PTX3 SERPINE1 TIMP3 KIF11
CXCL12 HPCAL1
NAMPT PNO1 RPL27A SERPINE1 TPBG UCK2 CDK2 COL15A1 GDF15 UBE2C DIAPH3 KIF11 DDAH2 PDGFRB
HMOX1 <-1
-0.5 0.5 >1
4 hr
24
hr
C
mRNA Protein
the associated network in comparison to microarray or proteomics analyses alone.
Pathologic remodeling of hollow organs such as the bladder, airways and vasculature involves alterations in SMC proliferation, extracellular matrix synthesis, cell morphology and cell motility. In agreement with these changes, integration analysis of differentially expressed genes and proteins in visceral SMC exposed to PDGF identified (i) regulation of cell proliferation; (ii) negative regulation of cell death; and (iii) regulation of cell motion as 3 of the most over-represented biological processes. A major finding of the current study was the emergence of MYC and JUN as dominant regulators of the
PDGF-induced transcriptional program in visceral smooth muscle, and their identification as novel regulators of DIAPH3. Previous reports from us and others have impli-cated JUN/AP-1 in a variety of mechanosensitive cell behaviors in smooth muscle, including gene regulation, proliferation and migration [5,24-26,28,33,34]. Moreover, findings from our studies revealed significant overlap be-tween mechanical and PDGF-stimulated signals in their ability to regulate signal transduction, gene expression and cell cycle transit [5,26,35]. In genome-wide expression profiling, we found that >70% of genes selectively induced by cyclic stretch-relaxation of SMC in vitro were similarly up-regulated by PDGF treatment [26]. In that study,
Figure 6Effect of inhibition of MYC and JNK/JUN function on PDGF-induced changes in cell growth and migration. (A, B)Effects of MYC (A)and JUN(B)inhibition on the PDGF-stimulated increase in cell biomass, assessed 24 h or 48 h following treatment with growth factor(C, D) Inhibition of PDGF-directed cell migration in the presence of the MYC(C)and JUN(D)inhibitors. **, p < 0.05.
C
B
D
E
Veh JNKi MYCi
DIAPH3
GAPDH PDGF (h): 0 4 24 0 4 24 0 4 24
PDGF:
siCtrl siDIAPH3
- + - +
DIAPH3
GAPDH
A PDGF
Cytoskeleton regulation
Mitotic cell cycle
Cell migration MAPK signaling
CDC42, NCKAP1, KRAS MAP2K2, MAP2K1, MAPK1
DIAPH3 MYC & JUN
UBE2C, CDK2 CYR61, COL15A1 SERPINE1
informatics analysis revealed AP-1 as the transcription fac-tor most significantly associated with stretch-induced gene expression. We proceeded to demonstrate that mechan-ical injury of the bladder promoted rapid phosphorylation of the PDGF receptor, independently of exogenous ligand, to promote up-regulation of the AP-1 target thrombomo-dulin [5]. Together, these observations suggest a mechan-ism underlying convergence of mechanical and growth factor signaling that involves PDGF receptor activation.
Among the overlapping genes and proteins identi-fied in the current study as significantly enriched in re-sponse to PDGF treatment, CYR61, HMOX1 and CXCL12 emerged as genes linked to biological processes relevant to tissue remodeling, i.e. proliferation, migration and mo-tility. Elevated CXCL12 and CYR61 have been implicated in fibroproliferative responses of vascular SMC and fibro-cytes in arterial and airway remodeling [36-38], whereas CYR61 is elevated in hypertrophic smooth muscle of the bladder wall secondary to outlet obstruction and following cyclic stretch-relaxation of bladder SMC in vitro [27,39]. Conversely, up-regulation of HMOX1 has been reported to attenuate both mitogen-induced proliferation and migration of SMC in vitro [40,41], as well as smooth muscle remodeling in response to hypoxic injury [42]. In the current study, CYR61, HMOX1 and CXCL12 were also linked to the process of angiogenesis. A similar angiogenesis-focused gene signature was identified by Yang and colleagues in SMC exposed to mechanical stretch [27]. In that study AP-1, EGR-1 and MYB were identified as putative transcriptional regulators of the mechanosensitive transcriptional program, in agreement with our current and prior findings (Figure 2, [26]). Al-though MYC itself was not identified, the MYC family members upstream regulatory factor 1 (USF1) and USF2 were implicated as putative transcriptional regulators in both studies that evaluated stretch-induced gene expres-sion in bladder SMC [27]. USF1 and USF2 bind to E-box motifs in target gene promoters and antagonize MYC activity [43,44]. Notably, USF1 and USF2 have been shown to directly up-regulate transcription of HMOX-1 in vitro and in vivo [45,46]. Our current findings showing that PDGF-induced downregulation of HMOX-1 in visceral SMC was reversed by pharmacologic inhibition of MYC is consistent with negative regulation of HMOX-1 expression by MYC and with its antagonistic interaction with USF1/2 at target gene regulatory regions. Exposure of hollow or-gans to mechanical stress in vivo induces transient hypoxia, as a result of vascular compression, which in turn enhances blood flow [47]. The identification of angiogenesis-asso-ciated gene signatures in SMC exposed to convergent mechanical or growth factor stimuli may therefore be a component of the subsequent hypertrophic and hyper-plastic response that enables tissues to adapt to and coun-teract increased intraluminal pressure within the organ.
In a recent report, Yohannes and coworkers employed 2D-differential in-gel electrophoresis (2D-DIGE) to profile proteins that were differentially expressed in the bladder smooth muscle of rats subjected to streptozotocin-induced diabetes for different periods of time [48]. Diabetes promotes a spectrum of pathologic changes in the urinary tract, including profound alterations in smooth muscle mass and contractility [49]. Although not identified by 2D-DIGE as differentially expressed in experimental diabetes, MYC, along with EGR1 and the AP-1 subunit c-Fos, emerged as interconnected nodes following interro-gation of differentially expressed proteins using MetaCore software [48]. Similarly, in our analysis, the transcription factors JUN, MYC and EGR1 were not identified as PDGF-induced proteins by quantitative proteomics analysis of primary SMC cultures, but were revealed through higher order transformation of expression data as master regulators of PDGF-stimulated transcriptional and protein changes in visceral SMC.
In the present study, analysis of the gene targets for each of the master regulators identified in Figure 2 revealed a high degree of potential cross-regulation, in that the promoter for each transcription factor contained putative binding sites for all other factors analyzed (data not shown). Consistent with the possibility for functional interaction, a recent study revealed time-dependent up-regulation of transcription factor-specific gene modules in an in vitro model of acute MYC activation [50]. In response to MYC induction, genes harboring AP-1 and CREB motifs were induced first, followed by those targeted by EGR1, and concluding with putative MYC targets. Taken together, these findings argue for a co-ordinated, temporal relationship between the master regulatory nodes we identified here. Given the potential for positive feedback regulation, they may also provide an explanation for the sustained fibroproliferation evident in hollow organ remodeling.
DIAPH3 expression in visceral SMC did not affect migration or proliferation, but rather attenuated PDGF-stimulated formation of lamellipodia. These observations are consistent with a recent report describing a role for mDia2/DIAPH3 in nucleation of actin filaments in both filopodia and lamellipodia [32]. Notably, our prior quanti-tative proteomics study identified a cohort of actin cyto-skeleton regulators that were up-regulated in caveolar lipid raft microdomains of PDGF-treated SMC [14]. Given the localization of activated PDGFR, actin regulators and DIAPH3 to lipid rafts ([14,53,54] and unpublished results, M.R.F), they support the functional importance of such microdomains as sites of integration for signals that regu-late cell morphology and motility [55-57].
The mechanisms underlying regulation of DIAPH3 expression are largely unexplored. Our findings showed decreased expression of DIAPH3 in PDGF-treated SMC following pharmacologic inhibition of either JUN or MYC activity. Interestingly, the transcriptional co-activator Yes-associated protein (YAP) has been shown to promote DIAPH3 mRNA expression in fibroblasts [58] and to interact functionally with both JUN and MYC [59,60]. Moreover, YAP is known to be upregulated in vascular SMC exposed to PDGF, and was found to be necessary for PDGF-mediated SMC proliferation [61]. Taken together, these findings are consistent with a direct role for MYC and/or JUN/AP-1 in transcription of the DIAPH3 gene.
Conclusions
In summary, our results implicate MYC and JUN/AP-1 as key regulators of normal visceral SMC proliferation and migration, and provide the first evidence of a PDGF-sensitive MYC-regulated network in any cell type. These findings imply that MYC is a novel target for pharmacological intervention, not only in fibroprolifera-tive expansion of smooth muscle in hollow organs, but also in cancers in which PDGFR-dependent signaling and/or MYC activation are drivers of tumor progression. Although transcription factors are challenging to target pharmacologically using small molecules, recent studies have reported encouraging results with inhibition of MYC in preclinical models of fibrosis and cancer [62-64]. Future studies evaluating these inhibitors in models of pathologic remodeling and cancer are clearly warranted.
Materials and methods Materials
Recombinant human PDGF-BB was from R&D Systems
(Minneapolis, MN). Antibodies to PDGFRα, PDGFRβ,
phospho-PDGFRα/β Tyr849/Tyr857, c-Jun,
phospho-c-Jun Ser63, c-Myc, EGR1, RUNX1, DDIT3, CYR61 and GDF15 were from Cell Signaling Technology (Danvers, MA); antibodies to Myb and NFAT5 were from Epitomics (Burlingame, CA); antibodies to SOX5 and GAPDH were
from Santa Cruz Biotechnology (Santa Cruz, CA);
anti-body toβ-actin was from Sigma Aldrich (Sigma Chemical
Company, St. Louis, MO); antibody to DIAPH3 was a generous gift from Henry Higgs, Dartmouth Medical School. The c-Myc TF ELISA kit was from Active Motif (Carlsbad, CA). SP600125 and 10048-F4 were from EMD Biosciences (Billerica, MA). iScript cDNA synthesis re-agents were from BioRad Laboratories (Hercules, CA). Universal PCR master mix for qRT-PCR and gene-specific assays were from Applied Biosystems (now Life Tech-nologies, Grand Island, NY). Primers for human tran-scripts were as follows: Hs00171022_m1 for CXCL12; Hs00998500_g1 for CYR61; Hs01107330_m1 for DIAPH3; Hs02758991_g1 for GAPDH; Hs00171132_m1 for GDF15; Hs01110250_m1 for HMOX-1; Hs00998018_m1 for PDGFRA; and Hs01019589_m1 for PDGFRB. Primers for mouse transcripts were Mm00487499_g1 for Cyr61; Mm99999915_g1 for GAPDH; Mm00442228_m1 for Gdf15; Mm00435546_m1 for Pdgfrb.
Cell culture and triplex SILAC labeling
Primary human bladder smooth muscle cells (pBSMCs) were cultured in smooth muscle cell medium (SMCM, Sciencell Research Laboratories, Carlsbad, CA) at 37°C
in a humidified incubator with 5% CO2. For triplex
SILAC labeling, pBSMCs were grown in arginine- and lysine-depleted SMCM (Sciencell Research Laboratories) supplemented with 2% (v/v) dialyzed fetal bovine serum (Invitrogen, Grand Island, NY) and L-arginine (Arg0)
and L-lysine (Lys0), 13C6-L-arginine (Arg6) and
4,4,5,5-D4-L-lysine (Lys4), or 13C615N4-L-arginine (Arg10) and 13
C615N2-L-lysine (Lys8) (Cambridge Isotope
Laborator-ies, Andover, MA). After at least 6 population doublings,
pBSMCs cultured in “light”, “medium”, and “heavy”
SILAC media were serum starved overnight and treated with 1 nM PDGF-BB for 0, 4, and 24 h, respectively.
RNA extraction and microarray analysis
Identification of differentially expressed genes (DEGs) With the normalized intensities, DEGs in samples at 4 h or 24 h after PDGF treatment in comparison with con-trol samples were identified using an integrated statis-tical method previously described [50]. Briefly, two
independent tests—theT-test and the log2 median ratio
test—were performed. For each test, an empirical
distri-bution of the null hypothesis that the means of the gene expression levels are not different was estimated by random permutations of the samples. For each gene,
adjusted p-value was computed by performing a
two-tailed test using the empirical distributions. The two
sets of adjusted p-values were combined to compute
the overall adjusted p-values using Stouffer’s method
[67]. In addition, to determine the cutoff value of fold changes, we computed fold changes of randomly per-muted samples and fitted a Gaussian distribution to the random fold changes. The 2.5 percentile (i.e.,the level of significanceα= 0.05 in the two-tailed test) was calculated to be less than 1.4. Thus, the DEGs were selected based on the criteria that the overallpis less than 0.05 and that the absolute fold-change is larger than 1.4. Finally, to iden-tify GOBPs or major pathways represented by the DEGs, the enrichment analysis was performed using the DAVID software [68]. Specifically enriched cellular processes between up- and down-regulation were selected with
p< 0.05. Bar graphs were used to represent the level
of significance of each cellular process with enrichment score (-log10P).
Identification of key transcription factors (TFs) regulating DEGs
To identify key TFs, 278,346 TF-target interaction data points for 350 TFs were collected from public databases including TRED [17], EEDB [18], mSigDB [19], Amadeus [20], bZIPDB [21], and OregAnno [22].
The targets of each TF (TFi) were counted among the
up-or down-regulated DEGs (e.g., nDEG targets of TFi). The
same number of genes as up- or down-regulated DEGs were then randomly sampled from the whole genome
and the target of TFi in the randomly sampled genes
was counted. This procedure was repeated 100,000 times. Next, an empirical distribution (null hypothesis distribution) of the 100,000 counts of random targets
of TFi was generated. For the number of targets of
TFi, the probability (P) that the actual count of
tar-gets of TFi in the DEGs can be observed by chance
was computed using a one-tailed test with the empirical
distribution. The P values of TFi for up- and
down-regulated DEGs were then combined using Stouffer’s
method [67]. The same procedure was repeated for all TFs. Finally, eight TFs whose targets were
signi-ficantly (combined p< 0.01) enriched by the DEGs
were selected.
Hierarchical clustering of DEGs and differentially expressed proteins (DEPs)
From the comparisons of 4 h versus 0 h and 24 h versus 0 h, we identified a total of 1,695 DEGs. We performed hierarchical clustering using Euclidean distance as the dissimilarity measure and the average linkage method: 4 clusters (Clusters 1-4) for DEGs that were up-regulated and 3 clusters (Clusters 5-7) for DEGs that were down-regulated (see heat maps in Figure 1B). The same clus-tering approach was applied in categorization of up- and down-regulated DEPs.
Network model reconstruction
To reconstruct a sub-network describing regulatory tar-get cellular processes by 5 key TFs in PDGF-perturbed pBSMCs, we first selected 255 target genes (from the 1,695 DEGs) of the 5 TFs, which are involved in 8 enriched cellu-lar processes. We then built a network model describing the key TF-target interactions and protein-protein interac-tions among the targets. The TF-target interacinterac-tions and protein-protein interactions of the 255 target genes and 5 key TFs were obtained from six databases: TRED [17], EEDB [18], mSigDB [19], Amadeus [20], bZIPDB [21], and OregAnno [22], for TF-target interactions, and HPRD [69], BioGRID [70], STRING [71] and KEGG [72] for proteprotein interactions. We downloaded all proteproteproteprotein in-teractions (PPIs) in HPRD, BioGRID, STRING, and KEGG and combined information from the four databases into one list. During this process, we converted protein IDs used in each database into Entrez IDs, converted directed PPIs from the KEGG pathway database into undirected PPIs, to be compatible with undirected PPIs obtained from the three databases, and generated a list of non-redundant in-teractions by removing redundant PPIs (i.e. multiple inter-actions) in the four databases. Also, by converting directed PPIs into undirected ones, the PPIs obtained from the data-bases should not be conflicting with each other. All these procedures were implemented in MATLAB. We then used Cytoscape version 2.8.2 to display PPIs. The nodes in the network with the same GOBPs [73] and KEGG pathway annotations [72] were arranged and grouped into the same network module. To quantitatively assess the regulatory potential of each key TF to 8 functional modules, we computed the fold enrichment score (FES) defined by (the number of target genes within a module)/(the total number of genes within the module)/(the total number of target genes in the network)/(the total number of genes in the network). This is a modified version of fold enrichment score from DAVID software [68].
Protein preparation, separation, and tryptic digestion for mass spectrometric analysis
buffer. Protein concentrations were determined using Micro BCA assay (Thermo Fisher Scientific, Rockford,
IL) according to the manufacturer’s protocol. Proteins
extracted from SILAC-labeled pBSMCs were mixed in
equal amounts. 40 μg of protein mixture was resolved
on a 10% SDS-PAGE gel and visualized with Coomassie Blue R-250 staining solution. Each gel lane was excised into 10 slices of similar size and cut into approximately
1 mm3particles prior to in-gel reduction, alkylation, and
tryptic digestion as previously described [74]. Tryptic peptides were extracted, dried down in a SpeedVac (Thermo Savant, Holbrook, NY), and stored at -80°C until mass spectrometric analysis.
Mass spectrometric analysis
Mass spectrometric analysis was conducted essentially as described [75]. Briefly, tryptic peptides were redissolved with 10μL 1.5% acetic acid and 7.5% acetonitrile solution.
5 μL samples were analyzed by online C18 nanoflow
reverse-phase HPLC (Eksigent nanoLC · 2D™, Dublin, CA)
connected to an LTQ Orbitrap XL mass spectrometer (Thermo Fisher Scientific, Waltham, MA) essentially as described [76,77]. Briefly, samples were loaded onto
an in-house packed C18column (Magic C18, 5μm, 200Å)
(Michrom Bioresources, Auburn, CA) with 15 cm length
and 100 μm inner diameter, and separated at about
200 nl/min with 60 min linear gradients from 5 to 35% acetonitrile in 0.2% formic acid. Survey spectra were acquired in the Orbitrap analyzer with the reso-lution set to a value of 30,000. Lock mass option was enabled in all measurements and decamethylcyclopen-tasiloxane background ions (at m/z 371.10123) were used for real-time internal calibration. Up to five of the most intense ions per cycle were fragmented and analyzed in the linear ion trap.
Protein identification and quantification
For protein identification and quantification, raw mass spectrometric data were analyzed with MaxQuant software (version 1.0.13.13) [78]. The parameters were set as follows. In the Quant module, SILAC triplets was selected; oxidation (M) and acetyl (Protein N-term) were set as variable modification; carbamido-methyl (C) was set as fixed modification; concatenated IPI human database (version 3.52) (74,190 forward sequences and 74,190 reverse sequences) was used for database searching; all other parameters were default. Tandem mass spectra were searched by Mascot (version 2.2.0.4) (Matrix Science, Boston, MA). In the Identify module, all parameters were default, except that maximal peptide posterior error probability was set as 0.05. False discovery rates for protein and peptide identifications were both set at 0.01.
Identification of DEPs
Quality assessment of the SILAC datasets was per-formed as described [79]. The statistical analysis of the SILAC data and the calculation of fold-change cutoff were the same as for the microarray data. The DEPs were identified using the following criteria: 1) overall
P values are less than 0.05; 2) proteins quantified in
at least two replicates; and 3) absolute fold changes larger than 1.3.
Assessment of correlation between PDGF perturbed transcriptome and proteome
Within each time point, correlation between normalized probe and SILAC intensity of genes and corresponding gene products product were estimated for the genes that
had protein intensity data by Spearman’s rank correlation
analysis. Relationships between fold change of DEGs and SILAC ratio of corresponding DEPs at 4 h and 24 h were estimated by the same method.
Target validation by real-time RT-PCR
pBSMCs were seeded at a density of 100,000 cells per well in a 6-well plate, cultured for 24 h, serum starved for an additional 24 h, and then treated with 25 ng/ml (1 nM) PDGF-BB (R&D Systems, Minneapolis, MN) for the indicated times. After the treatment, cells were har-vested in 500μl Trizol reagent (Invitrogen, Carlsbad, CA). Total RNA was reverse transcribed using the iScript cDNA synthesis reagent (Bio-Rad, Hercules, CA) and cDNAs were amplified using gene-specific primers (Life
Technolo-gies, Grand Island, NY) according to the manufacturer’s
instructions. In selected experiments cDNAs from a mouse model of bladder injury [28] were analyzed similarly. Briefly, injury was created in wild type female CD-1 mice, in which the proximal urethra was ligated with 6-0 nylon suture. Bladder distension injury was achieved by urine production by the mouse over a 24 h period. At the end of the experiment, tissues were harvested for analysis. Bladder smooth muscle was separated from the urothelium, prior to isolation of RNA and cDNA synthesis. All procedures were approved by the Institutional Animal Care and Use Committee. In each case relative abundance of each gene was normalized to levels of the housekeeping gene GAPDH. Quantification of gene expression was
carried out using the 2-ΔΔCt method.
Immunoblot analysis
antibodies (1:1000 dilution) overnight at 4°C. After washing, membranes were incubated with species-specific HRP-conjugated secondary antibodies, and proteins were visualized following incubation with SuperSignal WestPico chemiluminescence reagent (Thermo Fisher Scientific, Rockford, IL) and exposure of membranes to X-ray film.
Cell biomass and viability assays
Cell biomass was assessed using the crystal violet assay essentially as described [25]. Cells were fixed in 1% glutaraldehyde for 15 min and then in 0.5% (w/v) crystal violet solution for an additional 15 min. The plates were
washed and dried overnight. 250 μl of Sorenson’s
solu-tion was added to each well and incubated for 15 min. Then the solution was transferred to a 96-well plate and the absorbance at 570 nm was measured using a FLUOstar Omega microplate reader (BMG LabTech, Durham, NC). To determine viability, cells were incubated in medium supplemented with 10% AlamarBlue reagent for 2 h at
37°C, 5% CO2. Relative fluorescence intensity of medium
was measured as described [81].
Transwell migration assays
After a 24 h serum depletion period, 1 × 10⁶ pBSMCs
were nucleofected with 1 μg pmaxGFP (Amaxa, Inc.,
nucleofection program A033) and ~1.6 × 10⁵cells seeded
in each of four transwell FluoroBlok™inserts (BD
Biosci-ences, San Jose, CA) containing 500 μL serum-free
SMCM with JNK inhibitor, MYC inhibitor or vehicle (DMSO). The transwells were placed in the corresponding wells of a companion plate containing 1 ml/well serum-free SMCM. 25 ng/ml PDGF-BB was added 60 min later to the SMCM in the bottom wells. The remaining cells were seeded in two wells of a six-well plate for confirm-ation of transfection efficiency. At the indicated times after adding PDGF, transwell inserts were rinsed three times with PBS for 5 min and then transferred to a glass-bottomed 24-well black plate (Greiner, Monroe, NC). GFP fluorescence signal was measured with a FLUOstar Omega microplate reader (BMG LabTech) using the bottom optic, with excitation and emission wavelengths of 485 nm and 520 nm, respectively.
DIAPH3 functional assay
1 × 10⁶ pBSMCs were nucleofected as described above
with 1 μg pmaxGFP and 1μM DIAPH3 siRNA or
non-targeting control. 10,000 cells from each nucleofection mix were seeded onto sterile coverslips in 6-well plates for 24 h. Following a 24 h serum depletion, cells were treated without or with 1 nM PDGF-BB and harvested after 24 h for assessment of lamellipodia formation. Briefly, cells were fixed for 10 min in 4% paraformalde-hyde with gentle shaking, followed by 2 washes for 5 min each with PBS. Cells were permeabilized with 0.1%
Triton X-100 in PBS for 5-10 min, washed and incu-bated in blocking buffer (PBS containing 1% goat serum and 0.2% BSA) for an hour, with gentle shaking. Cells were washed 3 times with 0.2% BSA/PBS for 5 min each and incubated in a 1:1000 solution of rhodamine-phalloidin (Invitrogen, Grand Island, NY) in 0.2% BSA/PBS for 1 h with gentle shaking. Finally, cells were washed 3 times with PBS for 5 min each and the coverslips mounted onto slides in Vectashield mounting medium containing DAPI. The slides were allowed to dry overnight at 4°C prior to imaging on a Zeiss Axioplan 2 microscope. Cells were scored as lamellipodia-positive or negative by two independent observers (A.R and S.M.), from three inde-pendent trials, using at least 50 cells per condition, and data combined for determination of statistical significance.
Statistical analysis
In most cases, comparisons between experimental groups
were performed using Student’s t-test. P values are
indi-cated in figure legends. Real-time RT-PCR data between conditions were analyzed using the non-parametric Mann-Whitney test. For comparison of lamellipodia for-mation data were analyzed using a linear model with fixed conditions (siDIAPH3/siControl, PDGF+/Vehicle, Rater, Experimental Run) and interaction terms between PDGF and condition, and Experimental Run and Rater were fit to the ratio of lamellipodium-positive cells to total number of cells. The diagnostic plots were examined. No transformations were necessary to the outcome variable, and no violations of model assumptions were observed on the plots. The Tukey Honestly Significant difference test was used to determine statistical signifi-cance of the difference in cell ratios between each pair of conditions. Statistical analyses were performed using R statistical software packages base (http://www.R-project. org/) and multcomp [82].
Supporting data
The datasets supporting the results of this article are avail-able in the Gene Expression Omnibus (GSE52488, http:// www.ncbi.nlm.nih.gov/geo/query/acc.cgi?acc=GSE52488) and in the ProteomeXchange Consortium (http://proteome central.proteomexchange.org) via the PRIDE partner repository [83], with the dataset identifier PXD000624 and doi:10.6019/PXD000624).
Additional files
treated with PDGF for the indicated times (in h) were subjected to immunoblot analysis using the specified antibodies. Data are representative of at least 2 trials.
Additional file 2: Figure S2.Workflow for the quantitative
transcriptomics and proteomics analyses of pBSMCs in response to PDGF treatment. pBSMCs were triplex SILAC labeled and treated with PDGF for 0, 4, and 24 h. RNAs were isolated from each population of pBSMCs and analyzed on Human Gene 1.0 ST arrays. Proteins were extracted from each population of pBSMCs and mixed at a 1:1:1 (w/w/w) ratio. The protein mixture was analyzed by gel-enhanced liquid chromatography-tandem mass spectrometry (GeLC-MS/MS). The transcriptomics and proteomics datasets were analyzed to construct a putative network model for the molecules regulated by PDGF in pBSMCs.
Additional file 3: Figure S3.Quality assessment of microarray data. (A)The histogram shows density of the microarray data. As shown in the figure there are no significant differences between the distribution of 12 samples in terms of shape and range after normalization with quantile method, demonstrating no problems with high level of background intensity and signal saturation.(B)The scatter plots illustrate reproducibility based on inter- and intra-group variations of the arrays. The diagonal shows the intensity distribution in each array. All pairwise correlation coefficients between samples were > 0.98. The Pearson correlation coefficient within groups was higher (>0.995) than those between groups.
Additional file 4: Table S1.A total 1,695 DEGs perturbed by PDGF stimulation.
Additional file 5: Figure S4.Representative mass spectra for triplex SILAC quantification.(A)and(B)show a trio of SILAC peptides derived from hippocalcin-like protein 1 (HPCAL1), which was significantly upregulated by PDGF treatment in two-dimensional (2D) and three-dimensional (3D) modes, respective.(C)and(D)show a trio of SILAC peptides derived fromβ-type PDGF receptor (PDGFRB), which was significantly downregulated by PDGF treatment in 2D and 3D modes, respective. In the MaxQuant-generated 3D pictures, the SILAC peptide trios were shown as 3D objects inm/z, elution time, and signal intensity space.
Additional file 6: Table S2.241 DEPs perturbed in response to PDGF treatment.
Additional file 7: Figure S5.Overall correlation between the proteome and transcriptome. Relationship between PDGF perturbed protein and gene expression. Correlations between SILAC intensities and normalized probe intensities at each time point were estimated by Spearman’s rank correlation analysis to determine the correlation between all identified genes by microarray analysis and proteins by SILAC-based proteomics analysis.
Additional file 8: Table S3.40 common mRNA and protein species in response to PDGF treatment.
Additional file 9: Figure S6.Confirmation of JNK and MYC inhibitor efficacy.(A)Nuclear extracts prepared from pBSMC treated with PDGF for various time periods were assessed for DNA binding activity of MYC using a transcription factor ELISA. Nuclear extract from Jurkat cells was included as a positive control.(B)TF ELISA depicting a reduction in DNA-binding function of MYC in nuclear extracts prepared from pBSMC pre-treated for an hour with 32μM MYC inhibitor followed by stimulation with PDGF for 2 hours.(C)Immunoblot confirming efficacy of the JNK inhibitor as evidenced by lack of c-Jun phosphorylation in pBSMC pre-treated for an hour with the inhibitor, followed by exposure to PDGF for 4 h or 24 h.
Abbreviations
AP-1:Activator Protein 1; bioGRID: Biological General Repository for Interaction Datasets; BSA: Bovine Serum Albumin; bZIPDB: Basic region-leucine zipper transcription factor database; CXCL12: Chemokine (C-X-C motif) ligand 12, also known as stromal cell-derived factor 1; CYR61: Cysteine-rich, angiogenic inducer, 61; DAPI: 4',6-diamidino-2-phenylindole; DAVID: Database for Annotation, Visualization and Integrated Discovery; DEG: Differentially Expressed Gene; DEP: Differentially Expressed Protein; DIAPH3: Diaphanous-related formin 3; DMSO: Dimethylsulfoxide;
EEDB: EdgeExpress database; FDR: False Discovery Rate; FES: Fold Enrichment Score; GAPDH: Glyceraldehyde-3-phosphate dehydrogenase; GDF15: Growth and Differentiation Factor 15; GFP: Green Fluorescent Protein; GOBP: Gene Ontology biological processes; HMOX-1: Heme Oxygenase-1; HPLC: High Performance Liquid Chromatography; HPRD: Human Protein Reference Database; JNKi: JNK inhibitor, SP600125; KEGG: Kyoto Encyclopedia of Genes and Genomes; mSigDB: Molecular signatures database; MRFT-A/B: Myocardin-related transcription factor-A/B; MYCi: MYC inhibitor, 10058-F4; NFAT: Nuclear Factor of Activated T-cells; pBSMC: Primary bladder smooth muscle cell; PDGF-BB: Platelet-derived growth factor, BB isoform; PDGFR: Platelet-derived growth factor receptor; PPI: Protein-protein interaction; RT-PCR: Reverse transcription polymerase chain reaction; SDS-PAGE: Sodium dodecyl sulfate polyacrylamide gel electrophoresis; SILAC: Stable Isotope Labeling of Amino acids in Cell Culture; SMC: Smooth muscle cell; STRING: Search Tool for the Retrieval of Interacting Genes/ proteins; TF: Transcription factor; TRED: Transcriptional Regulatory Element Database; USF1/2: Upstream regulatory factor 1/2.
Competing interests
The authors declare that they have no competing interests.
Authors’contributions
WY performed mass spectrometry and analysis of proteomics data; AR conducted validation assays and data analysis; SY performed integration analysis on transcriptomic and proteomic datasets as well as network modeling and construction; HJ assisted with transformation and analysis of transcriptomic and proteomic datasets; SM performed in vitro assays; MDM assisted with validation assays; TL performed statistical analysis; JK participated in integration and network analysis; DH supervised integration analysis, network modeling and construction and assisted with interpretation. MRF conceived of the study and wrote the manuscript; RMA conceived of the study, performed validation assays and wrote the manuscript. All authors read and approved the final manuscript.
Acknowledgements
We thank members of the Urological Diseases Research Center at Boston Children’s Hospital and the Cancer Biology Program at Cedars-Sinai Medical Center for helpful discussions, and Jiyoung Choi for technical assistance. We also thank the Proteomics Center at Boston Children’s Hospital for assistance of mass spectrometric analysis. This study was supported by NIH P50 DK65298 (M.R.F), R01 DK087806 (M.R.F) and R01 DK077195 (R.M.A). Microarray data were generated by the Boston Children’s Hospital Intellectual and Developmental Disabilities Research Center (IDDRC) Microarray Core Facility. The IDDRC is supported by NIH P30 HD18655.
Author details
1Cancer Biology Program, Samuel Oschin Comprehensive Cancer Institute,
Cedars-Sinai Medical Center, Los Angeles, CA 90048, USA.2Departments of Surgery and Biomedical Sciences, Cedars-Sinai Medical Center, Los Angeles, CA 90048, USA.3Urological Diseases Research Center, Boston Children’s Hospital, Boston, MA 02115, USA.4Department of Surgery, Harvard Medical School, Boston, MA 02115, USA.5School of Interdisciplinary Bioscience and Bioengineering, POSTECH, Pohang, Republic of Korea.6Clinical Research Center, Boston Children’s Hospital, Boston, MA 02115, USA.7Center for Systems Biology of Plant Senescence and Life History, Institute for Basic Science, DGIST, Daegu 711-873, Republic of Korea.8Urological Diseases Research Center, John F. Enders Research Laboratories, Boston Children’s Hospital, Rm 1061.1, Boston, 300 Longwood Avenue, Boston, MA 02115, USA.
Received: 14 May 2014 Accepted: 23 June 2014 Published: 1 August 2014
References
1. Donovan J, Abraham D, Norman J:Platelet-derived growth factor signaling in mesenchymal cells.Front Biosci (Landmark Ed)2013, 18:106–119.
2. Andrae J, Gallini R, Betsholtz C:Role of platelet-derived growth factors in physiology and medicine.Genes Dev2008,22:1276–1312.
4. Ito I, Fixman ED, Asai K, Yoshida M, Gounni AS, Martin JG, Hamid Q: Platelet-derived growth factor and transforming growth factor-beta modulate the expression of matrix metalloproteinases and migratory function of human airway smooth muscle cells.Clin Exp Allergy2009, 39:1370–1380.
5. Ramachandran A, Ranpura SA, Gong EM, Mulone M, Cannon GM Jr, Adam RM: An Akt- and Fra-1-dependent pathway mediates platelet-derived growth factor-induced expression of thrombomodulin, a novel regulator of smooth muscle cell migration.Am J Pathol2010,177:119–131.
6. Simeone-Penney MC, Severgnini M, Rozo L, Takahashi S, Cochran BH, Simon AR:PDGF-induced human airway smooth muscle cell proliferation requires STAT3 and the small GTPase Rac1.Am J Physiol Lung Cell Mol Physiol
2008,294:L698–L704.
7. Deaton RA, Gan Q, Owens GK:Sp1-dependent activation of KLF4 is required for PDGF-BB-induced phenotypic modulation of smooth muscle.Am J Physiol Heart Circ Physiol2009,296:H1027–H1037.
8. Malabanan KP, Sheahan AV, Khachigian LM:Platelet-derived growth factor-BB mediates cell migration through induction of activating transcription factor 4 and tenascin-C.Am J Pathol2012,180:2590–2597.
9. Lee MY, Garvey SM, Baras AS, Lemmon JA, Gomez MF, Schoppee Bortz PD, Daum G, LeBoeuf RC, Wamhoff BR:Integrative genomics identifies DSCR1 (RCAN1) as a novel NFAT-dependent mediator of phenotypic modulation in vascular smooth muscle cells.Hum Mol Genet2010, 19:468–479.
10. Shirvani SM, Mookanamparambil L, Ramoni MF, Chin MT:Transcription factor CHF1/Hey2 regulates the global transcriptional response to platelet-derived growth factor in vascular smooth muscle cells.
Physiol Genomics2007,30:61–68.
11. Soskic V, Gorlach M, Poznanovic S, Boehmer FD, Godovac-Zimmermann J: Functional proteomics analysis of signal transduction pathways of the platelet-derived growth factor beta receptor.Biochemistry1999, 38:1757–1764.
12. Godovac-Zimmermann J, Soskic V, Poznanovic S, Brianza F:Functional proteomics of signal transduction by membrane receptors.
Electrophoresis1999,20:952–961.
13. Saridaki A, Panayotou G:Identification of growth factor-regulated proteins using 2D electrophoresis and mass spectrometry.Growth Factors2005, 23:223–232.
14. MacLellan DL, Steen H, Adam RM, Garlick M, Zurakowski D, Gygi SP, Freeman MR, Solomon KR:A quantitative proteomic analysis of growth factor-induced compositional changes in lipid rafts of human smooth muscle cells.Proteomics2005,5:4733–4742.
15. Nagano K, Akpan A, Warnasuriya G, Corless S, Totty N, Yang A, Stein R, Zvelebil M, Stensballe A, Burlingame A, Waterfield M, Cramer R, Timms JF, Naaby-Hansen S:Functional proteomic analysis of long-term growth factor stimulation and receptor tyrosine kinase coactivation in Swiss 3T3 fibroblasts.Mol Cell Proteomics2012,11:1690–1708.
16. Chae S, Ahn BY, Byun K, Cho YM, Yu MH, Lee B, Hwang D, Park KS:A systems approach for decoding mitochondrial retrograde signaling pathways.Sci Signal2013,6:rs4.
17. Zhao F, Xuan Z, Liu L, Zhang MQ:TRED: a Transcriptional Regulatory Element Database and a platform for in silico gene regulation studies.
Nucleic Acids Res2005,33:D103–D107.
18. Severin J, Waterhouse AM, Kawaji H, Lassmann T, van Nimwegen E, Balwierz PJ, de Hoon MJ, Hume DA, Carninci P, Hayashizaki Y, Suzuki H, Daub CO, Forrest AR:FANTOM4 EdgeExpressDB: an integrated database of promoters, genes, microRNAs, expression dynamics and regulatory interactions.Genome Biol2009,10:R39.
19. Subramanian A, Tamayo P, Mootha VK, Mukherjee S, Ebert BL, Gillette MA, Paulovich A, Pomeroy SL, Golub TR, Lander ES, Mesirov JP:Gene set enrichment analysis: a knowledge-based approach for interpreting genome-wide expression profiles.Proc Natl Acad Sci U S A2005, 102:15545–15550.
20. Linhart C, Halperin Y, Shamir R:Transcription factor and microRNA motif discovery: the Amadeus platform and a compendium of metazoan target sets.Genome Res2008,18:1180–1189.
21. Ryu T, Jung J, Lee S, Nam HJ, Hong SW, Yoo JW, Lee DK, Lee D:bZIPDB: a database of regulatory information for human bZIP transcription factors.
BMC Genomics2007,8:136.
22. Griffith OL, Montgomery SB, Bernier B, Chu B, Kasaian K, Aerts S, Mahony S, Sleumer MC, Bilenky M, Haeussler M, Griffith M, Gallo SM, Giardine B,
Hooghe B, Van Loo P, Blanco E, Ticoll A, Lithwick S, Portales-Casamar E, Donaldson IJ, Robertson G, Wadelius C, De Bleser P, Vlieghe D, Halfon MS, Wasserman W, Hardison R, Bergman CM, Jones SJ:ORegAnno: an open-access community-driven resource for regulatory annotation.
Nucleic Acids Res2008,36:D107–D113.
23. Schwanhausser B, Busse D, Li N, Dittmar G, Schuchhardt J, Wolf J, Chen W, Selbach M:Global quantification of mammalian gene expression control.
Nature2011,473:337–342.
24. Park JM, Adam RM, Peters CA, Guthrie PD, Sun Z, Klagsbrun M, Freeman MR: AP-1 mediates stretch-induced expression of HB-EGF in bladder smooth muscle cells.Am J Physiol1999,277:C294–C301.
25. Nguyen HT, Adam RM, Bride SH, Park JM, Peters CA, Freeman MR: Cyclic stretch activates p38 SAPK2-, ErbB2-, and AT1-dependent signaling in bladder smooth muscle cells.Am J Physiol Cell Physiol2000, 279:C1155–C1167.
26. Adam RM, Eaton SH, Estrada C, Nimgaonkar A, Shih SC, Smith LE, Kohane IS, Bagli D, Freeman MR:Mechanical stretch is a highly selective regulator of gene expression in human bladder smooth muscle cells.Physiol Genomics
2004,20:36–44.
27. Yang R, Amir J, Liu H, Chaqour B:Mechanical strain activates a program of genes functionally involved in paracrine signaling of angiogenesis.
Physiol Genomics2008,36:1–14.
28. Ramachandran A, Gong EM, Pelton K, Ranpura SA, Mulone M, Seth A, Gomez P 3rd, Adam RM:FosB regulates stretch-induced expression of extracellular matrix proteins in smooth muscle.Am J Pathol2011, 179:2977–2989.
29. Yin X, Giap C, Lazo JS, Prochownik EV:Low molecular weight inhibitors of Myc-Max interaction and function.Oncogene2003,22:6151–6159. 30. Pellegrin S, Mellor H:The Rho family GTPase Rif induces filopodia through
mDia2.Curr Biol2005,15:129–133.
31. Gupton SL, Eisenmann K, Alberts AS, Waterman-Storer CM:mDia2 regulates actin and focal adhesion dynamics and organization in the lamella for efficient epithelial cell migration.J Cell Sci2007, 120:3475–3487.
32. Yang C, Czech L, Gerboth S, Kojima S, Scita G, Svitkina T:Novel roles of formin mDia2 in lamellipodia and filopodia formation in motile cells.
PLoS Biol2007,5:e317.
33. Demicheva E, Hecker M, Korff T:Stretch-induced activation of the transcription factor activator protein-1 controls monocyte chemoattractant protein-1 expression during arteriogenesis.Circ Res2008,103:477–484. 34. Kumar A, Knox AJ, Boriek AM:CCAAT/enhancer-binding protein and
activator protein-1 transcription factors regulate the expression of interleukin-8 through the mitogen-activated protein kinase pathways in response to mechanical stretch of human airway smooth muscle cells.
J Biol Chem2003,278:18868–18876.
35. Adam RM, Roth JA, Cheng HL, Rice DC, Khoury J, Bauer SB, Peters CA, Freeman MR:Signaling through PI3K/Akt mediates stretch and PDGF-BB-dependent DNA synthesis in bladder smooth muscle cells.
J Urol2003,169:2388–2393.
36. Matsumae H, Yoshida Y, Ono K, Togi K, Inoue K, Furukawa Y, Nakashima Y, Kojima Y, Nobuyoshi M, Kita T, Tanaka M:CCN1 knockdown suppresses neointimal hyperplasia in a rat artery balloon injury model.Arterioscler Thromb Vasc Biol2008,28:1077–1083.
37. Nemenoff RA, Simpson PA, Furgeson SB, Kaplan-Albuquerque N, Crossno J, Garl PJ, Cooper J, Weiser-Evans MC:Targeted deletion of PTEN in smooth muscle cells results in vascular remodeling and recruitment of progenitor cells through induction of stromal cell-derived factor-1alpha.Circ Res2008, 102:1036–1045.
38. Harris DA, Zhao Y, LaPar DJ, Emaminia A, Steidle JF, Stoler M, Linden J, Kron IL, Lau CL:Inhibiting CXCL12 blocks fibrocyte migration and differentiation and attenuates bronchiolitis obliterans in a murine heterotopic tracheal transplant model.J Thorac Cardiovasc Surg2013, 145:854–861.
39. Chaqour B, Whitbeck C, Han JS, Macarak E, Horan P, Chichester P, Levin R: Cyr61 and CTGF are molecular markers of bladder wall remodeling after outlet obstruction.Am J Physiol Endocrinol Metab2002,283:E765–E774. 40. Seidel P, Goulet S, Hostettler K, Tamm M, Roth M:DMF inhibits PDGF-BB
induced airway smooth muscle cell proliferation through induction of heme-oxygenase-1.Respir Res2010,11:145.
TL, Duckers HJ:PDGF-induced migration of vascular smooth muscle cells is inhibited by heme oxygenase-1 via VEGFR2 upregulation and subsequent assembly of inactive VEGFR2/PDGFRbeta heterodimers.
Arterioscler Thromb Vasc Biol2012,32:1289–1298.
42. Minamino T, Christou H, Hsieh CM, Liu Y, Dhawan V, Abraham NG, Perrella MA, Mitsialis SA, Kourembanas S:Targeted expression of heme oxygenase-1 prevents the pulmonary inflammatory and vascular responses to hypoxia.Proc Natl Acad Sci U S A2001,98:8798–8803. 43. Luo X, Sawadogo M:Antiproliferative properties of the USF family of
helix-loop-helix transcription factors.Proc Natl Acad Sci U S A1996, 93:1308–1313.
44. Choe C, Chen N, Sawadogo M:Decreased tumorigenicity of
c-Myc-transformed fibroblasts expressing active USF2.Exp Cell Res2005, 302:1–10.
45. Hock TD, Nick HS, Agarwal A:Upstream stimulatory factors, USF1 and USF2, bind to the human haem oxygenase-1 proximal promoter in vivo and regulate its transcription.Biochem J2004,383:209–218.
46. Kim J, Zarjou A, Traylor AM, Bolisetty S, Jaimes EA, Hull TD, George JF, Mikhail FM, Agarwal A:In vivo regulation of the heme oxygenase-1 gene in humanized transgenic mice.Kidney Int2012,82:278–291.
47. Shabsigh A, Hayek OR, Weiner D, Saidi J, Kaplan SA, Kiss A, Burchardt M, Buttyan R, Levin RM:Acute increase in blood flow to the rat bladder subsequent to partial bladder outlet obstruction.Neurourol Urodyn2000, 19:195–206. discussion 206-198.
48. Yohannes E, Chang J, Christ GJ, Davies KP, Chance MR:Proteomics analysis identifies molecular targets related to diabetes mellitus-associated bladder dysfunction.Mol Cell Proteomics2008,7:1270–1285.
49. Kirschner-Hermanns R, Daneshgari F, Vahabi B, Birder L, Oelke M, Chacko S: Does diabetes mellitus-induced bladder remodeling affect lower urinary tract function? ICI-RS 2011.Neurourol Urodyn2012,31:359–364. 50. Fan J, Zeller K, Chen YC, Watkins T, Barnes KC, Becker KG, Dang CV, Cheadle C:
Time-dependent c-Myc transactomes mapped by Array-based nuclear run-on reveal transcriptional modules in human B cells.PLoS One2010, 5:e9691.
51. Young KG, Copeland JW:Formins in cell signaling.Biochim Biophys Acta
1803,2010:183–190.
52. Staus DP, Blaker AL, Taylor JM, Mack CP:Diaphanous 1 and 2 regulate smooth muscle cell differentiation by activating the myocardin-related transcription factors.Arterioscler Thromb Vasc Biol2007,27:478–486. 53. Liu P, Ying Y, Ko YG, Anderson RG:Localization of platelet-derived growth
factor-stimulated phosphorylation cascade to caveolae.J Biol Chem1996, 271:10299–10303.
54. Stehr M, Adam RM, Khoury J, Zhuang L, Solomon KR, Peters CA, Freeman MR: Platelet derived growth factor-BB is a potent mitogen for rat ureteral and human bladder smooth muscle cells: dependence on lipid rafts for cell signaling.J Urol2003,169:1165–1170.
55. Pato C, Stetzkowski-Marden F, Gaus K, Recouvreur M, Cartaud A, Cartaud J: Role of lipid rafts in agrin-elicited acetylcholine receptor clustering.
Chem Biol Interact2008,175:64–67.
56. Valensin S, Paccani SR, Ulivieri C, Mercati D, Pacini S, Patrussi L, Hirst T, Lupetti P, Baldari CT:F-actin dynamics control segregation of the TCR signaling cascade to clustered lipid rafts.Eur J Immunol2002, 32:435–446.
57. Haglund K, Ivankovic-Dikic I, Shimokawa N, Kruh GD, Dikic I:Recruitment of Pyk2 and Cbl to lipid rafts mediates signals important for actin reorganization in growing neurites.J Cell Sci2004,117:2557–2568. 58. Calvo F, Ege N, Grande-Garcia A, Hooper S, Jenkins RP, Chaudhry SI,
Harrington K, Williamson P, Moeendarbary E, Charras G, Sahai E: Mechanotransduction and YAP-dependent matrix remodelling is required for the generation and maintenance of cancer-associated fibroblasts.Nat Cell Biol2013,15:637–646.
59. Danovi SA, Rossi M, Gudmundsdottir K, Yuan M, Melino G, Basu S: Yes-associated protein (YAP) is a critical mediator of c-Jun-dependent apoptosis.Cell Death Differ2008,15:217–219.
60. Xiao W, Wang J, Ou C, Zhang Y, Ma L, Weng W, Pan Q, Sun F: Mutual interaction between YAP and c-Myc is critical for carcinogenesis in liver cancer.Biochem Biophys Res Commun2013, 439:167–172.
61. Xie C, Guo Y, Zhu T, Zhang J, Ma PX, Chen YE:Yap1 protein regulates vascular smooth muscle cell phenotypic switch by interaction with myocardin.J Biol Chem2012,287:14598–14605.
62. Soucek L, Whitfield JR, Sodir NM, Masso-Valles D, Serrano E, Karnezis AN, Swigart LB, Evan GI:Inhibition of Myc family proteins eradicates KRas-driven lung cancer in mice.Genes Dev2013,27:504–513. 63. Delmore JE, Issa GC, Lemieux ME, Rahl PB, Shi J, Jacobs HM, Kastritis E,
Gilpatrick T, Paranal RM, Qi J, Chesi M, Schinzel AC, McKeown MR, Heffernan TP, Vakoc CT, Bergsagel PL, Ghobrial IM, Richardson PG, Young RA, Hahn WC, Anderson KC, Kung AL, Bradner JE, Mitsiades CS:BET bromodomain inhibition as a therapeutic strategy to target c-Myc.Cell2011, 146:904–917.
64. Bandopadhayay P, Bergthold G, Nguyen B, Schubert S, Gholamin S, Tang Y, Bolin S, Schumacher SE, Zeid R, Masoud S, Yu F, Vue N, Gibson WJ, Paolella BR, Mitra SS, Cheshier S, Qi J, Liu KW, Wechsler-Reya RJ, Weiss WA, Swartling FJ, Kieran MW, Bradner JE, Beroukhim R, Cho YJ:BET-bromodomain inhibition of MYC-amplified Medulloblastoma.Clin Cancer Res2013, 20:912–925.
65. Gentleman RC, Carey VJ, Bates DM, Bolstad B, Dettling M, Dudoit S, Ellis B, Gautier L, Ge Y, Gentry J, Hornik K, Hothorn T, Huber W, Iacus S, Irizarry R, Leisch F, Li C, Maechler M, Rossini AJ, Sawitzki G, Smith C, Smyth G, Tierney L, Yang JY, Zhang Y:Bioconductor: open software development for computational biology and bioinformatics.Genome Biol2004,5:R80. 66. Bolstad BM, Irizarry RA, Astrand M, Speed TP:A comparison of
normalization methods for high density oligonucleotide array data based on variance and bias.Bioinformatics2003,19:185–193.
67. Hwang D, Rust AG, Ramsey S, Smith JJ, Leslie DM, Weston AD, de Atauri P, Aitchison JD, Hood L, Siegel AF, Bolouri H:A data integration
methodology for systems biology.Proc Natl Acad Sci U S A2005, 102:17296–17301.
68. da Huang W, Sherman BT, Lempicki RA:Systematic and integrative analysis of large gene lists using DAVID bioinformatics resources.Nat Protoc2009,4:44–57.
69. Peri S, Navarro JD, Kristiansen TZ, Amanchy R, Surendranath V, Muthusamy B, Gandhi TK, Chandrika KN, Deshpande N, Suresh S, Rashmi BP, Shanker K, Padma N, Niranjan V, Harsha HC, Talreja N, Vrushabendra BM, Ramya MA, Yatish AJ, Joy M, Shivashankar HN, Kavitha MP, Menezes M, Choudhury DR, Ghosh N, Saravana R, Chandran S, Mohan S, Jonnalagadda CK, Prasad CK,
et al:Human protein reference database as a discovery resource for proteomics.Nucleic Acids Res2004,32:D497–D501.
70. Stark C, Breitkreutz BJ, Reguly T, Boucher L, Breitkreutz A, Tyers M:BioGRID: a general repository for interaction datasets.Nucleic Acids Res2006, 34:D535–D539.
71. von Mering C, Huynen M, Jaeggi D, Schmidt S, Bork P, Snel B:STRING: a database of predicted functional associations between proteins.
Nucleic Acids Res2003,31:258–261.
72. Ogata H, Goto S, Sato K, Fujibuchi W, Bono H, Kanehisa M:KEGG: Kyoto Encyclopedia of Genes and Genomes.Nucleic Acids Res1999, 27:29–34.
73. Ashburner M, Ball CA, Blake JA, Botstein D, Butler H, Cherry JM, Davis AP, Dolinski K, Dwight SS, Eppig JT, Harris MA, Hill DP, Issel-Tarver L, Kasarskis A, Lewis S, Matese JC, Richardson JE, Ringwald M, Rubin GM, Sherlock G: Gene ontology: tool for the unification of biology. The Gene Ontology Consortium.Nat Genet2000,25:25–29.
74. Yang W, Di Vizio D, Kirchner M, Steen H, Freeman MR:Proteome scale characterization of human S-acylated proteins in lipid raft-enriched and non-raft membranes.Mol Cell Proteomics2010,9:54–70.
75. Yang W, Chung YG, Kim Y, Kim TK, Keay SK, Zhang CO, Ji M, Hwang D, Kim KP, Steen H, Freeman MR, Kim J:Quantitative proteomics identifies a beta-catenin network as an element of the signaling response to Frizzled-8 protein-related antiproliferative factor.Mol Cell Proteomics2011, 10:M110 007492.
76. Yang W, Cai Q, Lui VW, Everley PA, Kim J, Bhola N, Quesnelle KM, Zetter BR, Steen H, Freeman MR, Grandis JR:Quantitative proteomics analysis reveals molecular networks regulated by epidermal growth factor receptor level in head and neck cancer.J Proteome Res2010,9:3073–3082.
77. Dowal L, Yang W, Freeman MR, Steen H, Flaumenhaft R:Proteomic analysis of palmitoylated platelet proteins.Blood2011,118:e62–e73.
78. Cox J, Mann M:MaxQuant enables high peptide identification rates, individualized p.p.b.-range mass accuracies and proteome-wide protein quantification.Nat Biotechnol2008,26:1367–1372.
80. Adam RM, Mukhopadhyay NK, Kim J, Di Vizio D, Cinar B, Boucher K, Solomon KR, Freeman MR:Cholesterol sensitivity of endogenous and myristoylated Akt.Cancer Res2007,67:6238–6246.
81. Franck D, Gil ES, Adam RM, Kaplan DL, Chung YG, Estrada CR Jr, Mauney JR: Evaluation of silk biomaterials in combination with extracellular matrix coatings for bladder tissue engineering with primary and pluripotent cells.PLoS One2013,8:e56237.
82. Hothorn T, Bretz F, Westfall P:Simultaneous inference in general parametric models.Biom J2008,50:346–363.
83. Vizcaino JA, Cote RG, Csordas A, Dianes JA, Fabregat A, Foster JM, Griss J, Alpi E, Birim M, Contell J, O’Kelly, Schoenegger A, Ovelleiro D, Perez-Riverol Y, Reisinger F, Rios D, Wang R, Hermjakob H:The PRoteomics IDEntifications (PRIDE) database and associated tools: status in 2013.Nucleic Acids Res2013, 41:D1063–D1069.
doi:10.1186/s12964-014-0044-z
Cite this article as:Yanget al.:Integration of proteomic and
transcriptomic profiles identifies a novel PDGF-MYC network in human smooth muscle cells.Cell Communication and Signaling201412:44.
Submit your next manuscript to BioMed Central and take full advantage of:
• Convenient online submission
• Thorough peer review
• No space constraints or color figure charges
• Immediate publication on acceptance
• Inclusion in PubMed, CAS, Scopus and Google Scholar
• Research which is freely available for redistribution