C
H
A
P
T
E
R
Astrophysics and
Cosmology
CHAPTER-OPENING QUESTIONS—Guess now!
1.Until recently, astronomers expected the expansion rate of the universe would be decreasing. Why?
(a) Friction.
(b) The second law of thermodynamics.
(c) Gravity.
(d) The electromagnetic force.
2.The universe began expanding right at the beginning. How long will it continue to expand?
(a) Until it runs out of room.
(b) Until friction slows it down and brings it to a stop.
(c) Until all galaxies are moving at the speed of light relative to the center.
(d) Possibly forever.
I
n the previous Chapter, we studied the tiniest objects in the universe—the elementary particles. Now we leap to the grandest objects in the universe— stars, galaxies, and clusters of galaxies—plus the history and structure of the universe itself. These two extreme realms, elementary particles and the cosmos, are among the most intriguing and exciting subjects in science. And, surprisingly, these two extreme realms are related in a fundamental way, as was already hinted in Chapter 32.947
CONTENTS33–1 Stars and Galaxies
33–2 Stellar Evolution: Birth and Death of Stars,
Nucleosynthesis
33–3 Distance Measurements
33–4 General Relativity: Gravity and the Curvature of Space
33–5 The Expanding Universe: Redshift and Hubble’s Law
33–6 The Big Bang and the Cosmic Microwave Background
33–7 The Standard Cosmological Model: Early History of the Universe
33–8 Inflation: Explaining Flatness, Uniformity, and Structure
33–9 Dark Matter and Dark Energy
33–10 Large-Scale Structure of the Universe
33–11 Finallyp
33
This Hubble eXtreme Deep Field (XDF) photograph is of a very small part of the sky. It includes what may be the most distant galaxies observable by us (small red and green squares, and shown enlarged in the corners), with and 11.9, that already existed when the universe was about 0.4 billion years old. We see these galaxies as they appeared then, 13.4 billion years ago, which is when they emitted this light. The most distant galaxies were young and small and grew to become large galaxies by colliding and merging with other small galaxies.We examine the latest theories on how stars and galaxies form and evolve, including the role of
nucleosynthesis, as well as Einstein’s general theory of relativity which deals with gravity and curvature of space. We take a thorough look at the evidence for the expansion of the universe, and the Standard Model of the universe evolving from an initial Big Bang. We point out some unsolved problems, including the nature of dark matter and dark energy that make up most of our universe.
z L 8.8
Use of the techniques and ideas of physics to study the night sky is often referred to as astrophysics. Central to our present theoretical understanding of the universe (or cosmos) is Einstein’s general theory of relativitywhich represents our most complete understanding of gravitation. Many other aspects of physics are involved, from electromagnetism and thermodynamics to atomic and nuclear physics as well as elementary particles. General Relativity serves also as the foundation for modern cosmology, which is the study of the universe as a whole. Cosmology deals especially with the search for a theoretical framework to under-stand the observed universe, its origin, and its future. The questions posed by cosmology are profound and difficult; the possible answers stretch the imagina-tion. They are questions like “Has the universe always existed, or did it have a beginning in time?” Either alternative is difficult to imagine: time going back indefinitely into the past, or an actual moment when the universe began (but, then, what was there before?). And what about the size of the universe? Is it infinite in size? It is hard to imagine infinity. Or is it finite in size? This is also hard to imagine, for if the universe is finite, it does not make sense to ask what is beyond it, because the universe is all there is.
In the last 10 to 20 years, so much progress has occurred in astrophysics and cosmology that many scientists are calling recent work a “Golden Age” for cosmology. Our survey will be qualitative, but we will nonetheless touch on the major ideas. We begin with a look at what can be seen beyond the Earth.
33–1
Stars and Galaxies
According to the ancients, the stars, except for the few that seemed to move relative to the others (the planets), were fixed on a sphere beyond the last planet. The universe was neatly self-contained, and we on Earth were at or near its center. But in the centuries following Galileo’s first telescopic observations of the night sky in 1609, our view of the universe has changed dramatically. We no longer place ourselves at the center, and we view the universe as vastly larger. The distances involved are so great that we specify them in terms of the time it takes light to travel the given distance: for example,
The most common unit is the light-year(ly):
For specifying distances to the Sun and Moon, we usually use meters or kilo-meters, but we could specify them in terms of light seconds or minutes. The Earth–Moon distance is 384,000 km, which is 1.28 light-seconds. The Earth–Sun distance is or 150,000,000 km; this is equal to 8.3 light-minutes (it takes 8.3 min for light emitted by the Sun to reach us). Far out in our solar system, Pluto is about from the Sun, or † The nearest star to us, other than the Sun, is Proxima Centauri, about 4.2 ly away.
On a clear moonless night, thousands of stars of varying degrees of brightness can be seen, as well as the long cloudy stripe known as the Milky Way (Fig. 33–1). Galileo first observed, with his telescope, that the Milky Way is comprised of countless individual stars. A century and a half later (about 1750), Thomas Wright suggested that the Milky Way was a flat disk of stars extending to great distances in a plane, which we call the Galaxy(Greek for “milky way”).
6 * 10–4ly. 6 * 109km
1.50 * 1011m,
= 9.46 * 1015 m L 1013 km L 1016 m. 1ly = A2.998 * 108m兾sBA3.156 * 107s兾yrB 1 light-minute = A3.0 * 108m兾sB(60s) = 18 * 106km.
1 light-second = A3.0 * 108 m兾sB(1.0 s) = 3.0 * 108 m = 300,000 km;
948
CHAPTER 33 Astrophysics and Cosmology (a)(b)
†We can also say this is about 5 light-hours. FIGURE 33–1 Sections of the Milky
SECTION 33–1
949
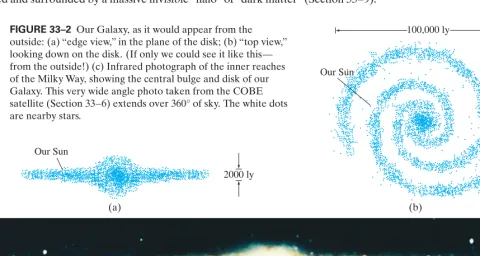
Our Galaxy has a diameter of almost 100,000 light-years and a thickness ofroughly 2000 ly. It has a central bulge and spiral arms (Fig. 33–2). Our Sun, which is a star like many others, is located about halfway from the galactic center to the edge, some 26,000 ly from the center. Our Galaxy contains roughly 400 billion stars. The Sun orbits the galactic center approximately once every 250 million years, so its speed is roughly relative to the center of the Galaxy. The total mass of all the stars in our Galaxy is estimated to be about of ordinary matter. There is also strong evidence that our Galaxy is perme-ated and surrounded by a massive invisible “halo” of “dark matter” (Section 33–9). 4*1041 kg
200 km兾s
A4 * 1011B
100,000 ly
(b) (a)
(c)
2000 ly Our Sun
Our Sun
FIGURE 33–2 Our Galaxy, as it would appear from the outside: (a) “edge view,” in the plane of the disk; (b) “top view,” looking down on the disk. (If only we could see it like this— from the outside!) (c) Infrared photograph of the inner reaches of the Milky Way, showing the central bulge and disk of our Galaxy. This very wide angle photo taken from the COBE satellite (Section 33–6) extends over 360° of sky. The white dots are nearby stars.
Our Galaxy’s mass. Estimate the total mass of our Galaxy using the orbital data above for the Sun about the center of the Galaxy. Assume the mass of the Galaxy is concentrated in the central bulge. APPROACH We assume that the Sun (including our solar system) has total mass m
and moves in a circular orbit about the center of the Galaxy (total massM), and that the mass Mcan be considered as being located at the center of the Galaxy. We then apply Newton’s second law, with abeing the centripetal accelera-tion, and for Fwe use the universal law of gravitation (Chapter 5). SOLUTION Our Sun and solar system orbit the center of the Galaxy, according to the best measurements as mentioned above, with a speed of about
at a distance from the Galaxy center of about We use Newton’s second law:
where M is the mass of the Galaxy and m is the mass of our Sun and solar system. Solving this, we find
NOTE In terms of numbersof stars, if they are like our Sun
there would be about or very roughly on
the order of 100 billion stars.
A2 * 1041 kgB兾A2 * 1030 kgB L 1011Am =
2.0 * 1030 kgB, M = rvG2 L (26,000 ly)A10
16 m兾
lyBA2 * 105 m兾sB2
6.67 * 10–11Nm2兾kg2 L 2 * 10 41kg.
GMm
r2 = m
v2 r
F = ma
r = 26,000 ly. v =
200 km兾s
a = v2兾r, F = ma
,
In addition to stars both within and outside the Milky Way, we can see by telescope many faint cloudy patches in the sky which were all referred to once as “nebulae” (Latin for “clouds”). A few of these, such as those in the constellations Andromeda and Orion, can actually be discerned with the naked eye on a clear night. Some are star clusters(Fig. 33–3), groups of stars that are so numerous they appear to be a cloud. Others are glowing clouds of gas or dust (Fig. 33–4), and it is for these that we now mainly reserve the word nebula.
Most fascinating are those that belong to a third category: they often have fairly regular elliptical shapes. Immanuel Kant (about 1755) guessed they are faint because they are a great distance beyond our Galaxy. At first it was not universally accepted that these objects were extragalactic—that is, outside our Galaxy. But the very large telescopes constructed in the twentieth century revealed that individual stars could be resolved within these extragalactic objects and that many contain spiral arms. Edwin Hubble (1889–1953) did much of this observational work in the 1920s using the 2.5-m (100-inch) telescope† on Mt. Wilson near Los Angeles, California, then the world’s largest. Hubble demonstrated that these objects were indeed extragalactic because of their great distances. The distance to our nearest large galaxy,‡Andromeda, is over 2 million light-years, a distance 20 times greater than the diameter of our Galaxy. It seemed logical that these nebulae must be galaxiessimilar to ours. (Note that it is usual to capitalize the word “galaxy” only when it refers to our own.) Today it is thought there are roughly galaxies in the observable universe—that is, roughly as many galaxies as there are stars in a galaxy. See Fig. 33–5.
Many galaxies tend to be grouped in galaxy clustersheld together by their mutual gravitational attraction. There may be anywhere from a few dozen to many thousands of galaxies in each cluster. Furthermore, clusters themselves seem to be organized into even larger aggregates: clusters of clusters of galaxies, or superclusters. The farthest detectable galaxies are more than distant. See Table 33–1 (top of next page).
1010 ly 1011
950
CHAPTER 33 Astrophysics and Cosmology† refers to the diameter of the curved objective mirror. The bigger the mirror, the more light it collects (greater brightness) and the less diffraction there is (better resolution), so more and fainter stars can be seen. See Chapter 25. Until recently, photographic films or plates were used to take long time exposures. Now large solid-state CCD or CMOS sensors (Section 25–1) are available con-taining hundreds of millions of pixels (compared to 10 million pixels in a good-quality digital camera). ‡The Magellanic cloudsare much closer than Andromeda, but are small and are usually considered small satellite galaxies of our own Galaxy.
2.5m(= 100inches)
FIGURE 33–5 Photographs of galaxies. (a) Spiral galaxy in the constellation Hydra. (b) Two galaxies: the larger and more dramatic one is known as the Whirlpool galaxy. (c) An infrared image (given “false” colors) of the same galaxies as in (b), here showing the arms of the spiral as having more substance than in the visible light photo (b); the different colors correspond to different light intensities. Visible light is scattered and absorbed by interstellar dust much more than infrared is, so infrared gives us a clearer image.
FIGURE 33–3 This globular star cluster is located in the constellation Hercules.
FIGURE 33–4 This gaseous nebula, found in the constellation Carina, is about 9000 light-years from us.
Looking back in time. Astronomers often think of their telescopes as time machines, looking back toward the origin of the universe. How far back do they look?
RESPONSE The distance in light-years measures how long in years the light has been traveling to reach us, so Table 33–1 tells us also how far back in time we are looking. For example, if we saw Proxima Centauri explode into a super-nova today, then the event would have really occurred about 4.2 years ago. The most distant galaxies emitted the light we see now roughly ago. What we see was how they were then, ago.
EXERCISE A Suppose we could place a huge mirror 1 light-year away from us. What would we see in this mirror if it is facing us on Earth? When did what we see in the mirror take place? (This might be called a “time machine.”)
Besides the usual stars, clusters of stars, galaxies, and clusters and super-clusters of galaxies, the universe contains many other interesting objects. Among these are stars known as red giants,white dwarfs,neutron stars, exploding stars callednovaeandsupernovae, and black holeswhose gravity is so strong that even light cannot escape them. In addition, there is electromagnetic radiation that reaches the Earth but does not come from the bright pointlike objects we call stars: particularly important is the microwave background radiation that arrives nearly uniformly from all directions in the universe.
Finally, there are active galactic nuclei(AGN), which are very luminous point-like sources of light in the centers of distant galaxies. The most dramatic examples of AGN are quasars(“quasistellar objects” or QSOs), which are so luminous that the surrounding starlight of the galaxy is drowned out. Their luminosity is thought to come from matter falling into a giant black hole at a galaxy’s center.
33–2
Stellar Evolution: Birth and
Death of Stars, Nucleosynthesis
The stars appear unchanging. Night after night the night sky reveals no significant variations. Indeed, on a human time scale, the vast majority of stars change very little (except for novae, supernovae, and certain variable stars). Although starsseemfixed in relation to each other, many move sufficiently for the motion to be detected. Speeds of stars relative to neighboring stars can be hundreds of but at their great distance from us, this motion is detectable only by careful measurement. There is also a great range of brightness among stars, due to differences in the rate stars emit energy and to their different distances from us.
Luminosity and Brightness of Stars
Any star or galaxy has an intrinsic luminosity,L(or simply luminosity), which is its total power radiated in watts. Also important is the apparent brightness,b, defined as the power crossing unit area at the Earth perpendicular to the path of the light. Given that energy is conserved, and ignoring any absorption in space, the total emitted power Lwhen it reaches a distance dfrom the star will be spread over a sphere of surface area If dis the distance from the star to the Earth, then
Lmust be equal to times b(power per unit area at Earth). That is,
(33;1)
Apparent brightness. Suppose a star has luminosity equal to that of our Sun. If it is 10 ly away from Earth, how much dimmer will it appear? APPROACH We use the inverse square law in Eq. 33–1 to determine the relative brightness since the luminosity Lis the same for both stars.
SOLUTIONUsing the inverse square law, the star appears dimmer by a factor bstar
bSun =
dSun2 dstar2 =
A1.5 * 108 kmB2
(10ly)2A1013km兾lyB2 L 2 * 10 –12.
Ab r 1兾d2B
EXAMPLE 33;3
b = L
4pd2 . 4pd2
4pd2.
km兾s, 13 * 109yr
13 * 109years CONCEPTUAL EXAMPLE 33;2
SECTION 33–2
951
Table 33–1 Astronomical Distances
Approx. Distance Object from Earth (ly)
Moon Sun
Size of solar system (distance to Pluto) Nearest star
(Proxima Centauri) 4.2 Center of our Galaxy Nearest large galaxy
952
CHAPTER 33 Astrophysics and Cosmology†Applies to “main-sequence” stars (see next page). The mass of a star can be determined by observing its gravitational effects on other visible objects. Many stars are part of a cluster, the simplest being a binary star in which two stars orbit around each other, allowing their masses to be determined using rotational mechanics.
Careful study of nearby stars has shown that the luminosity for most stars depends on the mass: the more massive the star, the greater its luminosity†. Another important parameter of a star is its surface temperature, which can be determined from the spectrum of electromagnetic frequencies it emits. As we saw in Chapter 27, as the temperature of a body increases, the spectrum shifts from predominantly lower frequencies (and longer wavelengths, such as red) to higher frequencies (and shorter wavelengths such as blue). Quantitatively, the relation is given by Wien’s law (Eq. 27–2): the wavelength at the peak of the spectrum of light emitted by a blackbody (we often approximate stars as blackbodies) is inversely proportional to its Kelvin temperature T; that is, The surface temperatures of stars typically range from about 3000 K (reddish) to about 50,000 K (UV).
Determining star temperature and star size. Suppose that the distances from Earth to two nearby stars can be reasonably estimated, and that their measured apparent brightnesses suggest the two stars have about the same luminosity,L. The spectrum of one of the stars peaks at about 700 nm (so it is reddish). The spectrum of the other peaks at about 350 nm (bluish). Use Wien’s law (Eq. 27–2) and the Stefan-Boltzmann equation (Section 14–8) to determine (a) the surface temperature of each star, and (b) how much larger one star is than the other.
APPROACH We determine the surface temperature Tfor each star using Wien’s law and each star’s peak wavelength. Then, using the Stefan-Boltzmann equation
(power output or luminosity ), we can
find the surface area ratio and relative sizes of the two stars.
SOLUTION (a)Wien’s law (Eq. 27–2) states that So the temperature of the reddish star is
The temperature of the bluish star will be double this because its peak wavelength is half (350 nm vs. 700 nm):
(b) The Stefan-Boltzmann equation, Eq. 14–6, states that the power radiated
per unit areaof surface from a blackbody is proportional to the fourth power of the Kelvin temperature, The temperature of the bluish star is double that of the reddish star, so the bluish one must radiate times as much energy per unit area. But we are given that they have the same luminosity (the same total power output); so the surface area of the blue star must be that of the red one. The surface area of a sphere is so the radius of the reddish star is times larger than the radius of the bluish star (or
times the volume).
H–R Diagram
An important astronomical discovery, made around 1900, was that for most stars, the color is related to the intrinsic luminosity and therefore to the mass. A useful way to present this relationship is by the so-called Hertzsprung–Russell (H–R) diagram. On the H–R diagram, the horizontal axis shows the surface tempera-tureTand the vertical axis is the luminosity L; each star is represented by a point 43 = 64 116 = 4
4pr2,
1 16
ATb兾TrB4 = 24 = 16 T4.
Tb = 8280K.
Tr =
2.90 * 10–3 mK
lP =
2.90 * 10–3 mK
700 * 10–9m = 4140K.
lPT = 2.90 * 10–3 mK.
r AT4 where A = surface area of emitter
EXAMPLE 33;4
lPT = 2.90 * 10–3 mK.
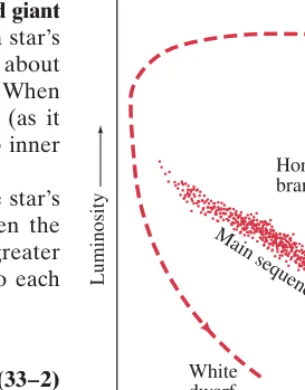
on the diagram, Fig. 33–6. Most stars fall along the diagonal band termed the main sequence. Starting at the lower right we find the coolest stars: by Wien’s law, constant, their light output peaks at long wavelengths, so they are red-dish in color. They are also the least luminous and therefore of low mass. Farther up toward the left we find hotter and more luminous stars that are whitish, like our Sun. Still farther up we find even more luminous and more massive stars, bluish in color. Stars that fall on this diagonal band are called main-sequence stars. There are also stars that fall outside the main sequence. Above and to the right we find extremely large stars, with high luminosities but with low (reddish) color temperature: these are called red giants. At the lower left, there are a few stars of low luminosity but with high temperature: these are the white dwarfs.
Distance to a star using the H–R diagram and color. Suppose that detailed study of a certain star suggests that it most likely fits on the main sequence of an H–R diagram. Its measured apparent brightness is and the peak wavelength of its spectrum is
Estimate its distance from us.
APPROACH We find the temperature using Wien’s law, Eq. 27–2. The luminosity is estimated for a main-sequence star on the H–R diagram of Fig. 33–6, and then the distance is found using the relation between brightness and luminosity, Eq. 33–1.
SOLUTION The star’s temperature, from Wien’s law (Eq. 27–2), is
A star on the main sequence of an H–R diagram at this temperature has lumi-nosity of about read off of Fig. 33–6. Then, from Eq. 33–1,
Its distance from us in light-years is
EXERCISE B Estimate the distance to a 6000-K main-sequence star with an apparent brightness of 2.0 * 10–12W兾m2.
d = 3 * 1018m
1016 m兾ly L 300 ly.
d = B L
4pb L B
1 * 1026 W
4(3.14)A1.0 * 10–12W兾m2B L 3 * 10 18m.
L L 1 * 1026W,
T L 2.90 * 10–3mK
600 * 10–9 m L 4800 K.
lP L 600nm.
b = 1.0 * 10–12W兾m2,
EXAMPLE 33;5 ESTIMATE
lPT =
SECTION 33–2 Stellar Evolution: Birth and Death of Stars, Nucleosynthesis
953
FIGURE 33–6 Hertzsprung–Russell(H–R) diagram is a logarithmic graph of luminosity vs. surface temperatureTof stars (note that T
increases to the left).
10,000
Surface temperature T (K)
Intrinsic luminosity
L
(
w
atts)
1029
1023 1024 1025 1026 1027 1028
5000 3500
7000 White dwarfs
Main sequence
Stellar Evolution; Nucleosynthesis
Why are there different types of stars, such as red giants and white dwarfs, as well as main-sequence stars? Were they all born this way, in the beginning? Or might each different type represent a different age in the life cycle of a star? Astronomers and astrophysicists today believe the latter is the case. Note, however, that we cannot actually follow any but the tiniest part of the life cycle of any given star because they live for ages vastly greater than ours, on the order of millions or billions of years. Nonetheless, let us follow the process of stellar evolutionfrom the birth to the death of a star, as astrophysicists have theoretically reconstructed it today.
Stars are born, it is believed, when gaseous clouds (mostly hydrogen) contract due to the pull of gravity. A huge gas cloud might fragment into numerous con-tracting masses, each mass centered in an area where the density is only slightly greater than that at nearby points. Once such “globules” form, gravity causes each to contract in toward its center of mass. As the particles of such aprotostar
accelerate inward, their kinetic energy increases. Eventually, when the kinetic energy is sufficiently high, the Coulomb repulsion between the positive charges is not strong enough to keep all the hydrogen nuclei apart, and nuclear fusion can take place.
In a star like our Sun, the fusion of hydrogen (sometimes referred to as “burning”)†occurs via the proton–proton chain(Section 31–3, Eqs. 31–6), in which four protons fuse to form a nucleus with the release of rays, positrons,
and neutrinos: These reactions require a
tem-perature of about corresponding to an average kinetic energy of about 1 keV (Eq. 13–8). In more massive stars, the carbon cycle produces the same net effect: four produce a —see Section 31–3. The fusion reactions take place primarily in the core of a star, where Tmay be on the order of to (The surface temperature is much lower—on the order of a few thousand kelvins.) The tremendous release of energy in these fusion reactions produces an outward pressure sufficient to halt the inward gravitational contraction. Our protostar, now really a young star, stabilizes on the main sequence. Exactly where the star falls along the main sequence depends on its mass. The more massive the star, the farther up (and to the left) it falls on the H–R diagram of Fig. 33–6. Our Sun required perhaps 30 million years to reach the main sequence, and is expected to remain there about 10 billion years Although most stars are billions of years old, evidence is strong that stars are actually being born at this moment. More massive stars have shorter lives, because they are hotter and the Coulomb repulsion is more easily overcome, so they use up their fuel faster. Our Sun may remain on the main sequence for but a star ten times more massive may reside there for only
As hydrogen fuses to form helium, the helium that is formed is denser and tends to accumulate in the central core where it was formed. As the core of helium grows, hydrogen continues to fuse in a shell around it: see Fig. 33–7. When much of the hydrogen within the core has been consumed, the production of energy decreases at the center and is no longer sufficient to prevent the huge gravitational forces from once again causing the core to contract and heat up. The hydrogen in the shell around the core then fuses even more fiercely because of this rise in temperature, allowing the outer envelope of the star to expand and to cool. The surface temperature, thus reduced, produces a spectrum of light that peaks at longer wavelength (reddish).
This process marks a new step in the evolution of a star. The star has become redder, it has grown in size, and it has become more luminous, which means it has left the main sequence. It will have moved to the right and upward on the
107years.
1010years,
A1010yrB. 108K.
107 2
4He 1
1H
(LkT)
107K,
411H S 24He + 2 e± + 2ne + 2g.
g 2
4He
954
CHAPTER 33 Astrophysics and Cosmology†The word “burn,” meaning fusion, is put in quotation marks because these high-temperature fusion reactions occur via anuclearprocess, and must not be confused with ordinary burning (of, say, paper, wood, or coal) in air, which is achemicalreaction, occurring at the atomiclevel (and at a much lower temperature).
FIGURE 33–7 A shell of “burning” hydrogen (fusing to become helium) surrounds the core where the newly formed helium gravitates.
Nonburning outer envelope Hydrogen
fusion
H–R diagram, as shown in Fig. 33–8. As it moves upward, it enters the red giant stage. Thus, theory explains the origin of red giants as a natural step in a star’s evolution. Our Sun, for example, has been on the main sequence for about
billion years. It will probably remain there another 5 or 6 billion years. When our Sun leaves the main sequence, it is expected to grow in diameter (as it becomes a red giant) by a factor of 100 or more, possibly swallowing up inner planets such as Mercury and possibly Venus and even Earth.
If the star is like our Sun, or larger, further fusion can occur. As the star’s outer envelope expands, its core continues to shrink and heat up. When the temperature reaches about even helium nuclei, in spite of their greater charge and hence greater electrical repulsion, can come close enough to each other to undergo fusion. The reactions are
(33;2)
with the emission of two rays. These two reactions must occur in quick succes-sion (because is very unstable), and the net effect is
This fusion of helium causes a change in the star which moves rapidly to the “horizontal branch” on the H–R diagram (Fig. 33–8). Further fusion reactions are possible, with fusing with to form In more massive stars, higher Z
elements like or can be made. This process of creating heavier nuclei from lighter ones (or by absorption of neutrons which tends to occur at higher Z) is called nucleosynthesis.
Low Mass Stars—White Dwarfs
The final fate of a star depends on its mass. Stars can lose mass as parts of their outer envelope move off into space. Stars born with a mass less than about 8 solar masses ( the mass of our Sun) eventually end up with a residual mass less than about 1.4 solar masses. A residual mass of 1.4 solar masses is known as theChandrasekhar limit. For stars smaller than this, no further fusion energy can be obtained because of the large Coulomb repulsion between nuclei. The core of such a “low mass” star (original solar masses) contracts under gravity. The outer envelope expands again and the star becomes an even brighter and larger red giant, Fig. 33–8. Eventually the outer layers escape into space, and the newly revealed surface is hotter than before. So the star moves to the left in the H–R diagram (horizontal dashed line in Fig. 33–8). Then, as the core shrinks the star cools, and typically follows the downward dashed route shown on the left in Fig. 33–8, becoming a white dwarf. A white dwarf with a residual mass equal to that of the Sun would be about the size of the Earth. A white dwarf contracts to the point at which the electrons start to overlap, but no further because, by the Pauli exclusion principle, no two electrons can be in the same quantum state. At this point the star is supported against further collapse by this electron degeneracypressure. A white dwarf continues to lose internal energy by radiation, decreasing in temperature and becoming dimmer until it glows no more. It has then become a cold dark chunk of extremely dense material.
High Mass Stars—Supernovae, Neutron Stars, Black Holes
Stars whose original mass is greater than about 8 solar masses are thought to follow a very different scenario. A star with this great a mass can contract under gravity and heat up even further. At temperatures nuclei as heavy as and can be made. But here the formation of heavy nuclei from lighter ones, by fusion, ends. As we saw in Fig. 30–1, the average binding energy per nucleon begins to decrease for A greater than about 60. Further fusions wouldrequireenergy, rather than release it.
28 56Ni 26
56Fe T L
3 or 4 * 109K, mass f 8
8* 12 24Mg 10
20Ne 8
16O. 6
12C 2
4He
(Q = 7.3MeV)
324He S 126C + 2g. 4
8Be
g 2
4He + 4 8Be S
6 12C 2
4He + 2 4He S
4 8Be 108 K, 412
SECTION 33–2 Stellar Evolution: Birth and Death of Stars, Nucleosynthesis
955
FIGURE 33–8 Evolutionary “track” of a star like our Sun represented on an H–R diagram.Surface temperature
Luminosity
White dwarf
Main sequence
Red giant
At these extremely high temperatures, well above high-energy collisions can cause the breaking apart of iron and nickel nuclei into He nuclei, and eventually into protons and neutrons:
These are energy-requiring (endothermic) reactions, which rob energy from the core, allowing gravitational contraction to begin. This then can force electrons and protons together to form neutrons in inverse decay:
As a result of these reactions, the pressure in the core drops precipitously. As the core collapses under the huge gravitational forces, the tremendous mass becomes essentially an enormous nucleus made up almost exclusively of neutrons. The size of the star is no longer limited by the exclusion principle applied to electrons, but rather by neutron degeneracypressure, and the star contracts rapidly to form an enormously dense neutron star. The core of a neutron star contracts to the point at which all neutrons are as close together as they are in an atomic nucleus. That is, the density of a neutron star is on the order of times greater than normal solids and liquids on Earth. A cupful of such dense matter would weigh billions of tons. A neutron star that has a mass 1.5 times that of our Sun would have a diameter of only about 20 km. (Compare this to a white dwarf with 1 solar mass whose diameter would be , as mentioned on the previous page.)
The contraction of the core of a massive star would mean a great reduction in gravitational potential energy. Somehow this energy would have to be released. Indeed, it was suggested in the 1930s that the final core collapse to a neutron star could be accompanied by a catastrophic explosion known as asupernova(plural supernovae). The tremendous energy release (Fig. 33–9) could form virtually all elements of the Periodic Table (see below) and blow away the entire outer envelope of the star, spreading its contents into interstellar space. The presence of heavy elements on Earth and in our solar system suggests that our solar system formed from the debris of many such supernova explosions.
The elements heavier than Ni are thought to form mainly by neutron capture in these exploding supernovae (rather than by fusion, as for elements up to Ni). Large numbers of free neutrons, resulting from nuclear reactions, are present inside those highly evolved stars and they can readily combine with, say, a nucleus to form (if three are captured) which decays to The can capture neutrons, also becoming neutron rich and decaying by to the next higherZelement, and so on to the highest Zelements.
The final state of a neutron star depends on its mass. If the final mass is less than about three solar masses, the subsequent evolution of the neutron star is thought to resemble that of a white dwarf. If the mass is greater than this (original mass solar masses), the neutron star collapses under gravity, overcoming even neutron degeneracy. Gravity would then be so strong that emitted light could not escape—it would be pulled back in by the force of gravity. Since no radiation could escape from such a “star,” we could not see it— it would be black. An object may pass by it and be deflected by its gravitational field, but if the object came too close it would be swallowed up, never to escape. This is ablack hole.
Novae and Supernovae
Novae(singular is nova, meaning “new” in Latin) are faint stars that have sud-denly increased in brightness by as much as a factor of and last for a month or two before fading. Novae are thought to be faint white dwarfs that have pulled mass from a nearby companion (they make up abinarysystem), as illustrated in Fig. 33–10. The captured mass of hydrogen suddenly fuses into helium at a high rate for a few weeks. Many novae (maybe all) are recurrent—they repeat their bright glow years later.
106 g40
b– 27
59Co 27
59Co. 26
59Fe, 26
56Fe = L104 km
1014 e– + p S n + n.
B 2
4He S 2p + 2n. 26
56Fe S 13 2
4He + 4n
109K,
956
CHAPTER 33 Astrophysics and Cosmology FIGURE 33–9 The star indicated bythe arrow in (a) exploded in 1987 as a supernova (SN1987A), as shown in (b). The bright spot in (b) indicates a huge release of energy but does not represent the physical size. (a)
(b)
FIGURE 33–10 Hypothetical model for novae and Type Ia supernovae, showing how a white dwarf could pull mass from its normal companion.
White dwarf Main-sequence
companion
Earth (January)
Earth’s orbit
Earth (July) Nearby
star Distant stars
D
d Sun d
Sky as seen from Earth in January
(a) (b)
July vie
wing angle
January vie wing angle
As seen from Earth in July
f f
Supernovaeare also brief explosive events, but release millions of times more energy than novae, up to times more luminous than our Sun. The peak of brightness may exceed that of the entire galaxy in which they are located, but lasts only a few days or weeks. They slowly fade over a few months. Many supernovae form by core collapse to a neutron star as described above. See Fig. 33–9.
Type Ia supernovaeare different. They all seem to have very nearly the same luminosity. They are believed to be binary stars, one of which is a white dwarf that pulls mass from its companion, much like for a nova, Fig. 33–10. The mass is higher, and as mass is captured and the total mass approaches the Chandrasekhar limit of 1.4 solar masses, it explodes as a “white-dwarf” supernova by undergoing a “thermonuclear runaway”—an uncontrolled chain of nuclear reactions that entirely destroys the white dwarf. Type Ia supernovae are useful to us as “standard candles” in the night sky to help us determine distance—see next Section.
33–3
Distance Measurements
Parallax
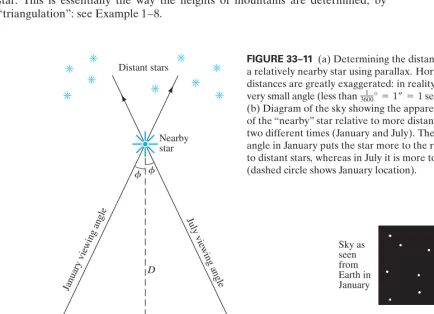
We have talked about the vast distances of objects in the universe. But how do we measure these distances? One basic technique employs simple geometry to measure the parallax of a star. By parallax we mean the apparent motion of a star, against the background of much more distant stars, due to the Earth’s motion around the Sun. As shown in Fig. 33–11, we can measure the angle that the star appears to shift, relative to very distant stars, when viewed 6 months apart. If we know the distance dfrom Earth to Sun, we can reconstruct the right triangles shown in Fig. 33–11 and can then determine the distance D to the star. This is essentially the way the heights of mountains are determined, by “triangulation”: see Example 1–8.
2f 1010
SECTION 33–3 Distance Measurements
957
FIGURE 33–11 (a) Determining the distance Dtoa relatively nearby star using parallax. Horizontal distances are greatly exaggerated: in reality is a very small angle (less than of arc). (b) Diagram of the sky showing the apparent position of the “nearby” star relative to more distant stars, at two different times (January and July). The viewing angle in January puts the star more to the right relative to distant stars, whereas in July it is more to the left (dashed circle shows January location).
1
3600° = 1– = 1second
958
CHAPTER 33 Astrophysics and CosmologyDistance to a star using parallax. Estimate the distance D to a star if the angle in Fig. 33–11a is measured to be
APPROACH From trigonometry, in Fig. 33–11a. The Sun–Earth
distance is (inside front cover).
SOLUTION The angle or about
radians. We can use tan because is very small. We solve forDin tan The distance Dto the star is
or about 15 ly.
Parsec
Distances to stars are often specified in terms of parallax angle ( in Fig. 33–11a) given in seconds of arc: 1 second is of one minute of arc, which is of a degree, so of a degree. The distance is then specified in parsecs(pc) (meaningparallax angle in seconds of arc): with in seconds of arc. In
Example 33–6, of arc, so we would say the star
is at a distance of One parsec is given by (recall and we set the Sun–Earth distance (Fig. 33–11a) as ):
Distant Stars and Galaxies
Parallax can be used to determine the distance to stars as far away as about 100 light-years from Earth, and from an orbiting spacecraft perhaps 5 to 10 times farther. Beyond that distance, parallax angles are too small to measure. For greater distances, more subtle techniques must be employed. We might compare the apparent brightnesses of two stars, or two galaxies, and use the inverse square law(apparent brightness drops off as the square of the distance) to roughly esti-mate their relative distances. We can’t expect this technique to be very precise because we don’t expect any two stars, or two galaxies, to have the same intrinsic luminosity. When comparing galaxies, a perhaps better estimate assumes the brightest stars in all galaxies (or the brightest galaxies in galaxy clusters) are sim-ilar and have about the same intrinsic luminosity. Consequently, their apparent brightnesswould be a measure of how far away they were.
Another technique makes use of the H–R diagram. Measurement of a star’s surface temperature (from its spectrum) places it at a certain point (within 20%) on the H–R diagram, assuming it is a main-sequence star, and then its luminosity can be estimated from the vertical axis (Fig. 33–6). Its apparent brightness and Eq. 33–1 give its approximate distance; see Example 33–5.
A better estimate comes from comparing variable stars, especially Cepheid
variables whose luminosity varies over time with a period that is found to be related to their average luminosity. Thus, from their period and apparent bright-ness we get their distance.
Distance via SNIa, Redshift
The largest distances are estimated by comparing the apparent brightnesses of Type Ia supernovae (“SNIa”). Type Ia supernovae all have a similar origin (as described on the previous page and Fig. 33–10), and their brief explosive burst of light is expected to be of nearly the same luminosity. They are thus sometimes referred to as “standard candles.”
1 pc = A3.086 * 1016 mB¢ 1 ly
9.46 * 1015 m≤ = 3.26 ly. 1 pc = d
1– =
1.496 * 1011 m
(1–)¢ 1¿ 60–≤ ¢
1° 60¿≤ ¢
2p rad 360° ≤
= 3.086 * 1016m d = 1.496 * 1011 mD = d兾f
, 1兾0.22– = 4.5 pc.
f = A6 * 10–5B°(3600) = 0.22D =– f
1兾f 1– = 36001
1 60 (1¿)
1 60 (1–)
f
*
D = d
tanf L d
f =
1.5 * 108km
1.0 * 10–6rad = 1.5 * 10 14 km,
f = d兾D.
f
f L f
1.0 * 10–6 (
0.00006°)(2p rad兾360°) = f = 0.00006°,
d = 1.5 * 108km
tanf = d兾D 2f = 0.00012°.
2f
Another important technique for estimating the distance of very distant galaxies is from the “redshift” in the line spectra of elements and compounds. The redshift is related to the expansion of the universe, as we shall discuss in Section 33–5. It is useful for objects farther than to ly away.
As we look farther and farther away, measurement techniques are less and less reliable, so there is more uncertainty in the measurements of large distances.
33–4
General Relativity: Gravity
and the Curvature of Space
We have seen that the force of gravity plays an important role in the processes that occur in stars. Gravity too is important for the evolution of the universe as a whole. The reasons gravity plays a dominant role in the universe, and not one of the other of the four forces in nature, are (1) it is long-range and (2) it is always attractive. The strong and weak nuclear forces act over very short distances only, on the order of the size of a nucleus; hence they do not act over astronomical distances (they do act between nuclei and nucleons in stars to produce nuclear reactions). The electromagnetic force, like gravity, acts over great distances. But it can be either attractive or repulsive. And since the universe does not seem to contain large areas of net electric charge, a large net force does not occur. But gravity acts only as an attractiveforce between allmasses, and there are large accumulations of mass in the universe. The force of gravity as Newton described it in his law of universal gravitation was modified by Einstein. In his general theory of relativity, Einstein developed a theory of gravity that now forms the basis of cosmological dynamics.In the special theory of relativity(Chapter 26), Einstein concluded that there is no way for an observer to determine whether a given frame of reference is at rest or is moving at constant velocity in a straight line. Thus the laws of physics must be the same in different inertial reference frames. But what about the more general case of motion where reference frames can be accelerating?
Einstein tackled the problem of accelerating reference frames in his general theory of relativityand in it also developed a theory of gravity. The mathematics of General Relativity is complex, so our discussion will be mainly qualitative.
We begin with Einstein’s principle of equivalence, which states that
no experiment can be performed that could distinguish between a uniform gravitational field and an equivalent uniform acceleration.
If observers sensed that they were accelerating (as in a vehicle speeding around a sharp curve), they could not prove by any experiment that in fact they weren’t simply experiencing the pull of a gravitational field. Conversely, we might think we are being pulled by gravity when in fact we are undergoing an acceleration having nothing to do with gravity.
As a thought experiment, consider a person in a freely falling elevator near the Earth’s surface. If our observer held out a book and let go of it, what would happen? Gravity would pull it downward toward the Earth, but at the same rate at which the person and elevator were falling. So the book would hover right next to the person’s hand (Fig. 33–12). The effect is exactly the same as if this reference frame was at rest and noforces were acting. On the other hand, if the elevator was out in space where the gravitational field is essentially zero, the released book would float, just as it does in Fig. 33–12. Next, if the elevator (out in space) is accelerated upward (using rockets) at an acceleration of the book as seen by our observer would fall to the floor with an acceleration of just as if it were falling due to gravity at the surface of the Earth. According to the principle of equivalence, the observer could not determine whether the book fell because the elevator was accelerating upward, or because a gravitational field was acting downward and the elevator was at rest. The two descriptions are equivalent.
9.8m兾s2, 9.8m兾s2,
Ag = 9.8m兾s2B
108 107
SECTION 33–4 General Relativity: Gravity and the Curvature of Space
959
FIGURE 33–12 In an elevator falling freely under gravity,(a) a person releases a book; (b) the released book hovers next to the owner’s hand; (b) is a few moments after (a).
g (a)
Beam of ligh
t
Flash-light
Flash-light
Beam of light
(a) (b)
The principle of equivalence is related to the concept that there are two types of mass. Newton’s second law, uses inertial mass. We might say that inertial mass represents “resistance” to any type of force. The second type of mass is gravitational mass. When one object attracts another by the gravitational force (Newton’s law of universal gravitation, Chapter 5), the strength of the force is proportional to the product of the gravitational massesof the two objects. This is much like Coulomb’s law for the electric force between two objects which is proportional to the product of their electric charges. The electric charge on an object is not related to its inertial mass; so why should we expect that an object’s gravitational mass (call it gravitational charge if you like) be related to its inertial mass? All along we have assumed they were the same. Why? Because no experiment—not even of high precision—has been able to dis-cern any measurable difference between inertial mass and gravitational mass. (For example, in the absence of air resistance, all objects fall at the same acceleration,g, on Earth.) This is another way to state the equivalence principle:gravitational mass is equivalent to inertial mass.
F = Gm1m2兾r2,
F = ma,
960
CHAPTER 33FIGURE 33–13 (a) Light beam goes straight across an elevator which is not accelerating. (b) The light beam bends (exaggerated) according to an observer in an accelerating elevator whose speed increases in the upward direction.
Observer on Earth
2 1
Stars
(a)
Observer
on Earth (b)
Sun Moon
Apparent position of star
θ
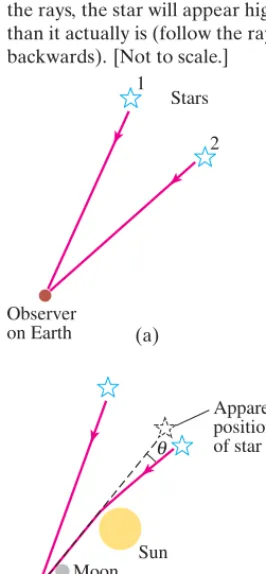
The principle of equivalence can be used to show that light ought to be deflected by the gravitational force due to a massive object. Consider another thought experiment, in which an elevator is in free space where virtually no gravity acts. If a light beam is emitted by a flashlight attached to the side of the elevator, the beam travels straight across the elevator and makes a spot on the opposite side if the elevator is at rest or moving at constant velocity (Fig. 33–13a). If instead the elevator is accelerating upward, as in Fig. 33–13b, the light beam still travels straight across in a reference frame at rest. In the upwardly accelerating elevator, however, the beam is observed to curve downward. Why? Because during the time the light travels from one side of the elevator to the other, the elevator is moving upward at a vertical speed that is increasing relative to the light. Next we note that according to the equivalence principle, an upwardly accel-erating reference frame is equivalent to a downward gravitational field. Hence, we can picture the curved light path in Fig. 33–13b as being due to the effect of a gravitational field. Thus, from the principle of equivalence, we expect gravity to exert a force on a beam of light and to bend it out of a straight-line path!
That light is affected by gravity is an important prediction of Einstein’s general theory of relativity. And it can be tested. The amount a light beam would be deflected from a straight-line path must be small even when passing a massive object. (For example, light near the Earth’s surface after traveling 1 km is pre-dicted to drop only about which is equal to the diameter of a small atom and not detectable.) The most massive object near us is the Sun, and it was calculated that light from a distant star would be deflected by of arc (tiny but detectable) as it passed by the edge of the Sun (Fig. 33–14). However, such a measurement could be made only during a total eclipse of the Sun, so that the Sun’s tremendous brightness would not obscure the starlight passing near its edge.
1.75– 10–10 m,
SECTION 33–4
961
FIGURE 33–15 (a) Hubble Space Telescope photograph of the so-called “Einstein cross,” thought to represent“gravitational lensing”: the central spot is a relatively nearby galaxy, whereas the four other spots are thought to be images of a single quasar behindthe galaxy. (b) Diagram showing how the galaxy could bend the light coming from the quasar behind it to produce the four images. See also Fig. 33–14. [If the shape of the nearby galaxy and distant quasar were perfect spheres and perfectly aligned, we would expect the “image” of the distant quasar to be a circular ring or halo instead of the four separate images seen here. Such a ring is called an “Einstein ring.”]
Light from Quasar Galaxy
Quasar Observer
False image False image
(a) (b)
An opportune eclipse occurred in 1919, and scientists journeyed to the South Atlantic to observe it. Their photos of stars just behind the Sun revealed shifts in accordance with Einstein’s prediction. Another example of gravitational deflection of light is gravitational lensing, as described in Fig. 33–15. The very distant galaxies shown in the XDF photo at the start of this Chapter, page 947, are thought to be visible only because of gravitational lensing (and magnification of their emitted light) by nearer galaxies—as if the nearby galaxies acted as a magnifying glass. The mathematician Fermat showed in the 1600s that optical phenomena, including reflection, refraction, and effects of lenses, can be derived from a simple principle: that light traveling between two points follows the shortest path in space. Thus if gravity curves the path of light, then gravity must be able to curve space itself. That is,space itself can be curved, and it is gravitational mass that causes the curvature. Indeed, the curvature of space—or rather, of four-dimensional space-time—is a basic aspect of Einstein’s General Relativity.
What is meant by curved space? To understand, recall that our normal method of viewing the world is via Euclidean plane geometry. In Euclidean geometry, there are many axioms and theorems we take for granted, such as that the sum of the angles of any triangle is 180°. Non-Euclidean geometries, which involve curved space, have also been imagined by mathematicians. It is hard enough to imagine three-dimensional curved space, much less curved four-dimensional space-time. So let us try to understand the idea of curved space by using two-dimensional surfaces.
Consider, for example, the two-dimensional surface of a sphere. It is clearly curved, Fig. 33–16, at least to us who view it from the outside—from our three-dimensional world. But how would hypothetical two-three-dimensional creatures determine whether their two-dimensional space was flat (a plane) or curved? One way would be to measure the sum of the angles of a triangle. If the surface is a plane, the sum of the angles is 180°, as we learn in plane geometry. But if the space is curved, and a sufficiently large triangle is constructed, the sum of the angles will notbe 180°. To construct a triangle on a curved surface, say the sphere of Fig. 33–16, we must use the equivalent of a straight line: that is, the shortest distance between two points, which is called ageodesic. On a sphere, a geodesic is an arc of a great circle (an arc in a plane passing through the center of the sphere) such as the Earth’s equator and the Earth’s longitude lines. Consider, for example, the large triangle of Fig. 33–16: its sides are two longitude lines passing from the north pole to the equator, and the third side is a section of the equator as shown. The two longitude lines make 90° angles with the equator (look at a world globe to see this more clearly). They make an angle with each other at the north pole, which could be, say, 90° as shown; the sum of these angles is This is clearly nota Euclidean space. Note, however, that if the triangle is small in comparison to the radius of the sphere, the angles will add up to nearly 180°, and the triangle (and space) will seem flat.
90° + 90° + 90° = 270°.
FIGURE 33–16 On a
two-dimensional curved surface, the sum of the angles of a triangle may not be 180°.
“North pole”
Earth 90°
90°
90°
Another way to test the curvature of space is to measure the radius rand circumferenceCof a large circle. On a plane surface, But on a two-dimensional spherical surface, Cislessthan as can be seen in Fig. 33–17. The proportionality between Candrislessthan Such a surface is said to have
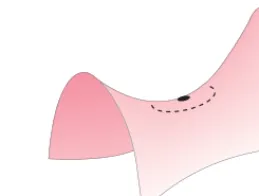
positive curvature. On the saddlelike surface of Fig. 33–18, the circumference of a circle is greater than and the sum of the angles of a triangle is less than 180°. Such a surface is said to have anegative curvature.
Curvature of the Universe
What about our universe? On a large scale (not just near a large mass), what is the overall curvature of the universe? Does it have positive curvature, negative curvature, or is it flat (zero curvature)? We perceive our world as Euclidean (flat), but we can not exclude the possibility that space could have a curvature so slight that we don’t normally notice it. This is a crucial question in cosmology, and it can be answered only by precise experimentation.
If the universe had a positive curvature, the universe would be closed, or
finitein volume. This would notmean that the stars and galaxies extended out to a certain boundary, beyond which there is empty space. There is no boundary or edge in such a universe. The universe is all there is. If a particle were to move in a straight line in a particular direction, it would eventually return to the starting point—perhaps eons of time later.
On the other hand, if the curvature of space was zero or negative, the universe would be open. It could just go on forever. An open universe could be
infinite; but according to recent research, even that may not necessarily be so. Today the evidence is very strong that the universe on a large scale is very close to being flat. Indeed, it is so close to being flat that we can’t tell if it might have very slightly positive or very slightly negative curvature.
Black Holes
According to Einstein’s theory of general relativity (sometimes abbreviated GR), space-time is curved near massive objects. We might think of space as being like a thin rubber sheet: if a heavy weight is placed on the sheet, it sags as shown in Fig. 33–19a (top of next page). The weight corresponds to a huge mass that causes space (space itself!) to curve. Thus, in the context of
2pr,
2p. 2pr,
C = 2pr.
962
CHAPTER 33 Astrophysics and CosmologyFIGURE 33–17 On a spherical surface (a two-dimensional world) a circle of
circumferenceCis drawn (red) about point O as the center. The radius of the circle (not the sphere) is the distance ralong the surface. (Note that in our three-dimensional view, we can tell that Since then
) C6 2pr.
r 7 a, C= 2pa.
FIGURE 33–18 Example of a two-dimensional surface with negative curvature.
O
a C
r
general relativity† we do not speak of the “force” of gravity acting on objects. Instead we say that objects and light rays move as they do because space-time is curved. An object starting at rest or moving slowly near the great mass of Fig. 33–19a would follow a geodesic (the equivalent of a straight line in plane geometry) toward that great mass.
The extreme curvature of space-time shown in Fig. 33–19b could be produced by ablack hole. A black hole, as we mentioned in Section 33–2, has such strong gravity that even light cannot escape from it. To become a black hole, an object of mass Mmust undergo gravitational collapse, contracting by gravitational self-attraction to within a radius called the Schwarzschild radius,
whereGis the gravitational constant and cthe speed of light. If an object col-lapses to within this radius, it is predicted by general relativity to collapse to a point at forming an infinitely dense singularity. This prediction is uncertain, however, because in this realm we need to combine quantum mechan-ics with gravity, a unification of theories not yet achieved (Section 32–12).
EXERCISE C What is the Schwarzschild radius for an object with 10 solar masses? The Schwarzschild radius also represents the event horizon of a black hole. Byevent horizonwe mean the surface beyond which no emitted signals can ever reach us, and thus inform us of events that happen beyond that surface. As a star collapses toward a black hole, the light it emits is pulled harder and harder by gravity, but we can still see it. Once the matter passes within the event horizon, the emitted light cannot escape but is pulled back in by gravity ( of space-time).
All we can know about a black hole is its mass, its angular momentum (rotating black holes), and its electric charge. No other information, no details of its structure or the kind of matter it was formed of, can be known because no information can escape.
How might we observe black holes? We cannot see them because no light can escape from them. They would be black objects against a black sky. But they do exert a gravitational force on nearby objects, and also on light rays (or photons) that pass nearby (just like in Fig. 33–15). The black hole believed to be at the center of our Galaxy ( ) was discovered by examining the motion of matter in its vicinity. Another technique is to examine stars which appear to move as if they were one member of abinary system(two stars rotating about their common center of mass), but without a visible companion. If the unseen star is a black hole, it might be expected to pull off gaseous material from its visible companion (as in Fig. 33–10). As this matter approached the black hole, it would be highly accelerated and should emit X-rays of a characteristic type before plunging inside the event horizon. Such X-rays, plus a sufficiently high mass estimate from the rotational motion, can provide evidence for a black hole. One of the many candidates for a black hole is in the binary-star system Cygnus X-1. It is widely believed that the center of most galaxies is occupied by a black hole with a mass times the mass of a typical star like our Sun.
EXERCISE D A black hole has radius R. Its mass is proportional to (a)R, (b) (c) Justify your answer.
R3 . R2
, 106 to 109
M L 4 * 106M
Sun
= curvature r = 0,
R = 2GM
c2 ,
SECTION 33–4 General Relativity: Gravity and the Curvature of Space
963
†Alexander Pope (1688–1744) wrote an epitaph for Newton:“Nature, and Nature’s laws lay hid in night: God said,Let Newton be!and all was light.”
Sir John Squire (1884–1958), perhaps uncomfortable with Einstein’s profound thoughts, added: “It did not last: the Devil howling ‘Ho!
Let Einstein be!’ restored the status quo.”
FIGURE 33–19 (a) Rubber-sheet analogy for space-time curved by matter. (b) Same analogy for a black hole, which can “swallow up” objects that pass near.
Mass (a)
33–5
The Expanding Universe:
Redshift and Hubble’s Law
We discussed in Section 33–2 how individual stars evolve from their birth to their death as white dwarfs, neutron stars, or black holes. But what about the universe as a whole: is it static, or does it change? One of the most important scientific discoveries of the twentieth century was that distant galaxies are racing away from us, and that the farther they are from us at a given time, the faster they are moving away. How astronomers arrived at this astonishing idea, and what it means for the past history of the universe as well as its future, will occupy us for the remainder of the book.
Observational evidence that the universe is expanding was first put forth by Edwin Hubble in 1929. This idea was based on distance measurements of galaxies (Section 33–3), and determination of their velocities by the Doppler shift of spectral lines in the light received from them (Fig. 33–20). In Chapter 12 we saw how the frequency of sound is higher and the wavelength shorter if the source and observer move toward each other. If the source moves away from the observer, the frequency is lower and the wavelength longer. The Doppler effect occurs also for light, but the formula for light is slightly different than for sound and is given by†
(33;3)
where is the emitted wavelength as seen in a reference frame at rest with respect to the source, and is the wavelength observed in a frame moving with velocity away from the source along the line of sight. (For relative motion
towardeach other, in this formula.) When a distant source emits light of a particular wavelength, and the source is moving away from us, the wavelength appears longer to us: the color of the light (if it is visible) is shifted toward the red end of the visible spectrum, an effect known as aredshift. (If the source moves toward us, the color shifts toward the blue or shorter wavelength.)
In the spectra of stars in other galaxies, lines are observed that correspond to lines in the known spectra of particular atoms (see Section 27–11 and Figs. 24–28 and 27–23). What Hubble found was that the lines seen in the spectra from distant galaxies were generally redshifted, and that the amount of shift seemed to be approximately proportional to the distance of the galaxy from us. That is, the velocity of a galaxy moving away from us is proportional to its distance dfrom us: (33;4)
This is Hubble’s law, one of the most fundamental astronomical ideas. It was first suggested, in 1927, by Georges Lemaître, a Belgian physics professor and priest, who also first proposed what later came to be called the Big Bang. The con-stant is called the Hubble parameter.
The value of until recently was uncertain by over 20%, and thought to be between 15 and But recent measurements now put its value more precisely at
(that is, per million light-years of distance). The current uncertainty is about 2%, or [ can be written in terms of parsecs (Section 33–3)
as (that is, per megaparsec of distance) with an
uncertainty of about &1.2 km兾s兾Mpc.] 67 km兾s H0 = 67 km兾s兾Mpc
H0
&0.5 km兾s兾Mly. 21 km兾s
H0 = 21 km兾s兾Mly 25 km兾s兾Mly.
H0 H0
v = H0d.
v
v 6 0
v lobs
lrest
Bsource and observer movingaway from each other R
lobs = lrestB1 + v兾c
1 - v兾c,
964
CHAPTER 33 Astrophysics and Cosmology†For light there is no medium and we can make no distinction between motion of the source and motion of the observer (special relativity), as we did for sound which travels in a medium.
HUBBLE’S LAW 500
Wavelength (nm)
Intensity
600 700
500
Wavelength (nm)
Intensity
600 700
Low redshift galaxy spectrum
z 0.004
Higher redshift galaxy spectrum
z 0.104
(a)
(b)
Redshift Origins
Galaxies very near us seem to be moving randomly relative to us: some move towards us (blueshifted), others away from us (redshifted); their speeds are on the order of 0.001c. But for more distant galaxies, the velocity of recession is much greater than the velocity of local random motion, and so is dominant and Hubble’s law (Eq. 33–4) holds very well. More distant galaxies have higher recession velocity and a larger redshift, and we call their redshift acosmological redshift. We interpret this redshift today as due to the expansion of spaceitself. We can think of the originally emitted wavelength as being stretched out (becoming longer) along with the expanding space around it, as suggested in Fig. 33–21. Although Hubble thought of the redshift as a Doppler shift, now we prefer to understand it in this sense of expanding space. (But note that atoms in galaxies do not expand as space expands; they keep their regular size.)
There is a third way to produce a redshift, which we mention for completeness: agravitational redshift. Light leaving a massive star is gaining in gravitational potential energy (just like a stone thrown upward from Earth). So the kinetic energy of each photon,hf, must be getting smaller (to conserve energy). A smaller frequency fmeans a larger (longer) wavelength which is a redshift. The amount of a redshift is specified by the redshift parameter,z, defined as (33;5a)
where is a wavelength as seen by an observer at rest relative to the source, and is the wavelength measured by a moving observer. Equation 33–5a can be written as
(33;5b)
and
(33;5c)
For low speeds not close to the speed of light , the Doppler formula (Eq. 33–3) can be used to show (Problem 32) that zis proportional to the speed of the source toward or away from us:
(33;6)
But redshifts are not always small, in which case the approximation of Eq. 33–6 is not valid. For high zgalaxies, not even Eq. 33–3 applies because the redshift is due to the expansion of space (cosmological redshift), not the Doppler effect. Our Chapter-Opening Photograph, page 947, shows two very distant high zgalaxies,
, which are also shown enlarged.
Scale Factor (advanced)
The expansion of space can be described as a scaling of the typical distance between two points or objects in the universe. If two distant galaxies are a distance apart at some initial time, then a time later they will be separated by a greater distance The scale factoris the same as for light, expressed in Eq. 33–5a:
or
Thus, for example, if a galaxy has then the scale factor is now times larger than when the light was emitted from that galaxy. That is, the average distance between galaxies has become 4 times larger. Thus the factor by which the wavelength has increased since it was emitted tells us by what factor the universe (or the typical distance between objects) has increased. (1 + 3) = 4
z = 3,
d(t)
d0 =
1 + z.
d(t) - d0 d0
= ¢l
l = z
d(t).
t d0
*
z = 8.8 and 11.9
[v V c]
z = lobs - lrest
lrest =
¢l
lrest L
v c.
(v f 0.1 c)
z + 1 = lobs
lrest.
z = lobs
lrest - 1
lobslrest
z = lobslrest- lrest = lrest¢l ,
l (= c兾f),
lrest
SECTION 33–5 The Expanding Universe: Redshift and Hubble’s Law
965
FIGURE 33–21 Simplified model of a 2-dimensional universe, imagined as a balloon. As you blow up the balloon the wavelength of a wave on its surface gets longer (redshifted).Expansion, and the Cosmological Principle
What does it mean that distant galaxies are all moving away from us, and with ever greater speed the farther they are from us? It seems to suggest some kind of explosive expansion that started at some very distant time in the past. And at first sight we seem to be in the middle of it all. But we aren’t. The expansion appears the same from any other point in the universe. To understand why, see Fig. 33–22. In Fig. 33–22a we have the view from Earth (or from our Galaxy). The velocities of surrounding galaxies are indicated by arrows, pointing away from us, and the arrows are longer (faster speeds) for galaxies more distant from us. Now, what if we were on the galaxy labeled A in Fig. 33–22a? From Earth, galaxy A appears to be moving to the right at a velocity, call it represented by the arrow pointing to the right. If we were ongalaxy A, Earth would appear to be moving to the left at velocity To determine the velocities of other galaxies relative to A, we vectorially add the velocity vector, to all the velocity arrows shown in Fig. 33–22a. This yields Fig. 33–22b, where we see that the universe is expanding away from galaxy A as well; and the velocities of galaxies receding from A are proportional to their current distance from A. The universe looks pretty much the same from different points.
Thus the expansion of the universe can be stated as follows: all galaxies are racing away from each otherat an average rate of about per million light-years of distance between them. The ramifications of this idea