Design and experiment of variable rate orchard sprayer based on laser
scanning sensor
Longlong Li
1,
Xiongkui He
1*,
Jianli Song
1,
Yajia Liu
1,
Aijun Zeng
1,
Liu Yang
1,
Chaohui Liu
2,
Zhixiong Liu
3(1. Center for Chemicals Application Technology (CCAT), College of Science, China Agricultural University, Beijing 100193, China; 2. Wuxi Zhongbo Machinery Manufacturing Co., Ltd, Wuxi 214028, China;
3. Beijing Hualing Feichi Information Technology CO., LTD, Beijing 100094, China)
Abstract: During different growth periods, canopy size and density in orchards are variable, which need application conditions (flow rate and air flow) to be adjusted to match the canopy’s characteristics. In order to improve orchard sprayer’s automatic operating performance, an automatic variable-rate orchard sprayer (VARS) fixed with 40 electromagnetic valves and 8 brushless fans was developed based on the canopy’s spatial dimensions. Each solenoid valve and brushless motor can be individually adjusted in real-time through pulse width modulation (PWM) signals emitted by a control system to adjust each nozzle’s spout and fan rotation speed. A high-precision laser scanning sensor (light detecting and ranging, LIDAR) was adopted as the detector to measure the canopy volume using the variable rate algorithm principle. Field experiments were conducted in an apple orchard, and conventional air blast sprayer (CABS) and directed air-jet sprayer (DAJS) were tested as a comparison. Results showed that on average, 46% less spraying solution was applied compared to conventional applications, while penetration rate was similar to DAJS. Normalized deposition in the canopy with variable application was higher than that of conventional applications, indicating that electronic sprayers are more efficient than conventional sprayers. It was also observed that VARS could significantly reduce off-target loss. The field experiment showed that the newly developed variable-rate sprayer can greatly reduce pesticide use and protect the environment for the orchard fruit production, and also provide a reference for design and performance optimization for plant protection machinery.
Keywords: variable rate, orchard, sprayer, spatial dimension, air volume, flow rate, laser scanning sensor, precision agriculture
DOI: 10.25165/j.ijabe.20181101.3183
Citation: Li L L, He X K, Song J L, Liu Y J, Zeng A J, Liu Y, et al. Design and experiment of variable rate orchard sprayer based on laser scanning sensor. Int J Agric & Biol Eng, 2018; 11(1): 101–108.
1 Introduction
As a powerful and effective plant-protection approach to achieve high yield and better quality produce, pesticide spraying is widely adopted in nurseries and orchards[1]. Tree shapes, sizes and canopy density vary greatly in different growth periods and different locations[2]. This variability requires adjusting flow and
blow rate to match the trees with different shapes, heights, canopy volume and density, from location to location. At present, most orchard sprayers are mounted with an axial flow fan, and air flow assists droplets to deposit on the canopy by moving branches and leaves. Conventional orchard sprayers have just one setting for
Received date: 2017-01-08 Accept date: 2017-08-31
Biographies: Longlong Li, PhD candidate, research interest: plant protection machinery and application, Email: [email protected]; Jianli Song, PhD, Associate Professor, research interest: plant protection machinery and application, Email: [email protected]; Yajia Liu, PhD, Associate Professor, research interest: agricultural machinery, Email: [email protected]; Aijun Zeng, PhD, Associate Professor, research interest: agricultural machinery, Email: [email protected]; Yang Liu, Master candidate, research interest: precise pesticide spraying, Email: [email protected]; Chaohui Liu, Manager, research interest: machinery manufacturing, Email: 411947835@ qq.com; Zhixiong Liu, Engineer, research interest: sensor control technology, Email: [email protected].
*Corresponding author: Xiongkui He, PhD, Professor, research interest: plant protection machinery and application. Center for Chemicals Application Technology, China Agricultural University, No.2, Yuanmingyuan West Road, Haidian District, Beijing 100193, China. Tel: +86-10-62731446, Email: [email protected].
continuous operation, and do not have variable rate capability. This single operation mode will result in unnecessary pesticide wastage as well as serious environmental pollution[3].
(PWM) solenoid valve-controlled spray nozzles to adjust spray outputs automatically based on the liner canopy size. Zaman and Salyani[13] also used ultrasonic sensors to measure tree canopy volume, the results showed that sensor-measured canopy volume varied from 82.63% to 128.71% of manually measured volume. Gil et al.[14,15] developed an air-assisted orchard sprayer with ultrasonic detection.
Different kinds of sensors have been used in variable-rate sprayers, and limitations of each detection technology have been reported in several papers. Although infrared detection technology can detect targets, this method does not have variable rate capability. Image capture technology has limitations of real-time operation, as it requires huge amount of data calculations[16]. Ultrasonic detection is sensitive to environmental conditions such as temperature, humidity and tractor speed, which resulting in lower accuracy[2,12,13]. Laser scanning sensors have also been investigated for their better precision and environmental adaptability[17-20]. Their studies concluded that laser sensors can characterize more crop structure information and have higher accuracy than other sensor detection[21-23]. For instance, a variable-rate orchard sprayer designed by Chen et al.[2] used laser scanning sensors to measure canopy density for adjusting each nozzle’s flow rate. Escolà et al.[24] designed a variable rate sprayer based on laser scanning sensors, in this case, the linear model fitted to the theoretical flow rate and the actual flow rate data pairs explains 93.5% of the variability of the samples. These sprayers designed could adjust nozzle’s flow rate according to canopy parameters, but could not change the air volume in real time.
Droplet distribution in fruit orchards is mainly affected by air volume. Thick canopy part requires huge amount of air flow to assist droplets to penetrate leaves and branches, whereas trees such as leatherwood require lesser air volume to reduce potential spray drift. Due to this, researchers pointed out that matching air flow characteristics and orchard canopy size has a direct effect on application[25]. At present, variable spraying studies mainly focus on spraying dose regulation; whereas, relatively few studies have explored variable-air-volume-orchard-sprayer (VAVOS) based on canopy characteristics. Khot et al.[26] developed an air-assisted sprayer adapted with air diverting louvres to control the air leaving the sprayer. The results showed that average air-assistance velocities in the louvre controlled section ranged from 5 m/s to 28 m/s with 0-100% open louvre settings. Landers[27] designed a tower sprayer that the air area of outlet could be adjusted to change the air volume with reducing drift as much as 71% in vineyards. Li et al.[28] studied wind speed at different fan’s rotating speed, outlet area and inlet area based on axial flow air assisted orchard sprayer. Based on the previous research, mostly the air volume was fully adjusted by PTO-central fan rotating speed and the area of outlet, and did not realize adjustment of partly air volume and use-dosage according to canopy size. Restricted by fan’s slow response, the center fan cannot meet the requirement of adjusting air volume in real time, partial air volume and liquid flow rate were adjusted concurrently has not been reported yet.
This paper introduces an automatic variable rate sprayer, with this sprayer, conventional PTO-fan was replaced by the 8 brushless fan with maximal rotating speed of 28 000 r/min, which could fast response once receive signal. Each nozzle’ flow rate and partial air volume could be changed in real-time according to the canopy parameters of fruit tree acquired by laser scanning sensor. By studying deposition distribution in the canopy, penetration, spray
loss in the air and on the ground, the application quality was evaluated compared to two kinds of traditional orchard sprayers equipped with PTO-central fan, and can be used as reference and basis for further improving the prototype.
2 Materials and methods
2.1 Variable rate sprayer
2.1.1 Prototype structure
The prototype was installed with a laser scanning sensor (Sick, Waldkirch, Germany) with a 270° working angle, to detect canopies on both sides of a row. This laser scanner is a fully-automatic divergent laser scanner based on measurement of the time-of-flight (TOF) with an angular resolution of 0.25° in a single shot measurement and 25 Hz detecting frequency in a range of up to 18 m. Based on canopy volume, air flow and chemical solution could be adjusted in real-time. The sensor was installed in the center between tank and tractor. The control system was developed with C++ programming language running on a laptop computer, and supported manual and automatic adjustments. In manual mode, operators input nozzle flow and air flow parameters for normal operations without sensors. The variable rate sprayer (VARS) was equipped with 8 individual and adjustable atomization units (4 on each side of the prototype), each with 5 nozzles and 1 brushless fan arranged individually. The atomization units had telescopic arms to ensure they could be adapted to different orchard planting patterns. Before operating, the arm length was adjusted based on the canopy shape to ensure that atomization units are at the appropriate distance from canopy to make sure the nozzle’s atomization height could cover the corresponding canopy segment. An 8 kW gasoline generator (ZM10000YEC, Zanma Co., Ltd, China) was adopted for power supply, and the transformer module was used to convert 220V AC generated from the generator into 12V DC (Figure 1).
a. Variable rate sprayer with laser scanning sensor
b. Interface of control system
2.1.2 Actuating elements
Each nozzle was connected with one solenoid valve. The output of the prototype’s 40 nozzles could be adjusted individually based on the solenoid valves' pulse width modulation (PWM) signals. The relationship between nozzle flow rate and duty cycle is shown in the following equation (25 Hz, 0.3 MPa):
Q=1.25x–0.042 (1)
where, Q is the flow rate per nozzle, L/min; x is the solenoid valve’s duty cycle, %.
Brushless DC fan (FeiJun Motor Technology Co., Ltd., Shenzhen, China) was selected as airflow actuator to partly achieve variable air volume function, while the control system regulated rotation speed by changing the fan’s PWM duty cycle. The fan impeller’s diameter is 85 mm, while its maximum rotating speed is 28 000 rpm. The fan’s duty cycle is converted into outlet air velocity (Figure 2) based on the following equation:
V=15.625ln(r)+53.426 (2) where, V is outlet air velocity, m/s; r is fan’s duty cycle, %.
Figure 2 Relationship between air velocity and fan’s duty cycle 2.1.3 Variable control principle
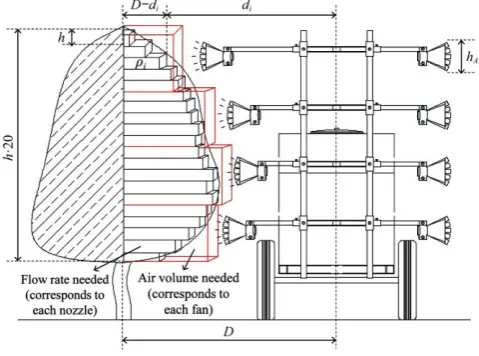
Keeping in mind that canopy density in different locations within the fruit orchard is not identical, the principle of variable rate algorithm was based on estimating canopy volume at 0.15 m cross-sections, and appropriate flow rate and air flow in proportion to the volume were measured by the control system, similar to what proposed by Chen et al.[29]. The detected tree canopy was divided equally into multiple rectangular canopy segments in the vertical direction, with a 0.15 m height for each segment.
Figure 3 shows the prototype’s operating principle. Horizontal distance from the sprayer’s axis to the canopy surface (di) was measured by laser scanning sensor, obtaining the crop
width for each canopy segment of the total tree height, according to Equation (3):
Wi=D–di (3)
where, Wi is the width (depth) of ith canopy segment, m; D is
distance between the sprayer’s axis and tree center, m, equal to 1/2 row spacing; di is horizontal distance between the sprayer’s axis
and canopy surface, m.
Each canopy segment's density was calculated according to the following equation[30]:
0 max n
j j i
W
W n
(4)
where, ρi is the ith canopy segment’s density (0-1); Wj is width
(depth) of every data point in ith canopy segment, m; n is number of
effective data points in ith canopy segment; Wmax is maximum width
(depth) of ith canopy segment, m.
As shown in Figure 3, each segment of the tree canopy corresponds to one nozzle of the variable-rate sprayer, and every fan controls the air flow for 5 canopy segments. When the sprayer is operating, the canopy segment’s volume is determined by the controller based on data scanned by the sensor. These measurements are then introduced automatically into the software developed on C++ to calculate corresponding flow rate and air velocity for individual nozzle and fan, according to the following equations[27,31]:
q=60hWiVf ρiu (5)
where, qis required flow rate of ith canopy segment, L/min; h is average height of canopy segment covered by each nozzle, m, h = 0.15 m; Vfis travel speed, m/s; u is solution applied per unit crop
volume, in L/m3, u = 0.1 L/m3 [32].
max max
(5 )( ) ( ) 2
A i f i s
h h W V ρ kk
V
S
(6)
where, V is the outlet air velocity, m/s; hA is the atomization unit’s
outlet height, m; (Wi)max is the maximal width of 5 canopy
segments corresponding to 1 fan, m; (ρi)maxis maximal density of 5
canopy segments; k is coefficient of atmospheric attenuation, k = 1;
ks is coefficient of substitution space, ks = 0.6[25]; S is outlet area, m2,
S = 0.008 m2.
Before treatment, some spray parameters (row spacing, sensor installation height, trunk height below canopy) need to be input manually. Totally, 48 individual PWM signals with independent duty cycles were generated by monolithic integrated circuits for different nozzles and fans, based on the data calculated by the laptop computer.
Figure 3 Principle of prototype’s variable application
2.2 Field tests
2.2.1 Experimental conditions
4a); the second reference equipment was a directed air-jet sprayer (DAJS, Figure 4b) equipped with a centrifugal fan and 4 individual air spouts on each side, connected to the air outlet by flexible ducts. The treatment parameters for the 3 sprayers are listed in Table 2.
Table 1 Meteorological measurement range during spray application
Date Temperature /°C
Relative humidity/%
Wind speed /m·s-1
Wind direction/(°)
09-22 21.5-24.6 43.6-54.3 1.2-2.1 17-52
09-23 18.0-22.8 46.8-55.6 1.7-2.3 25-43
a. Conventional air blast sprayer (CABS) b. Directed air-jet sprayer (DAJS)
Figure 4 Classical orchard sprayers with a PTO-central fan
Table 2 Sprayers characteristics and treatment parameters
2.2.2 Treatments
Two blocks (I & II, 667 m2 for each block) were established in the center of the orchard, separated from each other by 50 m. Three trees were selected as target trees in each block. Measurements were conducted in accordance with ISO Standard (ISO 22522, 2007).
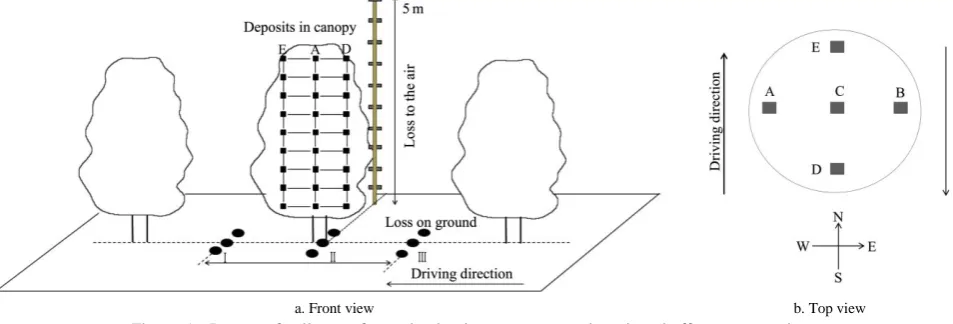
Canopy deposition test was conducted in block I, and three typical apple trees were chosen as target crop. Based on their height, width and depth, each target tree was divided into sampling sections. As shown in Figure 5, there were 9 different sections based on height (from 0.65-3.45 m at intervals of 0.35 m). In each section, three sampling sites were arranged across the depth (A, C, B) and 2 sampling sites were arranged along the row (D, E). A metal wire screen (7.5 cm×2.5 cm) was chosen as the deposit collector, which was attached to the sampling sites. Nine mylar cards (10 cm×10 cm) were placed on the ground under canopies and gaps between trees, to evaluate deposition loss on the ground. Both-side application was conducted based on the working parameters (Table 1). Treatments were replicated thrice.
In order to explore profile modeling matching effects of sprayer application and fruit tree canopy, 50 typical leaves were
collected randomly from different parts of trees in the block, and their surface area (one side only) was measured with a leaf area meter (YMJ-B, China) to determine the average surface area of one leaf. The number of leaves were counted according to the layout of the sample collectors, and combined with the average area[15]; the average total leaf area per height section of 0.35 m was calculated. The calculated area of each piece of leaf was 21.4 cm2.
The second experiment was conducted to evaluate deposit penetration and off-target loss in the air in block II. Only 3 sampling sites (A, C and B) were arranged across the depth along 9 height sections. Sampling sites for spray loss in the air were placed on the vertical frame at intervals of 0.5 m (Figure 5). The frame was located on the row behind the tree at the far side of spraying[35]. The test involved spraying from one side only based on the working parameters.
The spray mixture contained 2.5 g/L of water-soluble food dye as the tracer (Tartrazine, Hanghai Dyestuffs Research Institute Co., Ltd.). After completing the experiment, samples were collected and put into a separate plastic snap-seal container within 15 min of spray application, after which they were placed in a dark container and stored in a refrigerator for further processing.
a. Front view b. Top view
Figure 5 Layout of collectors for evaluating in-canopy spray deposit and off-target spray loss 2.2.3 Analysis and results
Spectrophotometric technique was applied to measure the deposit on unitary target in the laboratory. Each artificial target
was washed with distilled water and optical absorbance of the washing mixture was measured with a spectrophotometer (Model 722S, Yidian Ltd.) at a wavelength of 426 nm. The deposits on
Sprayers Pressure/MPa Nozzles each side Nozzle type Flow rate per nozzle /L·min-1
Travel speed /km·h-1
Application rate /L·hm-2
Air-velocity of outlet /m·s-1
CABS 0.3 5 TR-80-03 1.22 3.60[34] 508 22.2
DAJS 0.3 4 ST-110-04 1.58 3.60 526 21.5
the target were then calculated as follows[36]: 1000 W S
a
V FL d
NFL S
(7)
where, d is deposit per square centimeter of artificial target surface,
μL/cm2; V
Wis water quantity used to wash each sample target, mL;
FLS is absorbance of sample washing solution; N is dilution
multiple of mixture in the tank; FLa is absorbance of mixture in the
tank; S is target surface (one side only), cm2; surface of metal wire screen and mylar card used in the study were 18.75 cm2 and 100 cm2, respectively.
Artificial targets were cleaned before the test, while no correction was necessary to compensate for background deposit. Taking into account different application rates of the three sprayers, and to keep comparisons between treatments consistent, the deposits in the canopy of the first experiment were normalized[37]. Firstly, the unit of deposits obtained (μL/cm2, Equation (7)) was transformed into μg/cm2 (Equation (8)). Normalized deposit was calculated according to Equation (9)[38]:
-3
10
t CS
d dT (8)
5
10
t n
CS
d d
VT
(9)
where, dn is normalized tracer deposit; dt is actual deposit per unit
area of leaf surface, μg/cm2; V is spray application rate, L/hm2; T
CS
is tracer concentration in the tank’s spray mixture, mg/L. Normalized deposit method has been used by scholars in many studies[39-41], and it provides an effective means to compare different sprayers or different application technologies based on the applied tracer.
IBM SPSS Statistics V17 (IBM Analytics Inc., Armonk, New York, USA) was used to conduct statistical analysis. Significant variance effects followed by Duncan’s Multiple Range Test were applied at level of p<0.05.
3 Results and discussion
3.1 Leaf area distribution
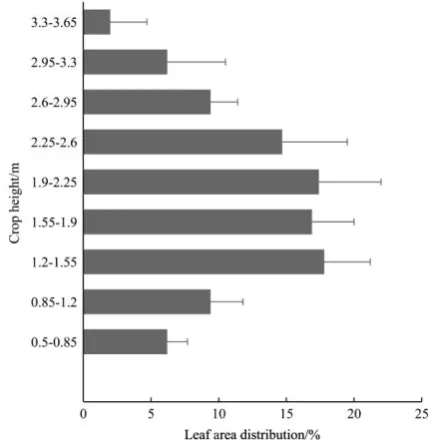
Leaf area distribution along height is shown in Figure 6, it is indicated that the leaves are mainly distributed in the middle part of the canopy (1.2-2.6 m, 17.8% at intervals of 0.35 m) and minimum (2.1%) at the top part (3.3-3.65 m). The disparate solution and air volume discharged automatically from the electronic sprayer are required to match leaf density’s variability across height.
3.2 Savings
One of the important reasons for developing the variable rate sprayer was to reduce applied solution quantity. For a 100 m spraying operation for each of the 3 sprayers, CABS and DAJS consumed 20.3 L and 21.0 L, respectively, while the variable system only consumed 11.4 L. Thus, the electronic sprayer’s potential average savings can be estimated at approximately 46%
compared to classical orchard sprayers. Also, based on the solution applied along the 100 m length, VARS application rate in the apple orchard can be estimated at 285 L/hm2.
Figure 6 Total leaf area distribution in a 0.35 m vertical tree section
3.3 Deposit on the canopy
The actual tracer concentration in the tank is shown in Table 3, and normalized deposits of the three treatments were calculated according to Equations (8) and (9). Table 4 presents actual and normalized deposits; the variable rate application method showed lower deposits on targets due to automatically reduced spray rate, to match the canopy. And VARS’ normalized deposits were higher than the other two classical sprayers with centrifugal fan in all cases, except value obtained at position D. According to the application efficiency raised by Gil et al.[15], variable application is more efficient than conventional application when applied in the same orchard. For variable application, deposits in the south side of the crop with normalized deposition (0.72) were less than the conventional method. This is probably because of spraying delay in the application process.
Table 3 Tracer dose and actual tank concentration for different treatments
Treatment Tt Tr F (Tr /Tt)
CABS 2.50 2.32 0.928
DAJS 2.50 2.30 0.920
VARS 2.50 2.59 1.036
Note: Tt theoretical tracer concentration in the tank; Tr, actual tracer concentration in the tank.
Table 4 Deposition (actual and normalized) distribution on different parts measured in the canopy
Treatment Application rate/L·hm-2
Actual deposit d/μL·cm-2 Normalized deposit dn
D E A C B Total D E A C B Total
CABS 508 3.87 4.46 5.52 3.40 5.99 4.65 0.76 0.88 1.09 0.67 1.18 0.92b
DAJS 526 4.29 4.78 5.76 4.16 5.51 4.90 0.81 0.90 1.09 0.79 1.04 0.93b
VARS 285 2.04 3.09 4.01 2.82 3.94 3.18 0.72 1.09 1.42 1.00 1.39 1.12a
Spatial distribution graphics for normalized deposit within the canopy was analyzed with Contour function of Matlab software (MathWorks, USA). The results are shown in Figure 7. In
with the two classical air blast sprayers.
Figure 7 Spatial distribution of normalized deposit (dn) for three
applications
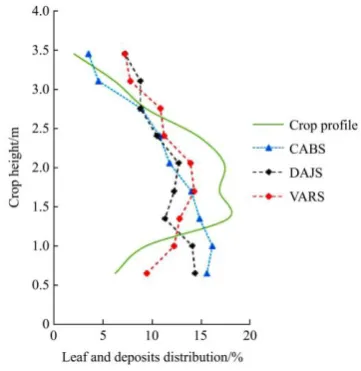
Figure 8 presents relationship between canopy profile (leaf area distribution along height), and total amount of deposition measured at each tree section for different sprayers, with average value for three repetitions. In case of CABS, deposition at the bottom parts was higher than upper parts due to radial spray pattern. Deposition distribution for DAJS at different heights was similar, except for heights at the same level of spouts. Variable rate application followed an arc line, with highest deposition in middle parts, which generally presents better adaptation to leaf area distribution.
3.4 Penetration
Table 5 shows the three sprayers’ capability, in terms of
deposition in the inner part of the tree. The samples along the height were divided into 5 zones (Upper, Middle-Upper, Middle, Middle-Bottom, Bottom), and relative deposit distribution of 3 depths are shown in Figure 9. In case of CABS, penetration was significantly worse than other application methods, especially in the upper parts, with 17.4% at the far side of spraying (side B). In general, results obtained with variable application and directed air-jet application were close in terms of penetration at 22.3% and 20.4%, respectively, for side B.
Figure 8 Vertical deposits (d) and its relation to leaf distribution (% of leaf area)
Table 5 Deposition distribution for the three applications
μL·cm-2
Crop Height
CABS DAJS VARS
A C B Total A C B Total A C B Total
Upper 2.62 1.06 0.58 1.42c 2.37 2.21 1.34 1.97c 1.66 0.99 0.95 1.26c
Middle-upper 4.16 2.45 1.04 2.55b 3.94 2.47 1.88 2.76b 2.6 2.07 1.24 1.97a
Middle 3.69 2.57 1.85 2.70a 4.81 2.09 1.54 2.81b 3.21 1.86 0.99 2.02a
Middle-bottom 4.14 3.66 1.08 2.96a 4.44 2.26 1.53 2.74b 3.19 1.27 1.27 1.91a
Bottom 4.09 2.58 2.21 2.96a 4.83 2.93 1.97 3.24a 2.41 1.42 1.25 1.69b
Total 3.74 2.46 1.35 2.52b 4.08 2.39 1.65 2.71b 2.61 1.52 1.14 1.76b
a. CABS b. DAJS c. VARS
Figure 9 Relative deposition on three sample crop sections
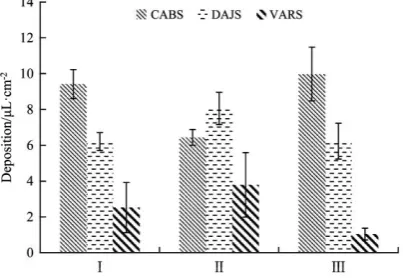
3.5 Loss in the air
Spray losses in the air for the three different sprayer treatments in the orchard are given in Table 6. VARS had smaller amount of spray loss in the air compared to the other sprayers tested, especially at height from 0-1.5 m. This fact can be explained as a
application was 23.2% and 42.7% less compared to the other two sprayers, respectively.
Table 6 Distribution of spray loss in the air for different treatments
μL·cm-2
Treatment
Crop height
Total 0-1.5 m 1.5-3.5 m 3.5-5 m
CABS 1.45 0.89 0.12 0.82
DAJS 1.59 1.32 0.38 1.10
VARS 0.85 0.91 0.14 0.63
3.6 Loss on the ground
Due to its radial spray pattern and position of lower nozzles, spraying losses on the ground for conventional air blast sprayer was 8.6 μL/cm2, which was much higher than for the other two sprayers. Also, losses for the two classical sprayers were higher than the prototype. In case of VARS, results in Figure 10 indicate that higher losses were observed under the canopy, and losses between trees were more than expectation. This can probably be explained by the spray system’s lag time in relation to the program calculations, or even due to big droplets leaking from the nozzle when the solenoid valves controlled by PWM signals were rapidly turned on or off.
Figure 10 Distribution of loss on the ground for different treatments
4 Conclusions
An electronic orchard sprayer adapted with variable flow rate and adjustable air-assisted flow control, was developed by integrating high-precision laser scanning sensor, multi-variable control system and a composite atomization unit. A variable rate algorithm was developed to compute the canopy volume based on values scanned by laser scanning sensor to modify spraying solution and air volume. This allowed real-time adjustments to match tree canopy structure. Solenoid valves and brushless motors were used to control each individual nozzle’s spout and fan’s rotation speed based on pulse width modulation signals. Results showed that compared to the other two classical sprayers, variable rate application in an apple orchard saved about 46% of the solution. Normalized deposition on the canopy using variable sprayer was higher than conventional application, which indicates that the electronic sprayer is more efficient than conventional sprayers. Despite the small brushless fan, variable application and directed air-jet application were close in terms of penetration at 22.3% and 20.4% respectively, at the far side of spraying. Also, variable application could reduce off-target losses, with 42.7% reduction in the air and 67.4% reduction on the ground.
Further field experiments during various growth periods are required to evaluate the sprayer’s equivalent performance for different canopy structures, based on the savings and deposition distribution. At the same time, further study of the biological control effect needs to be conducted in future to provide data support for improving the equipment.
Acknowledgements
The authors acknowledge that this work was financially supported by Special Fund for Agro-scientific Research in Public Interest (No.201503130); Beijing Science and technology plan projects (No. D171100002317003); and National Natural Science Foundation of China (31470099). Also, Zhichong Wang, Luchen Lan, Jinyao Li, Xiaoming Jia and Xinjie Li’s contributions to this experimental work are highly appreciated.
[References]
[1] Li C, Zhang X H, Jiang J H, Hu Y Y. Development and experiment of riser air-blowing sprayer in vineyard. Transactions of the CSAE, 2013; 29(4): 71–78. (in Chinese)
[2] Chen Y, Zhu H H, Erdal O, Richard R K. An experimental variable-rate sprayer for nursery and orchard applications. ASABE Annual Meeting, 2011; Paper No: 1110497.
[3] Yang Z, Niu M M, Li J, Xu X, Xu J T, Chen Z C. Design and experiment of an electrostatic sprayer with on-line mixing system for orchard. Transactions of the CSAE, 2015; 31(21): 60–67. (in Chinese)
[4] Qiu B J, Yan R, Ma J, Guan X P, Ou M X. Research progress analysis of variable rate sprayer technology. Transactions of the CSAM, 2015; 46(3): 59–72. (in Chinese)
[5] Wang W Z, Hong T S, Li J, Zhang F G, Lu Y C. Review of the pesticide precision orchard spraying technologies. Transactions of the CSAE, 2004; 20(6): 78–80. (in Chinese)
[6] He X K, Yan K R, Chu J Y, Wang J, Zeng A J, Liu Y J. Design and testing of the automatic target detecting, electrostatic, air assisted, orchard sprayer. Transactions of the CSAE, 2003; 19(6): 78–80. (in Chinese) [7] Esau T, Zaman Q U, Chang Y, Schumann A W, Percival D C.
Spot-application of fungicide for wild blueberry using an automated prototype variable rate sprayer. Precision Agriculture, 2014; 15(2): 1–15. [8] Solanelles F, Escola A, Planas S, Rosell J R, Camp F, Gracia F. An
electronic control system for pesticide application proportional to the canopy width of tree crops. Biosystems Engineering, 2006; 95(4): 473–481. [9] Solanelles F, Planas S, Escolà A, Rosell J R. Spray application efficiency of an electronic control system for proportional application to the canopy volume. Aspects Applied Biology, 2002; 66:139–146.
[10] Zhai C Y, Zhao C J, Wang X, Zou W, Mao Y J, Zhang R. Probing method of tree spray target profile. Transactions of the CSAE, 2011; 26(12): 173–177. (in Chinese)
[11] Jeon H Y, Zhu H. Development of a variable-rate sprayer for nursery liner applications. Transactions of the ASABE, 2012; 55(1): 303–312. [12] Jeon H Y, Zhu H, Derksen R, Ozkan E, Krause C. Evaluation of
ultrasonic sensor for variable-rate spray applications. Computers and Electronics in Agriculture, 2011; 75(1): 213–221.
[13] Zaman Q U, Salyani M. Effects of foliage density and ground speed on ultrasonic measurement of citrus tree volume. Applied Eng. Agric., 2004; 20(2): 173–178.
[14] Giles D K, Delwicke M J, Dodd R B. Control of orchard spraying based on electronic sensing of target characteristics. Transactions of the ASAE, 1987; 30(6): 1624–1630.
[15] Gil E, Escolà A, Rosell J R, Planas S, Val L. Variable rate application of plant protection products in vineyard using ultrasonic sensors. Crop Protection, 2007; 26(8): 1287–1297.
[16] Tanaka T, Yamaguchi J, Takeda Y. Measurement of forest canopy structure with a laser plane range-finding method - development of a measurement system and applications to real forests. Agricultural & Forest Meteorology, 1998; 91(3-4): 149–160.
[17] Campoy J, Gonzalez-Mora J, Dima C S. Advanced sensing for tree canopy modeling and precision spraying. ASABE Meeting, 2010; Paper No: 1009470.
tree row LIDAR-volume and leaf area density for fruit orchards and vineyards obtained with a LIDAR 3d dynamic measurement system. Agricultural and Forest Meteorology, 2013; 171-172(3): 153–162. [19] Lee K H, Ehsani R. Comparison of two 2D laser scanners for sensing
object distances, shapes, and surface patterns. Computers and electronics in agriculture, 2008; 60(2): 250–262.
[20] Van der Zande D, Hoet W, Jonckheere I, van Aardt J, Coppin P.. Influence of measurement set-up of ground-based LIDAR for derivation of tree structure. Agricultural and Forest Meteorology, 2007; 141(2-4): 147–160.
[21] Wei J, Salyani M. Development of a laser scanner for measuring tree canopy characteristics: Phase 1. Prototype development. Transactions of the ASAE, 2004; 47(6): 2101–2107.
[22] Wei J, Salyani M. Development of a laser scanner for measuring tree canopy characteristics: Phase 2. Foliage density measurement. Transactions of the ASAE, 2005; 48(4): 1595–1601.
[23] Wheaton T A, Tumbo S D, Salyani M, Whitney J D, Salyani M. Investigation of laser and ultrasonic ranging sensors for measurements of citrus canopy volume. Applied Engineering in Agriculture, 2002; 18(3): 367–372.
[24] Escolà A, Rosell-Polo J R, Planas S, Gil E, Pomar J, Camp F, et al. Variable rate sprayer. Part 1 – Orchard prototype: design, implementation and validation. Computers and Electronics in Agriculture, 2013; 95(1): 122–135.
[25] Zhou L F, Fu X M, Ding W M, Ding S M, Chen J, Chen Z J. Design and experiment of combined disc air-assisted orchard sprayer. Transactions of the CSAE, 2015; 31(10): 64–71. (in Chinese)
[26] Khot L R, Ehsani R, Albrigo G, Larbi P A, Landers A. Air-assisted sprayer adapted for precision horticulture: Spray patterns and deposition assessments in small-sized citrus canopies. Biosystems Engineering, 2012; 113(1): 76–85.
[27] Landers A J. Innovative technologies for the precise application of pesticides in orchards and vineyards. Aspects of Applied Biology, 2008; 86: 343–348.
[28] Li L L, He X K, Yao Q, Song J L, Liu Y J, Zeng A J. Design of VAV system of air assisted sprayer in orchard and experimental study. Aspects of Applied Biology, 2016; 132: 159–168.
[29] Chen Y, Zhu H P, Ozkan H E. Development of LIDAR-guided sprayer to
synchronize spray outputs with canopy structures. ASABE Annual International Meeting, 2011; Paper No: 1110496.
[30] Chen Y, Zhu H, Ozkan H E. Real-time tree foliage density estimation with laser scanning sensor for variable-rate tree sprayer development. ASABE Annual Meeting, 2013; Paper No: 131596009.
[31] Dai F F. Selection and calculation of the air-blowing sprayer. Plant Protection, 2008; 34(6): 124–127. (in Chinese)
[32] Jenkins E, Hines R. Chapter 4: spraying fruit. In fruit crop pest management: A guide for commercial applicators category 1c. East Lansing, Mich.: Michigan State University, 2003; pp.25–42.
[33] Ding T H. Research on double fans double channel orchard sprayer airflow field characteristic. Master dissertation. Beijing: Chinese Academy of Agricultural Sciences, 2016. (in Chinese)
[34] Qiu W, Zhao S Q, Ding W M, Sun C D, Lu J, Li Y N, et al. Effects of fan speed on spray deposition and drift for targeting air-assisted sprayer in pear orchard. Int J Agric & Biol Eng, 2016; 9(4): 53–62.
[35] Holownicki R, Doruchowski G, Godyn A, Swiechowski W. Variation of spray deposit and loss with air-jet directions applied in orchards. Journal of Agricultural Engineering Research, 2000; 77 (2): 129–136.
[36] Ma N. Study of spray characteristics of Anti-floating nozzle and standard fan-shaped nozzle. Master dissertation. Beijing: China Agricultural University, 2012. (in Chinese)
[37] Pascuzzi S, Cerruto E, Manetto G. Foliar spray deposition in a “tendone” vineyard as affected by airflow rate, volume rate and vegetative development. Crop Protection, 2017; (91): 34–48.
[38] Llorens J, Gil E, Llop J, Escolà A. Variable rate dosing in precision viticulture: Use of electronic devices to improve application efficiency. Crop Protection, 2010; 29(3): 239–248.
[39] Cross J V, Walklate P J, Murray R A, Richardson G M. Spray deposits and losses in different sized apple trees from an axial fan orchard sprayer: 1. Effects of spray liquid flow rate. Crop Protection, 2001; 20(4): 13–30. [40] Viret O, Siegfried W, Holliger E, Raisigl U. Comparison of spray
deposits and efficacy against powdery mildew of aerial and ground-based spraying equipment in viticulture. Crop Protection, 2003; 22(8): 1023–1032.