Proteomic Analysis of the Systemic Response
to Radiographic Contrast Media
Juan Martinez
&Warren K. Laskey
&Cheri Wells
&Armin Foghi
&Sarah Rohde
&Mark Ricciardi
&Charlotte Mobarak
Published online: 15 July 2010
#Springer Science+Business Media, LLC 2010
Abstract
Introduction
Radiographic contrast media (RCM) have
numerous effects on the hemostatic system, inflammatory
pathways, and vascular endothelium. Given the increasing
number of high-risk patients undergoing radiographic
procedures, more information regarding the systemic effects
of RCM is needed.
Methods
Blood samples prior to baseline, 4 and 24 h following
elective coronary angiography in 10 patients, were subjected to
matrix-assisted laser desorption/ionization time-of-flight mass
spectrometry. Data are presented as the ratio of the protein
mass at 4 (iTRAQ4) and 24 h (iTRAQ24) compared to
baseline. A ratio >1.0 and a ratio <1.0 indicate production and
consumption, respectively, relative to baseline.
Results
In this sample, we identified 102 proteins with a
confidence interval of
≥
90%. Six proteins were identified at
each time point in all patients. Of the proteins identified,
apolipoprotein A-I, apolipoprotein A-II, complement C3,
fibrinogen beta chain, immunoglobulin
α, and prothrombin
revealed an iTRAQ ratio <1.0 at 4 h when compared to
baseline (all with
p
value <0.05) and a trend toward
baseline levels at 24 h.
Conclusions
Systemic administration of RCM results in a
variety of alterations to the proteome. Of interest, there is
activation of the thrombotic and inflammatory pathways as well
as an interaction with lipoprotein metabolism. These changes
are most pronounced at 4 h but may persist through 24 h and
may be of clinical relevance in patients at risk for
thrombotic-and inflammatory-mediated consequences of atherosclerosis.
Keywords
Proteomics . Radiographic contrast media .
Coronary angiography . iTRAQ labeling .
Mass spectrometry
Introduction
Use of radiographic contrast media (RCM) continues to
expand in the realm of cardiovascular medicine [
1
,
2
].
Given its essential role in diagnostic and therapeutic
radiographic procedures, it is critical to add to our
knowledge the effects of RCM on blood proteins and
formed elements of the blood. Studies evaluating the effects
of RCM on the cellular components of blood [
3
–
8
] and
vascular endothelium [
9
,
10
] have produced inconclusive
and conflicting results with, consequently, unclear clinical
relevance. Despite the overall safety profile documented by
large-scale studies of contrast agents [
11
,
12
], there
continues to be controversy surrounding the
pro-inflammatory [
13
–
15
] and pro-thrombotic potential of
RCM [
16
–
18
]. The increasing number of high-risk patients
undergoing diagnostic and therapeutic procedures increases
the potential for higher rates of adverse effects associated
with RCM. Accordingly, a broader understanding of the
effects of RCM on the
“
proteome
”
is of potential clinical
relevance. We conducted an exploratory feasibility study in
an unselected group of patients referred for coronary
angiography and, using high-throughput proteomic
analy-sis, analyzed serum plasma prior to and following
admin-istration of RCM.
J. Martinez
:
W. K. Laskey (*):
C. Wells:
A. Foghi:
M. RicciardiDepartment of Medicine—Division of Cardiology, University of New Mexico Health Sciences Center, Albuquerque, NM, USA
e-mail: [email protected]
S. Rohde
:
C. MobarakMaterials and Methods
Patient Population
Patients referred for elective coronary angiography were
candidates for study. Those patients meeting inclusion
criteria were approached for participation, and written
consent was obtained in accordance with University of
New Mexico
—
Health Sciences Center Human Research
Protections Office requirements.
A total of 10 patients provided the sample for this study.
Baseline characteristics are shown in Table
1
. The intensive
analytic requirements and financial cost associated with the
processing of each sample are the justification for the
feasibility nature of this study. In addition, the magnitude of
observed changes at the designated time intervals can be
used in power analysis for future study designs.
The non-ionic, iso-osmolar agent, Iodixanol-320
(Visi-paque®, GE Healthcare), was used in all patients. Blood
sampling occurred prior to 4 and 24 h following RCM. No
complications were observed with cardiac catheterization.
In accordance with recommendations by the Human
Pro-teome Organization Plasma ProPro-teome Project [
19
], plasma
samples were analyzed preferentially over serum due to less
degradation of the sample
ex vivo
, and larger numbers of high
abundance peptides were present only in serum and not in
plasma. P100 tubes from BD (Becton-Dickenson) were used to
collect plasma. A sterile blood collection tube was pre-loaded
with protease inhibitors, as well as a self-contained system for
removing red blood cells and platelets. Samples were collected
according to the manufacturer
’
s protocol, placed in 750-μL
aliquots and stored frozen at
−
80°C until analysis.
Sample Analysis
Sample Treatment and iTRAQ Labeling
The protein expression profiling process was performed in
a series of three steps. The samples were first digested and
Table 1 Baseline characteristics for all patients
Demographic factors Patient data (n=10)
Age 49±14
Male (%) 7 (70)
Risk factors (%)
Chronic smoker 4 (40)
Diabetes mellitus 4 (40)
Hypercholesterolemia 9 (90)
Hypertension 4 (40)
Illicit drug use 1 (10)
Aspirin therapy (%) 10 (100)
Statin therapy (%) 8 (80)
Chronic kidney disease 0 Coronary artery disease (%) 9 (90) History of coronary artery bypass (%) 2 (20) Amount of Contrast used (ml) 247±198
Table 2 All proteins detected with a≥90% confidence interval (CI)
(O00159) Myosin Ic (myosin I beta; MMI-beta; MMIb) (O00411) DNA-directed RNA polymerase (MtRPOL) (O15182) Centrin 3
(O43184) ADAM 12 (A disintegrin and metalloproteinase domain 12)
(O43680) Transcription factor 21 (podocyte-expressed 1; Pod-1; epicardin; capsulin) (O60241) Brain-specific angiogenesis inhibitor 2
(O60449) Lymphocyte antigen 75 (DEC-205; CD205 antigen; gp200-MR6)
(O60902) Short stature homeobox protein 2 (paired-related homeobox protein SHOT)
(O75427) Leucine-rich repeats and calponin homology domain-containing protein 4 (Leucine-rich neuronal protein) (O75717) WD repeat and HMG-box DNA-binding protein 1 (acidic nucleoplasmic DNA-binding protein 1 (And-1))
(O96033) Molybdenum cofactor synthesis protein 2 small subunit (molybdopterin-synthase small subunit; MOCS2A; MOCO1-A) (P00450) Ceruloplasmin (ferroxidase)
(P00734) Prothrombin (coagulation factor II) (P00738) Haptoglobin
(P01023) Alpha-2-macroglobulin (Alpha-2-M)
(P01024) Complement C3 [contains: C3a anaphylatoxin] (P01028) Complement C4 [contains: C4a anaphylatoxin; C4b] (P01266) Thyroglobulin
(P01834) Ig kappa chain C region (P01842) Ig lambda chain C region (P01871) Ig mu chain C region (P01876) Ig alpha-1 chain C region (P01877) Ig alpha-2 chain C region (P02023) Hemoglobin beta chain (P02042) Hemoglobin delta chain (P02647) Apolipoprotein A-I (Apo-AI)
(P02652) Apolipoprotein A-II (Apo-AII; ApoA-II)
(P02671) Fibrinogen alpha/alpha-E chain [contains: fibrinopeptide A] (P02675) Fibrinogen beta chain [contains: fibrinopeptide B]
(P02743) Serum amyloid P-component (SAP; 9.5S alpha-1-glycoprotein) (P02748) Complement component C9
(P02751) Fibronectin (FN; cold-insoluble globulin (CIG))
(P02763) Alpha-1-acid glycoprotein 1 (AGP 1; orosomucoid 1; OMD 1) (P02765) Alpha-2-HS-glycoprotein (fetuin-A; Alpha-2-Z-globulin) (P02766) Transthyretin (Prealbumin; TBPA; TTR; ATTR) (P02768) Serum albumin
(P02774) Vitamin D-binding protein (DBP; group-specific component; Gc-globulin; VDB) (P02787) Serotransferrin (transferrin; siderophilin; Beta-1-metal binding globulin) (P02790) Hemopexin (beta-1B-glycoprotein)
(P04004) Vitronectin (serum spreading factor; S-protein; V75) [contains: vitronectin V6 (P04196) Histidine-rich glycoprotein (histidine-proline rich glycoprotein (HPRG)) (P04196) Histidine-rich glycoprotein (histidine-proline rich glycoprotein (HPRG)) (P04206) Ig kappa chain V-III region GOL (rheumatoid factor)
(P04217) Alpha-1B-glycoprotein (alpha-1-B glycoprotein) (P04220) Ig mu heavy chain disease protein (BOT)
(P04264) Keratin, type II cytoskeletal 1 (cytokeratin 1; K1; CK 1; 67-kDa cytokeratin) (P08912) Muscarinic acetylcholine receptor M5
(P13671) Complement component C6
(P25054) Adenomatous polyposis coli protein (APC protein)
(P29371) Neuromedin K receptor (NKR; neurokinin B receptor; NK-3 receptor; NK-3R; Tachykinin receptor 3) (P30307) M-phase inducer phosphatase 3 (dual specificity phosphatase Cdc25C)
(P30968) Gonadotropin-releasing hormone receptor (GnRH receptor; GnRH-R) (P35789) Zinc finger protein 93 (zinc finger protein HTF34; Fragment) (P40426) Pre-B-cell leukemia transcription factor-3 (homeobox protein PBX3) (P49715) CCAAT/enhancer binding protein alpha (C/EBP alpha)
(P56975) Pro-neuregulin-3 (Pro-NRG3) [contains: neuregulin-3 (NRG-3)] (P56975) Pro-neuregulin-3 (Pro-NRG3) [contains: neuregulin-3 (NRG-3)] (P57678) Component of gems 4 (Gemin4; p97)
(P61247) 40S ribosomal protein S3a
(Q00975) Voltage-dependent N-type calcium channel alpha-1B subunit
(Q01581) Hydroxymethylglutaryl-CoA synthase, cytoplasmic (HMG-CoA synthase)
(Q08289) Voltage-dependent L-type calcium channel beta-2 subunit (CAB2; calcium channel, voltage-dependent, beta 2 subunit; Lambert–Eaton myasthenic syndrome antigen B; MYSB)
(Q12981) BCL2/adenovirus E1B 19-kDa protein-interacting protein 1
(Q13424) Alpha-1-syntrophin (59-kDa dystrophin-associated protein A1, acidic component 1; Pro-TGF-alpha cytoplasmic domain-interacting protein 1; TACIP1; syntrophin 1)
(Q13772) Nuclear receptor coactivator 4 (NCoA-4; 70-kDa androgen receptor coactivator; 70-kDa AR-activator; Ret-activating protein ELE1) (Q14624) Inter-alpha-trypsin inhibitor heavy chain H4 (ITI heavy chain H4)
(Q14746) Conserved oligomeric Golgi complex component 2 (Q15697) Zinc finger protein 174 (AW-1)
(Q16288) NT-3 growth factor receptor (TrkC tyrosine kinase; GP145-TrkC)
(Q7RTV0) PHD finger-like domain protein 5A (splicing factor 3B associated 14-kDa protein; SF3b14b)
(Q86V81) THO complex subunit 4 (Tho4; Ally of AML-1 and LEF-1; transcriptional coactivator Aly/REF; bZIP enhancing factor BEF) (Q8IUC8) PolypeptideN-acetylgalactosaminyltransferase 13
(Q8IXZ2) Zinc finger CCCH type domain-containing protein 3
(Q8NCW0) Kremen protein 2 (kringle-containing protein marking the eye and the nose; Dickkopf receptor 2) (Q8TAC2) Josephin 2 (SBBI54)
(Q8TDZ2) NEDD9 interacting protein with calponin homology and LIM domains (Molecule interacting with CasL protein 1) (Q8TEX9) Importin 4 (importin 4b; Imp4b; Ran-binding protein 4; RanBP4)
(Q8TEY7) Ubiquitin carboxyl-terminal hydrolase 33 (ubiquitin thiolesterase 33; ubiquitin-specific processing protease 33; deubiquitinating enzyme 33; VHL-interacting deubiquitinating enzyme 1)
(Q8WW01) tRNA-splicing endonuclease subunit SEN15 (tRNA-intron endonuclease SEN15; HsSen15) (Q8WWL7) G2/mitotic-specific cyclin B3
(Q92575) UBX domain-containing protein 2
(Q96AC1) Pleckstrin homology domain-containing family C member 1 (kindlin 2; mitogen-inducible gene 2 protein; Mig-2) (Q96T58) Msx2-interacting protein (SMART/HDAC1 associated repressor protein)
(Q99986) Serine/threonine-protein kinase VRK1 (vaccinia-related kinase 1)
(Q9BPX3) Condensin subunit 3 (chromosome-associated protein G; condensin subunit CAP-G; hCAP-G; XCAP-G homolog; NY-MEL-3 antigen)
(Q9BZF1) Oxysterol binding protein-related protein 8 (OSBP-related protein 8 (ORP-8))
(Q9GZQ6) Neuropeptide FF receptor 1 (G protein-coupled receptor 147; RFamide-related peptide receptor OT7T022) (Q9GZU5) Nyctalopin
(Q9HCU4) Cadherin EGF LAG seven-pass G-type receptor 2 (epidermal growth factor-like 2; multiple epidermal growth factor-like domains 3; flamingo 1)
(Q9NQ38) Serine protease inhibitor Kazal-type 5 (Q9NSI6) WD-repeat protein 9
(Q9NZM3) Intersectin 2 (SH3 domain-containing protein 1B; SH3P18; SH3P18-like WASP associated protein) (Q9Y282) Serologically defined breast cancer antigen NY-BR-84 (CGI-54)
(Q9Y2K5) R3H domain protein KIAA1002 (fragment)
(Q9Y2Q0) Potential phospholipid-transporting ATPase IA (chromaffin granule ATPase II) (Q9Y305) Putative acyl-CoA thioester hydrolase CGI-16
labeled using an Applied Biosystems iTRAQ labeling
protocol, then placed through a cleanup and
pre-fractionation step, and finally placed through an mass
spectrometry (MS)/MS analysis on the Applied Biosystems
matrix-assisted laser desorption/ionization (MALDI) 4700.
The iTRAQ kit, from Applied Biosystems, allowed
multiple samples to be processed and analyzed concurrently
for direct comparison of the results.
Each sample was removed from the
–
80°C freezer and
delipidated according to the chloroform method as previously
reported [
20
], with removal of 60% of lipids from human
plasma samples. The samples were then desalted using the
Zebra Desalt Spin columns from Pierce, a process which
removes >95% of the salts and small molecules under
1,000 Da from the plasma sample. The samples are then
frozen overnight and labeled the following day. After
delipidation and desalting protein concentrations in the
samples were measured by the Bradford assay (Bio-Rad
Laboratories). Of each plasma sample time point, 100
μg
was processed according to the iTRAQ manufacturer's
instruction (Applied Biosystems). The iTRAQ labeling
protocol incorporates the following: a dissolution buffer, to
dissolve the proteins and buffer the subsequent reactions; a
denaturant, which disrupts the hydrogen, hydrophobic and
electrostatic bonds; a reducing reagent, which reduces the
disulfide bonds; and a cysteine blocking reagent, which
reversibly blocks all cysteine residues. The denatured
proteins are then digested with trypsin and labeled with the
iTRAQ mass tags. For each individual patient, plasma was
collected at three different time points. The first time point
was labeled with the iTRAQ tag of mass 114, the second
time point with tag 115, and the third time point with tag
116. After labeling all three time points, samples are
combined into a single patient sample. After the samples
are labeled, they are cleaned and fractionated through a
two-dimensional high-performance liquid chromatography
(HPLC) separation.
Cation Exchange Chromatography
The combined peptide mixture is separated by strong cation
exchange (SCX) chromatography on a Shimadzu 10VP
HPLC system using a PolySulfoethyl A column (4.6×
100 mm, 5
μ
m, 300 Å, PolyLC, Columbia, MD). The
sample in the SCX exchange buffer is loaded and washed
isocratically for 20 min at 0.5 ml/min to remove excess
iTRAQ reagents. Peptides are eluted with a linear gradient of
0
–
500 mM KCl (25%
v
/
v
ACN, 10 mM KH2PO4, pH 3) over
20 min at a flow rate of 1 ml/min, with 1-ml fractions
collected at room temperature. SCX fractions are dried down
completely to reduce volume, then resuspended in 2% (
v
/
v
)
acetonitrile, 0.1% (
v
/
v
) trifluoroacetic acid, and filtered prior to
reverse phase C18 nanoflow-LC separation. The fractions are
then taken and separated on a C18 column by peptide mass.
LC-MS Analysis
Peptide separation is performed on an Ultimate
chromatog-raphy system (Dionex-LC Packings, Hercules, CA)
equipped with a Probot MALDI spotting device. Individual
SCX fractions containing 10
μ
g of protein material are
injected and captured onto a 0.3×5-mm trap column (3-μm
C18
(Dionex-LC Packings, Hercules, CA)) and then eluted
onto a 75
μm×15 cm Pepmap analytical column (5-μm C18
(Dionex-LC Packings)) using a binary gradient (200 nl/
min) from 5% to 45% buffer B with mobile phase A 2%
ACN, 0.1% TFA, and mobile phase B 85% ACN, 5%
isopropanol, 0.1% TFA). For MALDI MS/MS analysis,
column effluent is mixed in a 1:2 ratio with MALDI matrix
(7 mg/ml cyano-4-hydroxycinnamic acid) through a 25-nl
mixing tee (Upchurch Scientific, Oak Harbor, WA) and
spotted in 192 spot arrays. Finally, the MALDI plates are
placed in the Applied Biosystems 4700 MALDI
–
time-of-flight (TOF) and are analyzed in MS/MS mode.
Surface Enhanced Laser Desorption/Ionization-TOF MS
Profiles
Samples were initially screened using Ciphergen's surface
enhanced laser desorption/ionization (SELDI) MS
technol-ogy. Protein profiles were obtained using a PBSIIc
ProteinChip reader (Ciphergen). Before analysis, the
in-strument was externally calibrated using all-in-one peptide
standard (Ciphergen) using a linear calibration equation.
High mass was set to 15,000 Da, optimizing between 1,000
and 10,000 Da. Detector sensitivity was set to 9, laser
intensity to 180, and mass deflector to 3,000 Da. Two
warming shots fired at each new position at laser intensity
210 were not included in the profile. The source voltage
and detector voltage was at 20,000 and 3,000 V,
respec-(Q9Y6D6) Brefeldin A-inhibited guanine nucleotide-exchange protein 1 (brefeldin A-inhibited GEP 1; p200 ARF-GEP1; p200 ARF guanine nucleotide exchange factor)(Q9Y6K8) Adenylate kinase isoenzyme 5 (ATP-AMP transphosphorylase)
(Q9Y6N9) Harmonin (Usher syndrome 1C protein; Autoimmune enteropathy-related antigen AIE-75; Antigen NY-CO-38/NY-CO-37; PDZ-73 protein)
Table 3 Proteins common to all 10 patients
Proteins Number of patients with
identified protein
(P01023) Alpha-2-macroglobulin (Alpha-2-M) 10
(P01024) Complement C3 [contains: C3a anaphylatoxin] 10
(P02647) Apolipoprotein A-I (Apo-AI) 10
(P02768) Serum albumin 10
(P02787) Serotransferrin (transferrin; siderophilin; beta-1-metal binding globulin) 10
(P02790) Hemopexin (beta-1B-glycoprotein) 10
(P00738) Haptoglobin 9
(P02652) Apolipoprotein A-II (Apo-AII; ApoA-II) 9
(O75717) WD repeat and HMG-box DNA-binding protein 1 (acidic nucleoplasmic DNA-binding protein 1 (And-1))
7
(P00450) Ceruloplasmin (ferroxidase) 7
(P02763) Alpha-1-acid glycoprotein 1 (AGP 1; orosomucoid 1; OMD 1) 6
(P02766) Transthyretin (prealbumin; TBPA; TTR; ATTR) 6
(P02774) Vitamin D-binding protein (DBP; group-specific component; Gc-globulin; VDB) 5 (P30307) M-phase inducer phosphatase 3 (dual specificity phosphatase Cdc25C) 5
(Q14746) Conserved oligomeric Golgi complex component 2 5
(P01877) Ig alpha-2 chain C region 5
(O96033) Molybdenum cofactor synthesis protein 2 small subunit (molybdopterin-synthase small subunit; MOCS2A; MOCO1-A)
4
(P49715) CCAAT/enhancer binding protein alpha (C/EBP alpha) 4 (Q8WW01) tRNA-splicing endonuclease subunit SEN15 (tRNA-intron endonuclease SEN15; HsSen15) 4 (Q9Y6D6) Brefeldin A-inhibited guanine nucleotide-exchange protein 1 (brefeldin A-inhibited GEP 1; p200
ARF-GEP1; p200 ARF guanine nucleotide exchange factor)
4
(P00734) Prothrombin (coagulation factor II) 3
(P01028) Complement C4 [contains: C4a anaphylatoxin; C4b] 3
(P02675) Fibrinogen beta chain [contains: fibrinopeptide B] 3 (P29371) Neuromedin K receptor (NKR; neurokinin B receptor; NK-3 receptor; NK-3R; tachykinin receptor
3)
3
(P57678) Component of gems 4 (Gemin4; p97) 3
(Q13424) Alpha-1-syntrophin (59-kDa dystrophin-associated protein A1, acidic component 1; Pro-TGF-alpha cytoplasmic domain-interacting protein 1; TACIP1; syntrophin 1)
3
(Q13772) Nuclear receptor coactivator 4 (NCoA-4; 70-kDa androgen receptor coactivator; 70-kDa AR-activator; Ret-activating protein ELE1)
3
(Q14624) Inter-alpha-trypsin inhibitor heavy chain H4 (ITI heavy chain H4) 3
(Q9NQ38) Serine protease inhibitor Kazal-type 5 3
(O43680) Transcription factor 21 (podocyte-expressed 1; Pod-1; epicardin; capsulin) 2 (P02671) Fibrinogen alpha/alpha-E chain [contains: fibrinopeptide A] 2 (P02743) Serum amyloid P-component (SAP; 9.5S alpha-1-glycoprotein) 2
(P02748) Complement component C9 2
(P04196) Histidine-rich glycoprotein (histidine-proline rich glycoprotein; HPRG) 2
(P04220) Ig mu heavy chain disease protein (BOT) 2
(Q00975) Voltage-dependent N-type calcium channel alpha-1B subunit 2 (Q8TEY7) Ubiquitin carboxyl-terminal hydrolase 33 (ubiquitin thiolesterase 33; ubiquitin-specific processing
protease 33; deubiquitinating enzyme 33; VHL-interacting deubiquitinating enzyme 1)
2
(Q96T58) Msx2-interacting protein (SMART/HDAC1 associated repressor protein) 2 (Q99986) Serine/threonine-protein kinase VRK1 (vaccinia-related kinase 1) 2
(Q9NSI6) WD-repeat protein 9 2
(Q9Y305) Putative acyl-CoA thioester hydrolase CGI-16 2
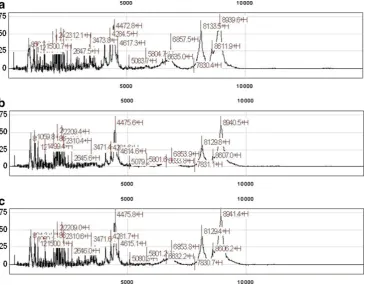
tively. The samples were run in triplicate using the CM10
(Ciphergen, Fremont, CA) weak cation exchange protein chip
according to the manufacturer
’
s protocol, as shown in Fig.
1
.
Tandem Mass Spectrometry
All MS and MS/MS spectra are acquired on an Applied
Biosystems 4700 Proteomics Analyzer (TOF/TOF; Applied
Biosystems/MDX Sciex, Foster City, CA) in positive ion
reflection mode. MS survey scans are acquired for each
sample across the entire plate from
m
/
z
ranges 500
–
4,000. All
peaks above an
S
/
N
of 60 are selected for MS/MS analysis.
Protein Identification and Analysis
Both MS and MS/MS spectra are processed in GPS
Explor-erTM software (v3.5, Applied Biosystems). For MS spectra, an
S
/
N
threshold of 30 was used; for MS/MS spectra, a threshold
of 20 was used to detect peaks. Monoisotopic peak lists were
generated in GPS Explorer and submitted to the Mascot
search tool for protein identities. For all searches, ion mass
tolerance was 100 ppm, and fragment ion mass tolerance was
0.6 Da. Protein identification was considered significant with
a Mascot score corresponding to
p
<0.05. The GPS software
prepares a list of identified peptides with reporter ion peak
average ratios and standard deviations. A statistical calculation
of how closely the acquired data matches previous database
searches under differing conditions. This calculation uses
normal probability distribution mathematics, also used by the
Mascot search engine for scoring. Because different database
searches have different Mascot significance levels, protein
scores and ion scores from different searches cannot be
directly compared. Different Mascot significance levels are
obtained if databases of different sizes are searched or if
different numbers of masses are submitted for a database
search. Therefore, the confidence interval (CI) is calculated
from the Mascot protein score or ion score, but the
significance level is removed from the calculation to allow
comparison between results from different database searches.
In our case, ion score was used to show significance. CI rates
the confidence level of the protein score or ion score. If the
score returned from the search is equal to the Mascot
significance level for the search, the score is given a 95%
confidence interval. Scores that are higher or lower than the
Mascot significance level for the search are given higher or
lower confidence intervals, respectively. The closer the CI% is
to 100%, the more likely the protein is correctly identified. Of
note, if the calculated CI>100, then 100 is reported, and if <0,
then 0 is reported.
A semi-quantitative protein analysis on proteins of
interest was performed using their relative iTRAQ ratios.
The protein iTRAQ ratios were compared using their
relative baseline, 4- and 24-h levels using a one sample
t
test. A one sample
t
test was used for comparison due to
sole interest in deviation (either increase or decrease) from
its baseline level.
Results
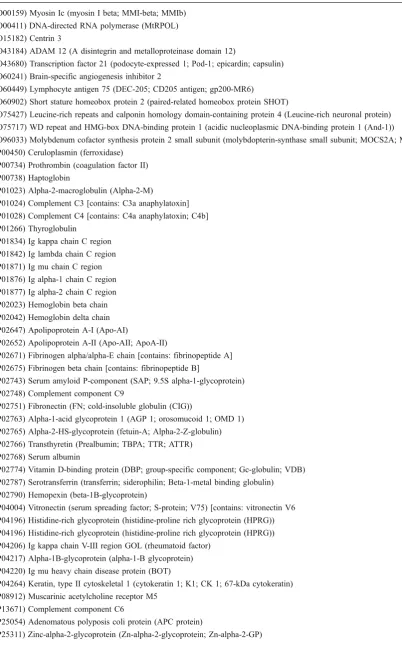
A total of 102 proteins were identified (CI
≥
90%), based on
ion score, as shown in Table
2
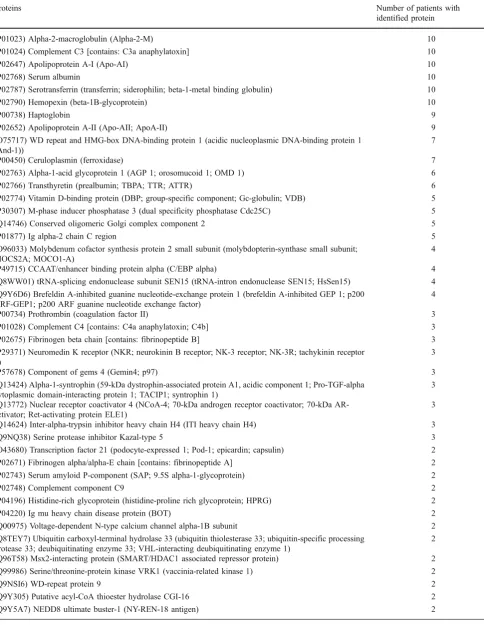
. Of the proteins with a CI
≥
90% (
n
=102), 42 total proteins were identified in
≥
2
patients, and 16 proteins (with a
≥
90% CI) were identified
in the majority of patients (Table
3
). Of these 16 proteins,
six proteins were present in all patients: serum albumin,
alpha-2-macroglobulin, apolipoprotein A-I, complement
C3, hemopexin, and serotransferrin. Representative spectra
for these common proteins are depicted in Fig.
2
. Due to
the known significant abundance of serum albumin, its
parent protein was not further analyzed.
iTRAQ studies yield a differential comparison of protein
expression with reference to a control state. In these studies,
each patient's baseline sample served as their control state.
Although absolute amounts of proteins may vary between
individuals, it is the relative change that was assessed.
Individual quantification of a peptide is based on the ratios
of the iTRAQ signature ions (as shown in Fig.
2
). The
protein iTRAQ ratios are determined by averaging all of the
ratios for all of the peptides found for each protein. Levels
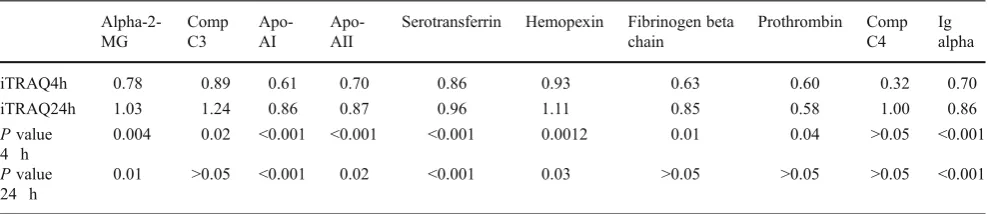
of nearly all proteins identified were found to decrease
(iTRAQ<1) at 4 h compared to baseline with a return to
baseline or near baseline at 24 h (iTRAQ
≥
1). Of interest, a
near consistent consumptive process was noted in identified
proteins recognized in the immune, thrombotic,
hematolog-ical, and lipoprotein physiologic processes at 4 h following
administration of RCM that trended toward baseline values
at 24 h, as shown in Table
4
.
Discussion
High-throughput proteomic analysis of patients undergoing
elective coronary angiography identified 102 distinct
proteins in this sample of 10 patients. These proteins were
reliably identified with
≥
90% CI. At this level of
confidence, 42 proteins were noted to be common among
patients and involved in various crucial physiologic
processes. Sixteen proteins were identified in the majority
of patients. Six proteins were present in all patients and
included serum albumin, apolipoprotein A-I, hemopexin,
serotransferrin, alpha-2-macroglobulin, and complement
C3. Interestingly, when analyzing the proteins pertaining
to the immune, thrombotic, hematological, and lipoprotein
physiologic processes, iTRAQ ratios revealed a
consump-tive process during the 4-h sampling that tended to return to
baseline by 24 h. Overall, these observations suggest that
administration of RCM results in significant changes in the
proteome and that there is activation of hematologic,
inflammatory, pro-thrombotic, and lipid transport processes.
Prior studies on patients with chronic coronary artery
disease have shown that RCM can act as a potent inducer of
Table 4 Proteins identified in patients with given iTRAQ ratios comparing baseline to 4 and 24 h
Alpha-2-MG
Comp C3
Apo-AI
Apo-AII
Serotransferrin Hemopexin Fibrinogen beta chain
Prothrombin Comp C4
Ig alpha
iTRAQ4h 0.78 0.89 0.61 0.70 0.86 0.93 0.63 0.60 0.32 0.70
iTRAQ24h 1.03 1.24 0.86 0.87 0.96 1.11 0.85 0.58 1.00 0.86
Pvalue 4 h
0.004 0.02 <0.001 <0.001 <0.001 0.0012 0.01 0.04 >0.05 <0.001
Pvalue 24 h
0.01 >0.05 <0.001 0.02 <0.001 0.03 >0.05 >0.05 >0.05 <0.001
the inflammatory pathway with increases in C-reactive
protein, interleukin-6, tumor necrosis factor-alpha, and
complement components [
12
,
13
]. Some studies by others
have attributed pro-thrombotic potential to RCM [
16
], an
observation thought to be more related to ionic properties of
RCM [
9
]. In vitro studies have also revealed RCM to be an
inducer of platelet degranulation, which has been
implicat-ed as a contributor to the thrombotic potential of RCM [
3
],
a finding that has been refuted by in vivo analysis [
5
].
Additive evidence also exists for an injurious effect on
vascular endothelium with administration of RCM [
21
].
The value of the approach utilized herein is the
demonstration that multiple pathways and protein responses
can be studied in each patient and that, using each patient as
their own control, dynamic changes over time can be
studied. The demonstration of simultaneous activation of
inflammatory and thrombotic pathways consequent to
RCM administration provides incentive for further study
in patients at risk of thrombotic events. Furthermore, this
approach allows for comparative analysis among the
different types of RCM.
In summary, the complex and dynamic changes in the
human proteome consequent to RCM administration
pro-vide further insight into mechanisms of potential
RCM-associated adverse clinical effects. The observations, herein,
of alterations in inflammatory-, thrombotic-, and
lipoprotein-related processes require further study in large
populations to better define the clinical relevance of these
observations.
Acknowledgments This study has been supported in part by the Robert S. Flinn Endowment for Cardiovascular Medicine (University of New Mexico School of Medicine) and GE Healthcare, Ltd. We thank Melissa Candelaria-Lyons and Lindsay Candelaria for their significant assistance in sample analysis and data generation.
References
1. Lloyd-Jones D, Adams RJ, Brown TM, American Heart Associ-ation Statistics Committee and Stroke Statistics Subcommittee, et al. Heart disease and stroke statistics—2010 update: a report from the American Heart Association. Circulation. 2010;121:e1–e170. 2. Holmes JS, Kozak LJ, Owings MF. Use and in-hospital mortality
associated with two cardiac procedures, by sex and age: national trends, 1990–2004. Health Affairs (Millwood). 2007;26:169–77. 3. Chronos NA, Goodall AH, Wilson DJ, Sigwart U, Buller NP.
Profound platelet degranulation is an important side effect of some types of contrast media used in interventional cardiology. Circulation. 1993;88:2035–44.
4. Grabowski EF, Jang IK, Gold H, Head C, Benoit SE, Michelson AD. Variability of platelet degranulation by different contrast media. Acad Radiol. 1996;3:S485–7.
5. Sakariassen KS, Barstad RM, Hamers MJ, Stormorken H. Platelet activation and thrombosis. I. Iohexol-induced platelet secretion does not affect thrombus formation in native blood. Acta Radiol. 1998;39:349–54.
6. Sakariassen KS, Barstad RM, Hamers MJ, Stormorken H. Platelet activation and thrombosis. II. Iohexol-induced platelet secretion does not affect collagen-induced or tissue-factor induced throm-bus formation in blood that is anticoagulated with heparin and aspirin. Acta Radiol. 1998;39:355–61.
7. Rasmussen F. The influence of radiographic contrast media on some granulocyte functions. Acta Radiol. 1998;39:7–35. 8. Rasmussen F. Radiographic contrast media and release of
neutrophil specific proteins in vitro and after intravenous injection. Acta Radiol. 1992;33:495–9.
9. Owens MR, Ribes JA, Marder VJ, Francis CW. Effects of ionic and nonionic radiographic contrast agents on endothelial cells in vitro. J Lab Clin Med. 1992;119:315–9.
10. Riemann CD, Massey CV, McCarron DL, Borkowski P, Johnson PC, Ziskind AA. Ionic contrast agent mediated endothelial injury causes increased platelet deposition to vascular surfaces. Am Heart J. 1993;125:71–8.
11. Davidson CJ, Laskey WK, Hermiller JB, et al. Randomized trial of contrast media utilization in high-risk PTCA: the COURT trial. Circulation. 2000;101:2172–7.
12. Bertrand ME, Esplugas E, Piessens J, Rasch W. Influence of a nonionic, iso-osmolar contrast medium (iodixanol) versus an ionic, low-osmolar contrast medium (ioxaglate) on major adverse cardiac events in patients undergoing percutaneous transluminal coronary angioplasty: a multicenter, randomized, double-blind study. Circulation. 2000;101:131–6.
13. Laskey WK, Gellman J. Inflammatory markers increase following exposure to radiographic contrast media. Acta Radiol. 2003;44:498–503.
14. Goldberg A, Zinder O, Zdorovyak A, et al. Diagnostic coronary angiography induces a systemic inflammatory response in patients with stable angina. Am Heart J. 2003;146:819–23.
15. Deftereos S, Giannopoulos G, Kossyvakis C, et al. Effects of radiographic contrast media on markers of complement activation and apoptosis in patients with chronic coronary artery disease undergoing coronary angiography. J Invasive Cardiol. 2009;21:473–7.
16. Fauser C, Ullisch EV, Kubler W, Haller C. Differential effects of radiocontrast agents on human umbilical vein endothelial cells: cytotoxicity and modulators of thrombogenicity. Eur J Med Res. 2001;11:465–72.
17. Robertson HJ. Blood clot formation in angiographic syringes containing nonionic contrast media. Radiology. 1987;162:621–2. 18. Grollman Jr JH, Liu CK, Astone RA, Lurie MD. Thromboembolic complications in coronary angiography associated with the use of nonionic contrast media. Cathet Cardiovasc Diagn. 1988;14:159– 64.
19. Omenn GS, States DJ, Adamski M, et al. Overview of the HUPO Plasma Proteome Project: results from the pilot phase with 35 collaborating laboratories and multiple analytical groups, generat-ing a core dataset of 3020 proteins and a publicly-available database. Proteomics. 2005;13:3226–45.
20. Castro AR, Morrill WE, Pope V. Lipid removal from human serum samples. Clin Diagn Lab Immunol. 2000;7:197–9. 21. Nyman U, Almen T. Effects of contrast media on aortic