METHODOLOGY
HAM-TBS: high-accuracy methylation
measurements via targeted bisulfite sequencing
Simone Roeh
1†, Tobias Wiechmann
1†, Susann Sauer
1, Maik Ködel
1, Elisabeth B. Binder
1,2and Nadine Provençal
1,3,4*Abstract
Background: The ability to accurately and efficiently measure DNA methylation is critical to advance the under-standing of this epigenetic mechanism and its contribution to common diseases. Here, we present a highly accurate method to measure methylation using bisulfite sequencing (termed HAM-TBS). This novel method is able to assess DNA methylation in multiple samples with high accuracy in a cost-effective manner. We developed this assay for the FKBP5 locus, an important gene in the regulation of the stress system and previously linked to stress-related disorders, but the method is applicable to any locus of interest.
Results: HAM-TBS enables multiplexed analyses of up to 96 samples and regions spanning 10 kb using the Illumina MiSeq. It incorporates a triplicate bisulfite conversion step, pooled target enrichment via PCR, PCR-free library prepa-ration and a minimum coverage of 1000×. TBS was able to resolve DNA methylation levels with a mean accuracy of 0.72%. Using this method, we designed and validated a targeted panel to specifically assess regulatory regions within the FKBP5 locus that are not covered in commercially available DNA methylation arrays.
Conclusions: HAM-TBS represents a highly accurate, medium-throughput sequencing approach for robust detection of DNA methylation changes in specific target regions.
Keywords: Targeted bisulfite sequencing, DNA methylation, Next-generation sequencing, 5-methylcytosine, FKBP5
© The Author(s) 2018. This article is distributed under the terms of the Creative Commons Attribution 4.0 International License (http://creat iveco mmons .org/licen ses/by/4.0/), which permits unrestricted use, distribution, and reproduction in any medium, provided you give appropriate credit to the original author(s) and the source, provide a link to the Creative Commons license, and indicate if changes were made. The Creative Commons Public Domain Dedication waiver (http://creat iveco mmons .org/ publi cdoma in/zero/1.0/) applies to the data made available in this article, unless otherwise stated.
Background
DNA methylation is the covalent addition of a methyl group at the 5-carbon ring of cytosine, resulting in 5-methylcytosine (5mC). In the mammalian genome, this occurs predominantly in the context of CpG dinu-cleotides. It is one of several epigenetic marks influenc-ing gene expression and servinfluenc-ing multiple other purposes such as genomic imprinting, X chromosome inactivation and maintenance of genomic stability [1, 2]. Aberrant regulation of the establishment, maintenance, erasure or recognition of DNA methylation has been associ-ated with a range of disease phenotypes [3, 4]. In addi-tion, lasting effects of environmental risk factors may be reflected by changes in DNA methylation [5]. The need
to measure DNA methylation in large human cohorts in a cost-effective manner is therefore of increasing interest for research in epidemiology and medicine [6].
Assessing DNA modifications with high accuracy and sensitivity in candidate loci would increase the power to detect and replicate such effects as well as to perform time course experiments in large numbers of samples to understand the stability of the environmentally induced changes during development. In addition, changes related to specific environmental exposure may only be present in specific cell types, although most studies rely on more complex tissues such as postmortem brain or blood samples. Assessing these effects in mixed tissues requires high accuracy in order to detect small changes emerging from a small number of cells. DNA bisulfite treatment followed by next-generation sequencing ena-bled the quantification of DNA methylation marks at single-base resolution. However, genome-wide bisulfite sequencing, although the best approach to identify DNA
Open Access
*Correspondence: [email protected]
†Simone Roeh and Tobias Wiechmann shared first authorship 3 Faculty of Health Sciences, Simon Fraser University, 8888 University Drive, Burnaby, BC V5A 1S6, Canada
modifications, is still too cost intensive to be applied to large human cohorts at the coverage needed (> 60×) to detect differentially methylated sites [6]. Another set of accurate and cost-efficient measurement methods for DNA methylation at single CpG level are Illumina DNA methylation arrays. However, the ones currently available lack coverage in key enhancer regions that are important for environmentally driven changes and have a relatively small number of probes (~ 10–13) covering each site. Targeted bisulfite sequencing (TBS) offers a candidate approach to perform such studies with high resolution by increasing depth of read coverage per CpG to detect small changes in DNA methylation in a cost-efficient manner. Recently, few applications of TBS have been developed with differences in accuracy, throughput and library preparation [7–10]. Our TBS approach focuses on the FKBP5 gene, which encodes the FK506-binding pro-tein (FKBP51), a co-chaperone tightly involved in stress regulation. Genetic and epigenetic factors have repeat-edly been shown to increase the activity of this gene and associated with increased stress-reactivity and psychi-atric disorders [11]. We have previously reported allele-specific demethylation of CpG sites located in intronic
enhancer regions of FKBP5 specific to posttraumatic
stress disorder (PTSD) in patients who had experienced
child abuse [12]. These gene × environment
interac-tions (GxE) may be mediated by differential susceptibil-ity to adverssusceptibil-ity-induced changes in DNA methylation in specific enhancers. Current methods do not cover the
relevant enhancer regions of FKBP5 affected by stress
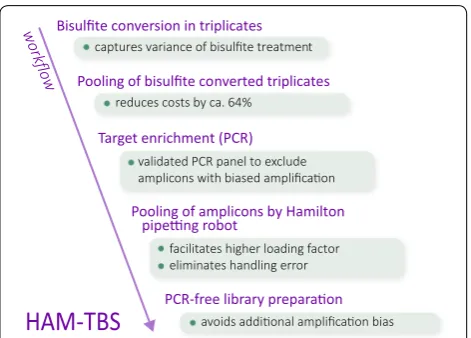
exposure. A highly accurate, cost- and time-efficient method to investigate FKBP5 DNA methylation in a large number of samples is thus critical to gain more insight into how DNA methylation changes may mediate these GxE. In this manuscript, we present a cost-effective, high-accuracy methylation measurement TBS (HAM-TBS) method to assess the regulatory regions of the FKBP5 locus. Incorporating a triplicate bisulfite conversion step, PCR-free library preparation and rigorous quality control (validation of PCR target sites, > 95% bisulfite conver-sion efficiency and 1000× coverage minimum) ensures
that our method is extremely robust (Fig. 1). Medium
throughput and handling accuracy of up to 96 samples spanning approximately 10 kb is facilitated by embedding the Hamilton pipetting robot and TapeStation with the Illumina MiSeq sequencer.
Results
QC, validation and optimization of the HAM‑TBS method
TBS is based on bisulfite conversion coupled with tar-geted enrichment via PCR, library preparation for
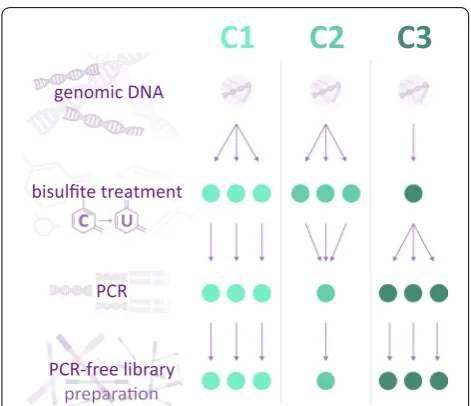
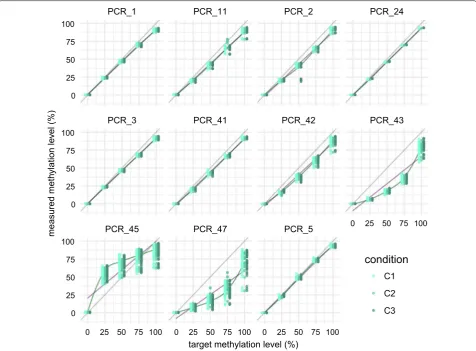
sequencing and subsequent quantification of methyla-tion levels. All steps are necessary and may influence the outcome by introducing bias to the assessment of methylation levels or by insufficient quality control of the data. The standard approach to minimize potential biases before sequencing is to produce replicates and assess the mean methylation levels during the analysis. In order to design a highly accurate yet cost-effective approach that is amenable to multiplexing, we assess at which step (bisulfite conversion or amplification) and to what extent technical variability would be introduced, as well as which quality control steps need to be per-formed on the sequencing data to ensure a robust anal-ysis. To this end, we assessed the methylation level of 0, 25, 50, 75, 100% in vitro methylated bacterial artificial chromosome (BAC) control DNA for 3 different combi-nations of pooling strategies during the bisulfite treat-ment and PCR amplification (Fig. 2). Condition 1 (C1) assessed the methylation levels of control DNA using triplicate bisulfite treatments and PCR amplification for each replicate. C1 was considered the standard refer-ence condition since each step was performed in tripli-cates. In condition 2 (C2), triplicate bisulfite treatments were pooled to perform one PCR amplification reduc-ing the costs by approximately 64%. Finally, in condi-tion 3 (C3) one bisulfite treatment of the control DNAs was performed followed by 3 separate PCR amplifica-tions to assess the extent of the target enrichment bias. A smaller panel of 11 different PCRs (Fig. 3) within the
FKBP5 locus (see table in Additional file 1) served as basis for this analysis. Before comparing the three con-ditions, the collected sequencing data were subjected to three quality control steps in order to ensure accu-rate assessment of minimal methylation levels as well as small changes between samples.
Bisulfite conversion in triplicates
Pooling of bisulfite converted triplicates
Target enrichment (PCR)
reduces costs by ca. 64%
validated PCR panel to exclude
Pooling of amplicons by Hamilton
facilitates higher loading factor eliminates handling error captures variance of bisulfite treatment
HAM-TBS
w orkflo
w
1. Bisulfite conversion rate > 95%. We assessed the bisulfite conversion rate per sample and per amplicon and excluded rates lower than 95% from the analysis.
2. Removal of PCR artefacts During the target
ampli-fication, the PCR occasionally introduces artefacts presenting non-existent CpG sequences in the tar-get region. They present at very low coverage and extreme levels of methylation (~ 0 or ~ 100%). In order to not exclude potential SNPs giving rise to CpGs, we removed artefacts on this basis rather than limiting the analysis to known CpGs according to the reference genome.
3. Minimum coverage of 1000 ×Higher sequencing
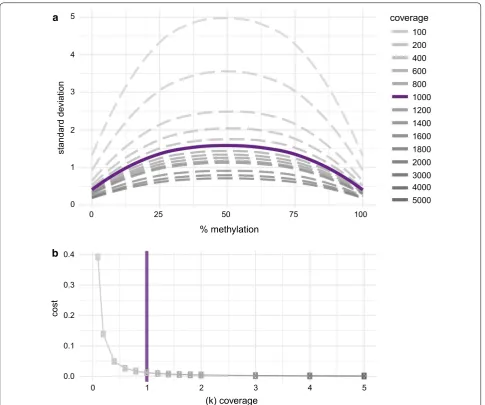
depth and coverage of the CpGs yields higher accu-racy of the methylation quantification. In order to determine the right balance between sequenc-ing depth and thereby cost and sufficient accuracy, we took random subsamples of varying sequenc-ing depth of an in silico created library represent-ing methylation levels from 0 to 100% and assessed the standard deviation for each level of methylation with respect to coverage (Fig. 4a). To find a meaning-ful cutoff for coverage, we considered the trade-off between sum of the average standard deviation per amplicon (cost) present in various levels of coverage (Fig. 4b). In accordance with previous findings [7], we identified 1000× coverage as a useful cutoff for our analysis, as the gain in accuracy with increasing cov-erage above this threshold is low and 1000× is
rea-sonable to achieve for a larger locus, e.g., 9 kb in the
FKBP5 panel.
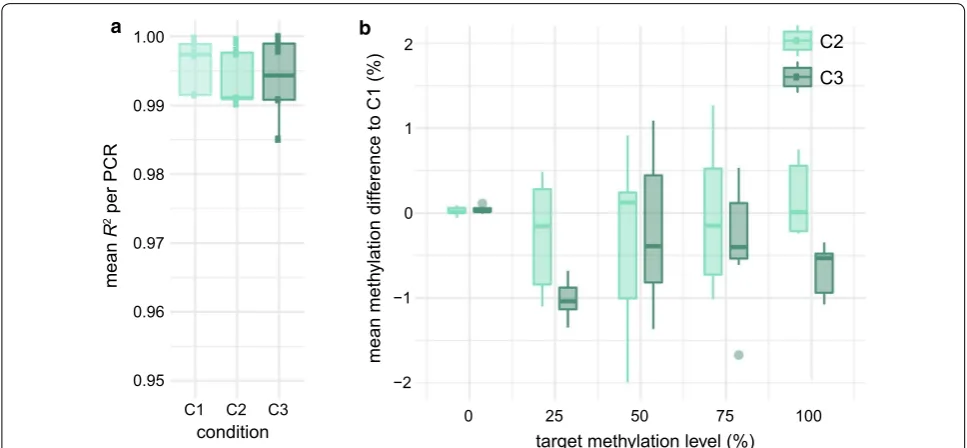
All PCRs for our validation experiment showed bisulfite conversion levels > 99%. After QC, a total of 40 CpG spread across 7 amplicons remained in our analysis (1 PCR failed due to coverage < 1000×, 1 showed nonlin-ear amplification and coverage < 1000×, 2 showed non-linear amplification). Methylation levels were very similar between all 3 conditions with an average error of < 1% when comparing absolute methylation levels of C2 and C3 versus C1 (Fig. 5b). We calculated the R2 values for
each assessed CpG across the titration levels and used
the mean per amplicon to compare the 3 conditions. R2
is a measure for assessing linearity of amplification of the methylation signal, which is crucial when quantify-ing methylation changes in, e.g., cohort studies. Again, all conditions showed very high mean R2 values above 0.99
(Fig. 5a). This confirms that all conditions are suitable for high-accuracy methylation detection. The introduced biases in our workflow, based on the control DNA, are minimal and enable very accurate methylation quantifi-cation even without including triplicates for the bisulfite conversion or target amplification. However, opposed to the target amplification, we cannot exclude slightly ele-vated variance of the bisulfite conversion on non-in vitro methylated DNA from, e.g., patients. Therefore, we chose to use C2 for our HAM-TBS method. While it still main-tains a triplicate bisulfite conversion step, it is the most cost-effective of the tested conditions, an important fac-tor when processing many samples from cohort studies.
Comparison of the technical accuracy of pyrosequencing to TBS
Next, we aimed to compare TBS to pyrosequencing, the reference method used for targeted DNA methylation analysis. We assessed the methylation levels of 5 CpGs within PCR_5 and PCR_11 measured by pyrosequenc-ing as well as uspyrosequenc-ing HAM-TBS with the C1 protocol. The methylation analysis using pyrosequencing showed a high mean standard deviation of 4.68% with a maxi-mum SD of 14.56%. The analysis using next-generation sequencing with C1 showed a much lower mean stand-ard deviation of 0.72% with a maximum SD of 1.83%. This demonstrates a significantly lower technical variation and therefore higher accuracy when assessing methyla-tion levels using a TBS approach.
Development of an extensive HAM‑TBS FKBP5 panel covering relevant regulatory sites
FKBP5 is an important gene in the field of psychiatry. The gene is larger than 100 kb rendering the assessment of the full locus including the adjacent up- and downstream
C1
C2
C3
PCR-free library bisulfite treatment
C U
PCR genomic DNA
regions unfeasible and too cost intensive for TBS meth-ods. We thus restricted our analysis to functionally relevant sites of interest to ensure compatibility with tar-geted measurement methods and enable the assessment in large cohorts. To this end, we designed and validated
a comprehensive amplicon panel (Fig. 6) including the
TSS, TAD boundaries, intergenic and proximal enhanc-ers as well as GR and CTCF binding sites (see methods
for further details). The resulting HAM-TBS FKBP5
panel is composed of 29 amplicons passing our QC’s threshold (described above) and covering 315 CpGs across the locus. The sequencing data showed sufficient bisulfite conversion for all amplicons when performed on control DNA using C2. In total, 27 of the amplicons included in the panel presented good linearity (see fig-ure in Additional file 2) across the assessed methylation levels. Two amplicons located near the TSS showed a mild PCR bias, where methylation levels were lower than expected for the 50% and 75% controls (PCR_7, PCR_9).
These amplicons have a very high CpG content of > 25%; hence, CpGs in the primer could not be avoided. It has been previously shown that methylation levels in this region are very low (< 5%) across tissues [12], so that any bias at higher methylation levels would not impair accurate quantification of this region. We thus incorpo-rated sites located in this region in the panel, but they should be used with caution if higher methylation levels
are observed. PCR_26 of the HAM-TBS FKBP5 panel
is located in the H19 locus [13] which is an imprinted gene and serves as an internal positive control with an expected methylation level ~ 50%.
Application and costs
The HAM-TBS method can be multiplexed up to 96 samples in a medium-throughput manner. To demon-strate the applicability of our approach, quality control statistics of data derived from an experiment
contain-ing 95 blood samples from patients and the full FKBP5
PCR_45 PCR_47 PCR_5
PCR_3 PCR_41 PCR_42 PCR_43
PCR_1 PCR_11 PCR_2 PCR_24
0 25 50 75 100 0 25 50 75 100 0 25 50 75 100
0 25 50 75 100 0
25 50 75 100
0 25 50 75 100
0 25 50 75 100
target methylation level (%)
measured meth
ylation le
vel (%
)
condition
C1 C2 C3
panel of 29 amplicons are described here. After reads mapping and methylation calling, we identified PCR artefacts comprising ~ 1% of the methylation sites and removed them from the data, and 9 samples in 1 PCR showed insufficient bisulfite conversion rates (< 95%) and were also removed. Two loci were identified as SNPs giving rise to a CpG sites in patients. In total, 91% of sample x amplicon data passed our filtering cri-teria. 27 amplicons passed QC with sufficient coverage and quality in > 75% of samples, while two amplicons were dropped due to < 1000× coverage (Additional
file 3A, B). The control amplicon spanning the H19
imprinted locus for which methylation level is known to be ~ 50% [14] shows the expected methylation profile
in all samples (Additional file 3C). HAM-TBS approach allowed the quantification of 276 methylation sites for 95 samples in one single MiSeq run.
An assessment of the relative costs for each of the main reagents for this experiment containing 96 samples (95 patients and unmethylated control) with increasing num-ber of amplicons assessed is depicted in Additional file 4. The quantifications using TapeStation and the PCR-free library preparation are the two most cost-intensive steps. The proportion of costs for the amplicon quantification using the TapeStation increases with the higher amount of amplicons investigated, while relative costs for the library preparation and sequencing chemistry decrease with the inclusion of more amplicons.
0 1 2 3 4 5
0 25 50 75 100
% methylation
standard de
viation
coverage
100 200 400 600 800 1000 1200 1400 1600 1800 2000 3000 4000 5000
0.0 0.1 0.2 0.3 0.4
0 1 2 3 4 5
(k) coverage
cost
a
b
Discussion
We developed a targeted medium-throughput approach for measuring DNA methylation levels in multiple sam-ples in parallel. This method enables cost-efficient high-resolution methylation measurements of target loci in
cohorts of patients and probands at the FKBP5 gene, a
locus with large interest in the psychiatric and psycholog-ical community [11]. This cost-efficient, accurate method to determine FKBP5 methylation levels would thus serve a large number of researchers. Our method is positioned between whole genome bisulfite sequencing and tar-geted approaches as pyrosequencing. The first is expen-sive and yields lower coverage and accuracy of single CpGs; the latter only allows to assess very small regions at a time and can generate significant variance between
replicates. HAM-TBS enables the analysis of a targeted but larger region (~ 10 kb) at high resolution and low costs. DNA methylation studies in large cohorts, inves-tigating the impact of environment or association with disease status in mixed tissues, necessitate high accuracy at single-site resolution. In fact, TBS was able to resolve methylation levels with a mean accuracy of 0.72%. A high level of accuracy was maintained in more cost-efficient approaches using only one PCR amplification round. By pooling triplicate bisulfite treatments prior to PCR amplification, we can account for variance introduced by the bisulfite treatment but also reduce costs and hands-on time during the target amplificatihands-on.
The accuracy of the method benefits from a PCR-free library preparation and rigorous quality control (prior
0.95 0.96 0.97 0.98 0.99 1.00
C1 C2 C3
condition
mean
R
2 per PC
R
−1
−2 0 1 2
0 25 50 75 100
target methylation level (%)
mean met
hy
lation dif
fe
rence to C1 (%
) C2
C3
a b
Fig. 5 a Mean R2 per amplicon for all conditions C1, C2 and C3. b Mean methylation difference per PCR for C2 and C3 to the clean control condition C1. x-axis: target methylation levels during in vitro methylation
Genomic coordinates
FKBP5 splicing variants
CTCF-ChIA-PET
CTCF-ChIP-Seq
GR-ChIP-Seq
HAM-TBS FKBP5 panel
Intronic enhancer Distal
TAD Intron 7 Intron 5 Intron 2 Intron 1 TSS ProximalenhancerProximalTAD
35,600,000 35,700,000
35,500,000
LOC285847
ARMC12
variant 1 (NM_00417) variant 2 (NM_001145775)
evaluation of linear PCR amplification of the target site, bisulfite conversion efficiency > 95% and read cover-age minimum of 1000×). Nonetheless, a proper assess-ment of possible amplification biases due to the choice of amplicon location in the design step is critical. Some loci can show nonlinear amplification curves, which renders them inappropriate for methylation quantifica-tion. Adjustment of primer design and PCR conditions may help solve this issue, but for some loci optimiza-tion may not be possible. For instance, in CpG islands with high CpG density, we observed that amplification curves were not linear, revealing a bias which became more pronounced as the level of methylation increased. Differential methylation results from these sites should be interpreted with caution and perhaps require addi-tional replication. Besides validating each ampli-con prior to usage, including ampli-controls such as in vitro unmethylated DNA, water and endogenous hemimeth-ylated region, the H19 locus, during each HAM-TBS experiment is important and enables quality checks for each step of the protocol.
Additionally, reaching 1000× coverage is an impor-tant step to provide high resolution on methylation changes [8]. However, accurate quantification and pool-ing of many amplicons across multiple samples while reaching sufficient coverage of all regions has limita-tions. In theory, even though the MiSeq can handle a much higher loading factor (amplicons x samples) of almost 20,000 (disregarding uneven pooling of libraries, filtering of reads due to low quality or high amounts of PhiX), a maximum of 2500–3000 has proven to be feasi-ble with minimal dropout rates. Assuming multiplexing of 96 samples and 25 amplicons at an average length of 400 bp, a region of approximately 10 kb can be comfort-ably covered with this approach. Notcomfort-ably, we streamlined the method to handle loading factors > 2000 by imple-mentation of Agilent’s TapeStation and a pipetting robot for quantification and pooling of amplicons. Besides the throughput, this improves the robustness of the work-flow. Our approach is designed to match the specifica-tions of the Illumina MiSeq with its ability to run for 600 cycles resulting in 300 bp-long paired-end reads. This enables full-length coverage of amplicons up to a length of 600 bp. While our approach can be applied to differ-ent sequencers, such as the Illumina HiSeq for exam-ple, it would be necessary to design shorter amplicons due to the current limits of the sequencing chemistry. Using another sequencer, it is important to mention the index hopping phenomenon on the Illumina platforms [15]. It is less present on the MiSeq compared to other machines with pattern flow cells as our data show con-sistent levels of methylation close to 0% across all in vitro unmethylated control samples indicating no issue with
this specific bias. Nonetheless, it should be kept in mind that approaches like unique dual indexes when available or Illumina’s Free Adapter Blocking Reagent are recom-mendable and gain importance, especially when using a different Illumina sequencer.
In the past years, only few TBS methods have been developed [8–10] with different methodological foci. Thus far, Bernstein et al. [10] allows a panel of 48 indi-ces, while the approach by Chen et al. [9] could allow for a multiplexing rate of 1536 samples due to custom-made barcodes, but in practice only 478 have been used to date. In the latter method, the high multiplexing capacity comes at the cost of an additional PCR step potentially introducing additional bias. Moreover, increasing the number of samples needs to be weighed against the size of the target region in order to ensure sufficient cover-age. We identified 1000× coverage as an optimal cutoff in terms of accuracy and cost in agreement with a publica-tion by Masser et al. [8]. In the above-described study by Chen et al. [9], 100× was used as minimum cutoff. Based on our in silico analysis (Fig. 4a), this would lead to less accurate quantification of methylation levels. Besides the number of samples that can be processed, the size of the region of interest is also an important factor to be con-sidered. The method by Masser et al. [8] has been applied to 2 amplicons (233 and 320 bp), while Chen et al. enable the assessment of larger loci around 10 kb—comparable to our HAM-TBS approach. Lastly, amplification-based library preparation methods have been adapted by most TBS approaches. At this point, HAM-TBS utilizes a PCR-free library preparation to avoid adding amplification biases.
Finally, using the optimized HAM-TBS workflow, we designed a panel comprising 29 amplicons to accurately
assess methylation within the FKBP5 locus using
HAM-TBS. This panel covers ~ 9 kb and targets important regulatory regions of the FKBP5 gene including the TSS, intergenic and proximal enhancers and TAD boundaries
including CTCF binding sites. The HAM-TBS method
and the FKBP5 panel present valuable tools for epigenetic studies in which a highly accurate assessment of meth-ylation levels is critical such as GxE studies in psychiatric research. It allows cost-efficient quantification of methyl-ation in larger cohorts with optimized hands-on time due to automatization.
Conclusion
in the FKBP5 locus, a gene of great interest in the field of psychiatry.
Methods
Generation of in vitro methylated control DNA
All primers designed for bisulfite PCR were first tested on in vitro methylated DNA to assess amplification
effi-ciency and bias. For PCRs within the FKBP5 gene, an
in vitro methylated BAC (RP11-282I23, BACPAC) was used to generate control DNA. For PCRs outside the
FKBP5 locus (PCR_26, PCR_34, PCR_35), genomic DNA extracted from whole blood was amplified using the REPLI-g Mini Kit (QIAGEN GmbH, Hilden, Germany) to generate unmethylated DNA. 100% methylated DNA was achieved using in vitro methylation with M.SssI meth-yltransferase. After a first incubation (3 µg DNA, 0.5 µl SAM (32 mM), 1 µl M.SssI (20 U/µl, 40 µl NEB buffer 2 [10×], diluted with ddH2O up to 400 µl) of 4 h at 37C, 1 µl of M.SssI (20 U/µl) and 1 µl of SAM (32 mM) were added, and a second 4-h incubation was performed. Sub-sequently, the reaction was purified using the nucleotide removal kit (QIAGEN GmbH, Hilden, Germany). In vitro methylation was repeated with the eluted DNA for a sec-ond time. 25, 50 and 75% methylated control DNA was obtained by mixing 0 and 100% DNAs. In vitro methyla-tion of control DNA was checked via pyrosequencing.
Bisulfite treatment of DNA
We used the EZ DNA Methylation Kit (Zymo Research, Irvine, CA) in column and plate format depending on the amount of DNA and throughput needed. Between 200 and 500 ng was used as input DNA and processed according to the manufacturer’s instructions. DNA was eluted twice in 10 µl elution buffer which recovered over 90% of the input DNA after bisulfite conversion when using the column format. In order to quantify bisulfite treated DNA, we use a spectrophotometer with RNA quantification settings.
Target enrichment and amplicon pooling
The amplification of target locations from converted DNA (20 ng per amplicon) was achieved using the TaKaRa EpiTaq HS Polymerase (Clontech, Mountain View, CA; final concentration: 0.025 U/l), bisulfite-spe-cific primers (final concentration of each primer: 0.4 M) and a touchdown cycling protocol with 49 cycles [for more details (see table in Additional file 5 and section
HAM-TBS FKBP5 panel). The amplicons of all PCR
reac-tions were quantified using the Agilent 2200 TapeStation (Agilent Technologies, Waldbronn, Germany] and equi-molar pooled with the Hamilton pipetting robot. After speed-vacuum and resuspension in 50 µl, a double-size selection was applied using Agencourt AMPure XP beads
(Beckman Coulter GmbH, Krefeld, Germany) to remove excess of primers and genomic DNA.
Control samples
For every TBS run, we included three different controls. First, up to three water controls in order to monitor cross-contamination with DNA and detect if the plate was accidentally rotated. Second, an unmethylated con-trol DNA as a positive concon-trol and to detect failed steps throughout the workflow. And third, the H19 locus which is an imprinted region and presents with methylation levels ~ 50% as a positive control for bisulfite conversion in genomic DNA and detect outliers in patient samples. An amplicon located at this locus is incorporated in the
FKBP5 panel.
Library preparation and sequencing
For library generation, Illumina TruSeq DNA PCR-Free HT Library Prep Kit (Illumina, San Diego, CA) was used according to the manufacturer’s standard protocol and obtained high-quality libraries using 500 ng of start-ing material (durstart-ing optimization, input amounts as low as 100 ng were tested and showed no loss of quality on the QC level). Qubit 1.0 (Thermo Fisher Scientific Inc., Schwerte, Germany) was used for quantification, Agi-lent’s 2100 Bioanalyzer (Agilent Technologies, Wald-bronn, Germany) for quality assessment and Kapa HIFI Library quantification kit (Kapa Biosystems Inc., Wilmington, MA) for final quantification before pool-ing. Libraries were pooled equimolarly. Sequencing of the libraries was performed on an Illumina MiSeq using Reagent Kit v3 (Illumina, San Diego, CA; 600 cycles) in paired-end mode, with 30% PhiX added.
Sequencing data processing
First, read quality was verified using FastQC [16]. Adapter sequences were trimmed using cutadapt v.1.9.1 [17]. For alignment to a restricted reference of hg19 based on the
PCR locations, Bismark v.0.15.0 [18] was used. Due to
artefacts mostly present at very low levels of coverage and 0 or 100% methylation. Lastly, according to our cov-erage cutoff, we excluded CpG sites supported by less than 1000 reads. Subsequent analysis comparing meth-ylation levels from the conditions C1, C2 and C3 as well as data from pyrosequencing was performed in R.
Coverage considerations
When performing a sequencing experiment, one will usually sequence part of the generated library and quan-tify the methylation levels on this basis rather than sequence the whole library to see the true level within. Therefore, each sequencing experiment corresponds to drawing a random subset of a certain size (sequencing depth) of the whole library and can be viewed as a sub-sampling problem. Depending on the sequencing depth, this will yield a different level of accuracy of the meth-ylation levels. We created a dataset simulating CpGs methylated at levels from 0 to 100% supported by 100,000 “fragments” each. Therefore, e.g., for 10% methylation level, a set 10,000 Cs and 90,000 Ts was created. Accord-ingly, sets for 0–100% methylation were created. Using a bootstrapping approach, we drew 1000 random subsets of varying sequencing coverage (100, 200, 400, …, 2000, 3000, 4000, 5000) from each set representing a certain level of methylation and the standard deviation (SD) was calculated. As a proxy for the increase in accuracy ver-sus increase in sequencing depth (costs), the combined SD was divided by the sequencing depth. Of note, this is in concordance with results from the same analysis on highly covered amplicon data from our laboratory (data not shown).
Pyrosequencing
Methylation analysis by pyrosequencing of 5 CpGs cov-ered within PCR_5 (CpG 35607969, CpG 35608022) and PCR_11 (CpG 35690280, CpG 35690318, CpG 35690365) was performed in triplicates on BAC control DNA. Bisulfite conversion of in vitro methylated control DNA was applied as described above. Target enrichment by PCR was achieved with a biotinylated reverse primer but otherwise performed as described above. Pre-treatment of PCR amplicons was facilitated with the PyroMark Q96 Vacuum Workstation (QIAGEN GmbH, Hilden,
Ger-many). Sequencing of FKBP5 CpGs was performed on a
PyroMark Q96 ID system using PyroMark Gold Q96 rea-gents (QIAGEN GmbH, Hilden, Germany) and sequenc-ing primers accordsequenc-ing to Klengel et al. [12]: P4 S1 (TTT GGA GTA GTA GGT TAA A) GRE3 S1 MPI (GGG AAT TAT GAG GTTG). The PyroMark Q96 ID Software 2.5
(QIAGEN GmbH, Hilden, Germany) was used for data analyses.
HAM‑TBS FKBP5 panel
We designed 29 primer pairs (see table in Additional file 5) using BiSearch [20, 21] targeting the FKBP5
locus. Initially, 32 PCRs were included, but 3 PCRs were not selected for the panel due to QC failure. The excluded amplicons showed nonlinear amplification due to an elevated GC content in the region. Positions of amplicons covering glucocorticoid response
ele-ments (GREs) were selected from Klengel et al. [12]
and the GR ChIP-Seq from the ENCODE project [22].
Amplicons covering CTCF binding sites were selected
using HI-C peaks [23], CTCF-ChIA-Pet
interac-tions from a lymphoblastoid cell line (GM12878, Tang et al. [24]) and CTCF ChIP-Seq information from the
ENCODE project [22]. Lastly, amplicons located near
the TSS were included in the panel. Only primers without CpGs in their sequence were chosen, with the exception of 2 amplicons close to the TSS where this could not be avoided due to the high CpG content of the region. The selected amplicons ranged from 200 to 450 bp in length.
Authors’ contributions
TW, SR, NP, EBB contributed to experimental design. TW, SS, MK performed wet lab work. SR performed the data analyses. SR, TW, NP, EBB prepared the manuscript. All authors read and approved the final manuscript.
Author details
1 Department of Translational Research in Psychiatry, Max Planck Institute of Psychiatry, Kraepelinstr. 2-10, 80804 Munich, Germany. 2 Department of Psychiatry and Behavioral Sciences, Emory University Medical School, 12 Executive Park Dr NE #200, Atlanta, GA 30329, USA. 3 Faculty of Health Sci-ences, Simon Fraser University, 8888 University Drive, Burnaby, BC V5A 1S6, Canada. 4 Healthy Starts Theme, BC Children’s Hospital Research Institute, 938 West 28th Avenue, Vancouver, BC V5Z 4H4, Canada.
Additional files
Additional file 1. A table containing the genomic coordinates of a smaller panel of 11 amplicons located within the FKBP5 locus. These amplicons were used to assess the source of potential biases as well as variability between replicates.
Additional file 2. A figure displaying the bias assessment for all ampli-cons comprising the FKBP5 HAM-TBS panel.
Additional file 3. A figure displaying the QC statistics of a HAM-TBS experiment with 95 samples using the FKBP5 panel and methylation levels of the H19 locus.
Additional file 4. A figure displaying the relative and absolute costs for a HAM-TBS experiment with 96 samples.
•fast, convenient online submission •
thorough peer review by experienced researchers in your field • rapid publication on acceptance
• support for research data, including large and complex data types •
gold Open Access which fosters wider collaboration and increased citations maximum visibility for your research: over 100M website views per year •
At BMC, research is always in progress.
Learn more biomedcentral.com/submissions
Ready to submit your research? Choose BMC and benefit from:
Acknowledgements
The authors would like to thank Jessica Keverne for professional English editing and formatting and Monika Rex-Haffner for her help regarding the sequencing of the libraries and Stoyo Karamihalev for graphics support.
Competing interests
The authors declare that they have no competing interests.
Availability of data and materials
The datasets used and/or analyzed during the current study are available from the corresponding author on reasonable request.
Consent for publication Not applicable.
Ethics approval and consent to participate Not applicable.
Funding
This study was funded by the BMBF Grant Berlin-LCS (FKZ 01KR1301B) to EB and an ERC starting Grant (GxE molmech, Grant 281338) within the FP7 fund-ing scheme of the EU to EB and fellowship from Canadian Institute of Health Research (CIHR) to NP.
Publisher’s Note
Springer Nature remains neutral with regard to jurisdictional claims in pub-lished maps and institutional affiliations.
Received: 4 April 2018 Accepted: 28 June 2018
References
1. Bird A. DNA methylation patterns and epigenetic memory. Genes Dev. 2002;16:6–21.
2. Ehrlich M, Wang RY. 5-methylcytosine in eukaryotic DNA. Science. 1981;212:1350–7.
3. Portela A, Esteller M. Epigenetic modifications and human disease. Nat Biotechnol. 2010;28:1057–68.
4. Weng YL, An R, Shin J, Song H, Ming GL. DNA modifications and neuro-logical disorders. Neurotherapeutics. 2013;10:556–67.
5. Lam LL, Emberly E, Fraser HB, Neumann SM, Chen E, Miller GE, et al. Factors underlying variable DNA methylation in a human community cohort. Proc Natl Acad Sci USA. 2012;109(2):17253–60.
6. Joubert BR, Felix JF, Yousefi P, Bakulski KM, Just AC. Breton C, et at. DNA methylation in Newborns and Maternal Smoking in Pregnancy: genome-wide Consortium Meta-analysis. Am J Hum Genet. 2016;98:680–96. 7. Ziller MJ, Hansen KD, Meissner A, Aryee MJ. Coverage recommendations
for methylation analysis by whole-genome bisulfite sequencing. Nat Methods. 2015;12:230–2.
8. Masser DR, Berg AS, Freeman WM. Focused, high accuracy 5-methylcy-tosine quantitation with base resolution by benchtop next-generation sequencing. Epigenet Chromatin. 2013;6:33.
9. Masser DR, Stanford DR, Freeman WM. Targeted DNA methylation analysis by next-generation sequencing. J Vis Exp. 2015. https ://doi. org/10.3791/52488 .
10. Bernstein DL, Kameswaran V, Le Lay JE, Sheaffer KL, Kaestner KH. The BisPCR(2) method for targeted bisulfite sequencing. Epigenet Chromatin. 2015;8:27.
11. Chen GG, Gross JA, Lutz PE, Vaillancourt K, Maussion G, Bramoulle A, et al. Medium throughput bisulfite sequencing for accurate detec-tion of 5-methylcytosine and 5-hydroxymethylcytosine. BMC Genom. 2017;18:96.
12. Zannas AS, Wiechmann T, Gassen NC, Binder EB. Gene-stress-epigenetic regulation of FKBP5: clinical and translational implications. Neuropsy-chopharmacology. 2016;41:261–74.
13. Klengel T, Mehta D, Anacker C, Rex-Haffner M, Pruessner JC, Pariante CM, et al. Allele-specific FKBP5 DNA demethylation mediates gene-childhood trauma interactions. Nat Neurosci. 2013;16:33–41.
14. Huang RC, Galati JC, Burrows S, Beilin LJ, Li X, Pennell CE, et al. DNA methylation of the IGF2/H19 imprinting control region and adiposity distribution in young adults. Clin Epigenet. 2012;4(1):21.
15. Illumina, Inc. Effects of index misassignment on multiplexing and down-stream analysis. https ://www.illum ina.com/conte nt/dam/illum ina-marke ting/docum ents/produ cts/white paper s/index -hoppi ng-white -paper -770-2017-004.pdf.
16. Andrews SR. FastQC: a quality control tool for high throughput sequence data. https ://www.bioin forma tics.babra ham.ac.uk/proje cts/fastq c. 2010. 17. Martin M. Cutadapt removes adapter sequences from high-throughput
sequencing reads. EMBnet J. 2011;17:10–2.
18. Krueger F, Andrews SR. Bismark: a flexible aligner and methylation caller for Bisulfite-Seq applications. Bioinformatics. 2011;27:1571–2.
19. Akalin A, Kormaksson M, Li S, Garrett-Bakelman FE, Figueroa ME, Melnick A, et al. methylKit: a comprehensive R package for the analysis of genome-wide DNA methylation profiles. Genome Biol. 2012;13:R87. 20. Aranyi T, Váradi A, Simon I, Tusnády GE. The BiSearch web server. BMC
Bioinf. 2006;7:431.
21. Tusnády GE, Simon I, Váradi A, Aranyi T. BiSearch: primer-design and search tool for PCR on bisulfite-treated genomes. Nucleic Acids Res. 2005;33:e9.
22. ENCODE Project Consortium. An integrated encyclopedia of DNA ele-ments in the human genome. Nature. 2012;489:57–74.
23. Rao SS, Huntley MH, Durand NC, Stamenova EK, Bochkov ID, Robinson JT, et al. A 3D map of the human genome at kilobase resolution reveals principles of chromatin looping. Cell. 2015;159:1665–80.