Scholarly Horizons: University of Minnesota, Morris
Undergraduate Journal
Volume 6 | Issue 2
Article 4
July 2019
Tools to Improve Interruption Management
Matthew R. Munns
University of Minnesota Morris
Follow this and additional works at:
https://digitalcommons.morris.umn.edu/horizons
Part of the
Management Sciences and Quantitative Methods Commons, and the
Theory and
Algorithms Commons
This Article is brought to you for free and open access by the Journals at University of Minnesota Morris Digital Well. It has been accepted for inclusion in Scholarly Horizons: University of Minnesota, Morris Undergraduate Journal by an authorized editor of University of Minnesota Morris Digital Well. For more information, please [email protected].
Recommended Citation
Munns, Matthew R. (2019) "Tools to Improve Interruption Management,"Scholarly Horizons: University of Minnesota, Morris Undergraduate Journal: Vol. 6 : Iss. 2 , Article 4.
Cover Page Footnote
This work is licensed under the Creative Commons Attribution- NonCommercial-ShareAlike 4.0
Tools to Improve Interruption Management
Matthew R. Munns
Division of Science and Mathematics University of Minnesota, Morris Morris, Minnesota, USA 56267
[email protected]
ABSTRACT
Interruptions carry a high cost, especially to software devel-opers. To prevent unnecessary interruptions, several tech-nologies are being explored that can help manage the timing of interruptions, such as displaying the interruptibility of a worker to their peers. Relatively simple algorithms utilizing computer interaction data have been created and used suc-cessfully in the workplace, while technology using bio-metric emotion recognition to detect the interruptibility of a user is also being developed.
Keywords
interruption cost, software development, interruptibility, bio-metrics, computer interaction data
1.
INTRODUCTION
In workplace situations, interruptions can result in unnec-essary loss of productivity due to resumption lag. Resump-tion lag is the amount of time it takes to switch back to a previous task after an interruption. According to Gloria Mark, professor at University of California, Irvine, on aver-age it takes twenty-three and a half minutes to return to the original task after being interrupted [10]. Another study by Mark et al. showed that interruptions cause workers to feel more stressed and that they attempt to work faster to make up for lost time [7].
In-person interruptions can be hard to avoid due to the limited ability most people have to assess interruptibility. Studies have shown that despite some established social cues to indicate interruptibility, (e.g., an open/closed office door), humans are only slightly better than a random number gen-erator at guessing how interruptible a person is. [14]
A second type of interruption that can be better man-aged is email notifications. Emails are considered to have a high interruption cost, and they are very common, like in-person interruptions. While they are useful for commu-nication, they can lead to feelings of cognitive overload and stress according to some studies. [6, 8]
Self-interruptions are also costly to knowledge workers. These include visiting websites unrelated to work, browsing social media, playing games, and other similar activities. Wasting time using the internet or video games has been
This work is licensed under the Creative Commons Attribution-NonCommercial-ShareAlike 4.0 International License. To view a copy of this license, visit http://creativecommons.org/licenses/by-nc-sa/4.0/.
UMM CSci Senior Seminar Conference, April 2019Morris, MN.
coined “cyberloafing” by some researchers [5]. These inter-ruptions are often intended to be very short, but the nature of these websites and games leads to users spending more time than they originally intended. [5]
In order to address these interruptions, we first need to de-termine how interruptible the user is at a given time. Then, interruptions that would have occurred during a busy mo-ment can instead be moved to a time when the user is de-termined to be interruptible. Several approaches to measur-ing interruptibility exist with varymeasur-ing levels of complexity. These include biometric recognition, computer interaction data, and using manually input data such as calendar infor-mation. [16, 6]
In this paper, I will begin by providing some background information of various biometric technologies that are used to determine interruptibility and a brief overview of a ma-chine learning technique used in several interruptibility stud-ies. Then, I will present a series of studies which attempted to find successful methods of measuring interruptibility, fol-lowed by studies which used these methods to manage the timing of interruptions. I will also present the results of each study, followed by my conclusions.
2.
BACKGROUND
2.1
Recognizing Interruptibility
One method of determining interruptibility that is being researched is using emotion recognition through biometric sensors or eye tracking. A number of physiological mea-surements have been previously linked to cognitive load and focus in previous studies. Emotions such as anxiety and stress can also be measured and used to infer interruptibil-ity. Heart rate, interbeat interval (the time between individ-ual heartbeats), body temperature, perspiration, eye blinks, and brain activity can all be measured to determine inter-ruptibility. [14]
2.1.1
Eye Tracking
Pupil dilation is a direct indicator of workload, according to a study by Bailey and Iqbal. Using pupil dilation is a low-latency and continuous source of data. A downside to this approach is that it requires controlled lighting, which may not be available in every situation. It also requires video recording, which may cause privacy concerns. [1]
2.1.2
Biometrics
There are many ways that human physiology can indicate emotional states. Heart rate and interbeat interval (the time
1
Munns: Tools to Improve Interruption Management
between individual heartbeats), body temperature, sweat, and brain activity are all indicators of different emotional states. [12]
Electrodermal activity (EDA) is an indicator of “anxiety, arousal, anxiousness, and emotional state,” [3]. It is essen-tially a measurement of perspiration. Skin becomes more electrically conductive as you perspire more, which is mea-sured by an EDA sensor. While the raw EDA data can be used in an algorithm to help determine interruptibility, it was found by Goyal et al. that large changes in EDA values indicated a breakpoint in the current task. [3]
Heart rate (HR) and interbeat interval (IBI) are the most common measurements of the Autonomic Nervous System in studies. It can be hard to find conclusive information from heart rate, as increases or decreases can both indicate the same emotion but in different contexts. For example, anxiety usually causes an increase in heart rate, but anxiety-producing music causes a decrease in heart rate. [12]
To measure HR and IBI in the study by Z¨uger et al., a blood volume pulse (BVP) sensor was used. Blood volume pulse is the volume of blood flowing through the measured area from each beat of the heart [4]. The BVP device emits light and then detects how much is absorbed by the oxy-hemoglobin in the blood. BVP is, “a direct indicator of cognitive load,” which makes it useful for determining inter-ruptibility [14].
An Electroencephalogram (EEG) can be used to measure brain activity. While other methods like magnetic resonance imaging (MRI) are more accurate, EEGs are portable and more practical. There has been some promising research on using a machine learning algorithm to map EEG data to emotions based on comparing the data to a participants self-reported emotion during the test [12]. EEGs have been used much more frequently to test overall cognitive load. They can also detect eye blinks, which is an indicator of how focused a person is at the time. EEG data was used in interruptibility studies by Z¨uger et al. [14].
2.2
Machine Learning
Machine learning algorithms are a way to analyze patterns in data. The benefit of a machine learning algorithm is that it can adapt as new data is introduced [9]. Machine learning is used in several instances when determining interruptiblil-ity, and it is specifically used to map biometric data to a state of interruptibility in the research of Z¨uger et al. and the research of Goyal et al. [14, 3].
The type of machine learning algorithm used in their study is known as aNaive Bayes classifier. This classifier takes a set of feature values and determines the probability of each classification possible for the item being analyzed. The key aspect of the Naive Bayes classifier is that it assumes all features are independent of each other and not correlated, which makes the algorithm much simpler than it otherwise could be. [2, 11]
For example, if an algorithm were created to determine if a fruit is an apple, it might use size, color, and shape as feature values. Say the size is 10cm, the shape is round, and the color is green. These features are then compared to the training data given to the algorithm. Training data is the set of examples given to a machine learning algorithm that it uses as examples to help classify future data given to it. If the training data contains 25 green apples out of 50 total green fruits, then the P(apple|green)=.5. This probability is
Figure 1: The participants in the study wore a head-band and wristhead-band that each contained the sensors used in the study. The tablet that caused interrup-tions is placed to the left of the participant’s main computer screen. [14]
multiplied by the probabilities given by the other features. If the probability that the fruit is an apple is higher than the probability it is any other possible fruits, than the algorithm will classify it as an apple. [2, 11]
When applied to the 2015 interruptibility study by Z¨uger et al., the features are the data points from each biometric sensor. The data from the sensors is then mapped to a state of interruptibility using data input by the participants. This study is described in detail in Section 3.1.1 [14]
3.
INTERRUPTIBILITY STUDIES
3.1
Methods Of Measuring Interruptibility
Several studies have been done to create algorithms that accurately assess the interruptibility of a person. People are generally poor at guessing the interruptibility of their colleagues, so technological help may improve the ability to better time interruptions. [14]
3.1.1
Biometric Sensors
Z¨uger et al. published a study in 2015 about their research on interruptibility. Their study investigated the question of whether psycho-physiological sensors can be used to analyze whether or not a person is interruptible at a given time. They conducted both a lab study and a field study, using ten software developers for each study. Participants in the study were software developers who were asked to do a set of programming problems. During that time, the participants were wearing several psycho-physiological sensors; The set of sensors recorded brain region activation, eye blink data, electrodermal activity (EDA), skin temperature, blood vol-ume pulse, interbeat interval, and heart rate. [14]
During the lab tests, participants were studied individ-ually. They worked on the coding problem on a desktop computer, and were interrupted at different times by a noti-fication on a Surface tablet next to them. The participants were then allowed to choose when to open the notification on the tablet, which contained a math problem that they were required to solve. After solving the problem, the par-ticipant rated their perceived interruptibility at the time, and the amount of disturbance that was caused. Both were rated on a one to five scale. [14]
train-ing data for a Naive Bayes classification algorithm. The ratings collected from the participants were used to label this training data, which is necessary for their Naive Bayes classifier. The algorithm was highly accurate in classifying between two states, interruptible and available, being accu-rate 91.5% of the time in their lab tests. While this set of sensors could accurately predict the interruptible state of a person, the setup of sensors used in this study (shown in Figure 1) is inconvenient. [14]
3.1.2
Activity Data
Another approach to measuring interruptibility is to use data from computer interactions. In their next field study, Z¨uger et al. created an algorithm called FlowTracker that uses mouse clicks, mouse movement, typing, open applica-tions, and login state to determine interruptibility. Their al-gorithm gives each of these actions a weight and calculated a rolling sum over the past 3 minutes, and compares this sum to the user’s average activity over the previous week. If that sum ever reaches into the top 9% of their previous week’s activity range, the algorithm classifies the user as busy. If the sum reaches the top 4%, the user is classified as very busy. [13]
To prevent the status from changing too often, a smooth-ing algorithm is applied. As additional requirements to switch from not busy to the busy state, the user must exceed a threshold of 100 clicks and key presses in the previous 4 to 7 minutes, and the user must be active in all 3 of the previ-ous minutes. This excludes scenarios where a brief burst of typing switches the user to a busy state. [13]
A downside to using static values for the smoothing algo-rithm requirements is that it makes the program less adapt-able to different scenarios. For example, graphic design-ers who mostly use mouse clicks and rarely use typing will rarely meet the threshold requirements to switch to the busy state. To fix this problem, the smoothing algorithm was modified so that the threshold values are modified based on each user’s interaction data. [13]
Another simple enhancement to determining interruptibil-ity is to incorporate calendar data as well. Approaches like the FlowLight, which is described in more detail below, can be synced with the user’s Skype account. This allows cal-endar appointments and meetings to automatically change the user’s state to busy. [13]
3.1.3
Finding the Best Combination of Sensors
The use of the FlowTracker algorithm was successful in Z¨uger et al.’s FlowLight field study in 2017. However, there are some limitations to this set of data. Algorithms based on computer activity do not capture interruptibility at
mo-Table 1: Accuracy of Sensor Combinations [16]
Sensor Combination Accuracy Baseline Accuracy 60.2%
Fitbit 66.2% Polar 62.5% Computer Monitoring 74.8% Fitbit + Polar 68.3% Fitbit + Computer Monitoring 75.7% Polar + Computer Monitoring 75.0% Fitbit + Polar + Computer Monitoring 75.3%
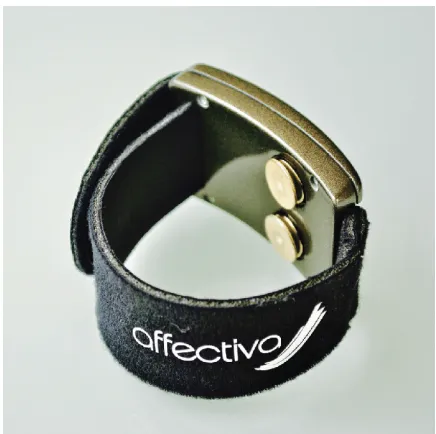
Figure 2: The Affectiva Inc. Q Sensor, which was the wristband used to sense EDA data in the inter-ruption study by Goyal et al. [3]
ments when the user is not currently clicking or typing on their computer, such as when they are reading or taking notes by hand. [13] In these situations, biometric recogni-tion would be more effective at measuring the user’s inter-ruptibility. [15]
However, biometric sensors have their own drawbacks. The sensors used in the 2015 study by Z¨uger et al. included an EEG that is worn on the head. This would be considered impractical in a regular office environment and for long term use. [14]
In a similar study using police detectives as the subjects, it was found that calculating the acceleration of EDA data was extremely effective at predicting interruptibility. In the study, it was found that the detectives were far more likely to solve a case when clues were given during interruptible periods rather than at random times. The EDA data can be measured with a wristband device (shown in Figure 2), which could be practical if implemented as a feature in a future smartwatch [3]
To further investigate the usefulness of each sensor, Z¨uger et al. carried out a field study testing several different com-binations of biometric sensors. The goal of the study was to discover how well each combination could detect interrupt-ibility. The 13 participants, who were all professional soft-ware developers, were studied over two weeks. The biomet-ric sensors worn by the participants were the Fitbit Charge 2 to measure heart rate and sleep duration, and the Polar H7 chest strap to measure heart rate variability. The par-ticipants were encouraged to wear the Fitbit at all times, and the Polar H7 chest strap was meant to be worn during working hours. Computer interaction data was also recorded from each participant’s computer. The participants were also repeatedly asked how interruptible they were through popup notifications throughout the study. [16]
Table 1 shows the accuracy of using each combination of sensors to classify the participants as either interruptible
3
Munns: Tools to Improve Interruption Management
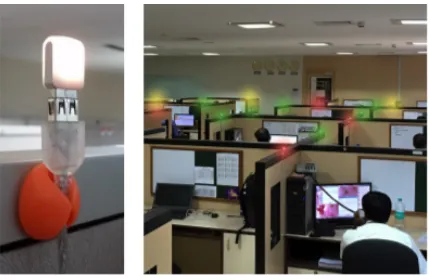
Figure 3: Left: An individual FlowLight.
Right: An office using FlowLights at each cubicle.
or not interruptible. The baseline classifier always chose whichever state the participant was most likely to be in. The computer monitoring was the most effective individu-ally, though it doesn’t capture certain situations as I have covered before. The Fitbit was the most effective of the two biometric sensors. One reason for this was that the Fitbit attempted to record sleep time, and interviews with the par-ticipants suggested that they were less interruptible when they got less sleep the night before. One participant said, “When [last night] was relatively short, I have a hard time to concentrate anyways, and want to be disturbed less.” [16] The results indicate that a Fitbit combined with computer interaction data would be the most effective method of mea-suring interruptibility. Though the accuracy of the Fitbit with computer data was only 0.9% more accurate than the computer data alone, the combination is able to classify in-terruptibility during times where a person is not using their computer. It would also be more convenient than using a chest strap device like the Polar H7. [16]
3.2
Preventing Interruptions
With algorithms in place to determine how interruptible a user is, the next step is to use that to prevent interruptions. There have been several field and lab studies on the effect of using interruptibility technology in the workplace. In-person interruptions are a very common type and hard to avoid. Z¨uger et al. returned to the topic of interruptibility to create a more practical product, FlowLight [13]. FlowLight is a stoplight like device that automatically changes color based on the interruptibility of the user (shown in Figure 3). The light is green when the user is interruptible, and when the user is busy the LED turns red. [13]
3.2.1
Passively Displaying Interruptibility
To research the long term impact of FlowLight, Z¨uger et al. installed the device in over 15 locations in 12 different countries, involving 449 people in their study. This imple-mentation of FlowLight used a simple algorithm based on computer usage (clicks, mouse movement, and open appli-cations) to determine how busy the user was. The algorithm was less precise but also less invasive than the assortment of biometric sensors used in the 2015 study. [13]
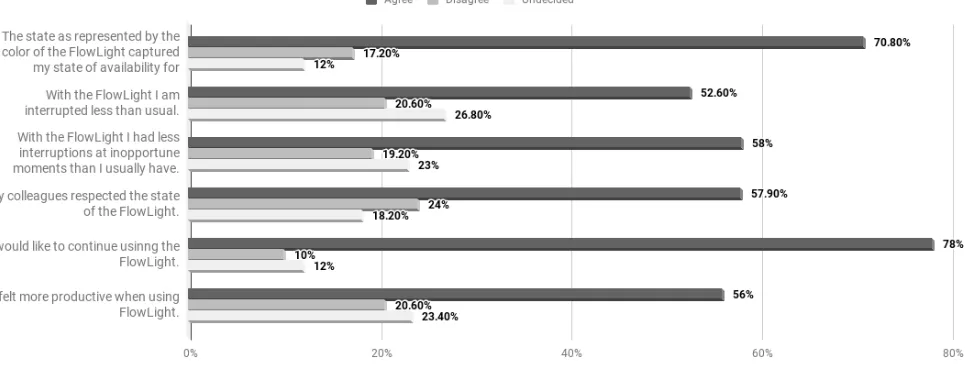
The FlowLight study resulted in participants becoming more aware of the cost of interruptions. 55% of the 182 participants surveyed agreed that they were interrupted less
than usual, and 59.3% agreed that they suffered fewer in-terruptions at inopportune moments. Further results are shown in Figure 4. [13]
Despite the simplicity of the algorithm, most users agreed that it reflected their state of busyness correctly most of the time. Overall, the device was well liked by the participants in the study as 85.5% remained active one month after the study concluded (384/449). [13]
3.2.2
Unintended Consequences of FlowLight
While several benefits of interruption management tools have been discussed in this paper, there are also some anx-ieties regarding the use of these technologies which were voiced by the participants in the FlowLight study. There were also a few scenarios created by the FlowLight device that created negative emotions. [13]
When the device was first installed during the FlowLight field study, there was a small increase in interruptions due to curious co-workers who wanted to find out what the device was. However, this problem only lasted a few days. [13]
Around 8% of the 183 participants who were surveyed said that the FlowLight made them feel exposed. One of the survey participants was worried that the light showing a non-busy state would lead co-workers to think they were not actually working. Another situation where the FlowLight indirectly caused negative emotions is when co-workers ig-nored the light and interrupted a participant anyways. The creators of FlowLight claim that these issues go away after a short time and that “they can be mitigated by clear direction from management.” [13]
It is also easy to imagine a situation where managers col-lect FlowLight data to judge how hard an employee works. This would be problematic due to the imperfect nature of the algorithm. This is not addressed in any of the papers by Z¨uger et al., though no tools are described that would enable this type of tracking of employees.
3.2.3
Delaying Notifications
Yuan et al. created a software called Email Delivery Me-diation System (EDMS) that attempts to delay email no-tifications to task breakpoints. It uses an algorithm based on computer interaction data that is similar to the one cre-ated for FlowLight to determine when a user is either busy or interruptible. It uses mouse clicks and keystroke data, and it also considers moments when the user is switching to a different application. A user is likely interruptible when switching to a different application, so the algorithm often uses those times to introduce notifications. [6]
In a study of the use of EDMS, the application reduced “feelings of hindrance” by a significant amount. During the study, participants were asked to rate their feeling of hin-drance created by each email notification on a 1 to 7 scale. Without EDMS, the average feeling of hindrance was 2.5. This figure lowered to 1.8 with the EDMS. [6]
3.2.4
Preventing Self-Interruptions
Figure 4: The results of several survey questions answered by 183 of the participants in the FlowLight field study. [13]
25 minute a timer, during which they are blocked from vis-iting certain distracting sites in their browser, and certain applications on their PC or smartphone. Which sites and apps are blocked is determined by the user. [5]
Kim et al. conducted a study to find out how use of the app impacted work habits and what impact the site and app blocking feature had compared to a regular timer. The study used forty unversity graduate students as participants. The participants were asked to use the PomodoLock app over 2 weeks, with half of the participants receiving a version that actually contained the blocking feature. Overall, the app quantitatively reduced the amount of time participants spent on distracting sites. The participants who received the version of the app used PomodoLock more often and completed more sessions. [5]
4.
CONCLUSIONS
Interruptions carry a high cost, but there are now tools that can assist in managing interruptions. Field studies have shown several benefits to using these devices, including de-creased interruptions and inde-creased productivity. The differ-ent approaches to measuring interruptibility each have their own benefits and disadvantages. Computer activity and cal-endar data can be used to estimate interruptibility without being too invasive or cumbersome, but it doesn’t capture situations where the user is not interacting with their com-puter or is doing a mentally intensive task that doesn’t in-volve much clicking or typing. Biometric data can increase accuracy when combined with computer activity, but the devices used to record data in many studies are invasive and would be impractical to wear on a day-to-day basis. Future research aims to combine these approaches in order to cre-ate an accurcre-ate estimation of interruptibility while recording only what biometric information is necessary. [16]
Acknowledgments
I would like to thank professors Kristin Lamberty and Elena Machkasova for their invaluable feedback and guidance on
this paper. I would also like to thank Brian Mitchell for his feedback.
5.
REFERENCES
[1] B. P. Bailey and S. T. Iqbal. Understanding changes in mental workload during execution of goal-directed tasks and its application for interruption management.
ACM Trans. Comput.-Hum. Interact., 14(4):21:1–21:28, Jan. 2008.
[2] W. contributors. Naive bayes classifier, Apr 2019. [3] N. Goyal and S. R. Fussell. Intelligent interruption
management using electro dermal activity based physiological sensor for collaborative sensemaking.
Proc. ACM Interact. Mob. Wearable Ubiquitous Technol., 1(3):52:1–52:21, Sept. 2017.
[4] D. Jones. The blood volume pulse - biofeedback basics.
https://www.biofeedback- tech.com/articles/2016/3/24/the-blood-volume-pulse-biofeedback-basics, May 2018. Accessed:
2019-04-08.
[5] J. Kim, C. Cho, and U. Lee. Technology supported behavior restriction for mitigating self-interruptions in multi-device environments.Proc. ACM Interact. Mob. Wearable Ubiquitous Technol., 1(3):64:1–64:21, Sept. 2017.
[6] Y. Kobayashi, T. Tanaka, K. Aoki, and K. Fujita. Automatic delivery timing control of incoming email based on user interruptibility. InProceedings of the 33rd Annual ACM Conference Extended Abstracts on Human Factors in Computing Systems, CHI EA ’15, pages 1779–1784, New York, NY, USA, 2015. ACM. [7] G. Mark, D. Gudith, and U. Klocke. The cost of
interrupted work: More speed and stress. In
Proceedings of the SIGCHI Conference on Human Factors in Computing Systems, CHI ’08, pages 107–110, New York, NY, USA, 2008. ACM. [8] G. Mark, S. T. Iqbal, M. Czerwinski, P. Johns,
A. Sano, and Y. Lutchyn. Email duration, batching
5
Munns: Tools to Improve Interruption Management
and self-interruption: Patterns of email use on productivity and stress. InProceedings of the 2016 CHI Conference on Human Factors in Computing Systems, CHI ’16, pages 1717–1728, New York, NY, USA, 2016. ACM.
[9] S. Pandey. An introduction to machine learning. [10] K. Pattison. Worker, interrupted: The cost of task
switching.
https://www.fastcompany.com/944128/worker-interrupted-cost-task-switching, Jul 2012. Accessed: 2019-04-18.
[11] B. Stecanella. A practical explanation of a naive bayes classifier. https://monkeylearn.com/blog/practical-explanation-naive-bayes-classifier/, 2018. Accessed: 2019-04-08.
[12] T. Thanapattheerakul, K. Mao, J. Amoranto, and J. H. Chan. Emotion in a century: A review of emotion recognition. InProceedings of the 10th International Conference on Advances in Information Technology, IAIT 2018, pages 17:1–17:8, New York, NY, USA, 2018. ACM.
[13] M. Z¨uger, C. Corley, A. N. Meyer, B. Li, T. Fritz, D. Shepherd, V. Augustine, P. Francis, N. Kraft, and W. Snipes. Reducing interruptions at work: A large-scale field study of flowlight. InProceedings of the 2017 CHI Conference on Human Factors in Computing Systems, CHI ’17, pages 61–72, New York, NY, USA, 2017. ACM.
[14] M. Z¨uger and T. Fritz. Interruptibility of software developers and its prediction using
psycho-physiological sensors. InProceedings of the 33rd Annual ACM Conference on Human Factors in Computing Systems, CHI ’15, pages 2981–2990, New York, NY, USA, 2015. ACM.
[15] M. Z¨uger and T. Fritz. Sensing and supporting software developers’ focus. InProceedings of the 26th Conference on Program Comprehension, ICPC ’18, pages 2–6, New York, NY, USA, 2018. ACM. [16] M. Z¨uger, S. C. M¨uller, A. N. Meyer, and T. Fritz.