64:3 (2013) 93–97 | www.jurnalteknologi.utm.my | eISSN 2180–3722 | ISSN 0127–9696
Full paper
Jurnal
Teknologi
An Exploratory Study of Malaysian Technology-based Firms Leadership
Styles
Azlin Shafinaz Arshada,b*, Amran Raslia, Mastora Mustafara,c, Nadhirah Norhalima
aFaculty of Management and Human Resource Department, Universiti Teknologi Malaysia, Malaysia
bMalaysian Academy of SME & Entrepreneurship Development (MASMED), Universiti Teknologi MARA, Malaysia cSchool of Technology Management & Logistic, College of Business, Universiti Utara Malaysia, Malaysia
*Corresponding author: [email protected]
Article history
Received :4 April 2013 Received in revised form : 25 July 2013
Accepted :15 October 2013
Abstract
Leaders are effective when they are able to determine the success or failure of a firm. In a recent study on leadership styles within technology-based firms, three leadership styles have been identified; transformational, transactional and ambidextrous leadership. The present study is conducted to determine the level of leadership styles of technology-based firms in Malaysia based on these three styles. A survey was conducted on 46 technology-based firms in Malaysia. The findings revealed that all constrcuts of leadership styles were found to be significant. Practical implications are discussed and suggestions for future research are made.
Keywords: Ambidextrous leadership, technology-based firms, transactional leadership, transformational
leadership.
© 2013 Penerbit UTM Press. All rights reserved.
1.0 INTRODUCTION
Leaders are a dynamic sources of managerial success and able to sustain competitive advantage (Yildirim and Serhat, 2011). Leadership refers to the process of how to influence people and guiding them to achieve organisational goals (Northouse, 2007). Firm’s effectiveness would differ when leaders apply different leadership styles in the organization (Nahavandi, 2002). Effective leaders are important because they are one of the factors that determine the success or failure of a group, organisation or even a whole country (Fiedler, 1996). With today’s stiff competition, studying leadership style is important to identify suitable styles to be adopted by firms (Glantz, 2002). A study conducted by Rosing, Frese and Bausch (2011) indicated three leadership styles were found within technology company. These styles are transformational, transactional and ambidextrous.
Growing economies are now looking at high-technology sectors such as bio-technology, nano-technology, ICT and many more as these are the main source of future economic development (Cooper, 2006). It has also been highlighted that technology firm have an impact on economic growth, job opportunities and many innovations (Massa & Testa, 2008). However, to a certain level, limited studies have been taken on technology-based firms as their main focus (Majid, Ismail & Cooper, 2011; Ajagbe et al., 2012).
Transformational leadership involves inspiration and charisma. It involves leaders to come up with strategic and clear
vision and communicate it effectively with their subordinates (Bass, 1985). The main components of transformational style are idealized attributes, idealized behavior, inspirational motivation, individualized consideration and intellectual stimulation. Robbins (2003) defined transactional leadership as directing and stimulating followers in accordance to stated goals by explaining their role and work requirement. Bass (1985) and Bass and Avolio (2004) classifies transactional style into two main components; contingent reward and management by exception in two forms; active and passive. Ambidextrous leadership refers to a combination of both transformational and transactional leadership where leaders are capable of simultaneoulsy exploiting existing competencies and exploring new opprtunities (Schreuders and Legesse, 2012). It is important for technology firm to be aware in balancing between exploration and exploitation to ensure firm’s success (Rosing, Frese and Bausch, 2011).
2.0 RESEARCH METHOD
In determining the level of leadership styles of technology-based firms in Malaysia, quantitative research method was adopted. Since there is no available database for technology-based firms in Malaysia, a list was obtained from an agency which has been set up by Malaysian government in overseeing the development of technology-based firms and at the same time involves in providing financial assistance to technology-based firms. This study used random sampling as each individual in the population has an equal probability of being selected (Creswell, 2003). As emphasized by Leedy and Ormrod (2005), random sample is utilized when the characteristics of the sample represent the characteristic of total population. A sample of 138 technology-based firms was considered for the purpose of this study. According to Roscoe’s (1975) rule of thumb, a sample size between 30 and 500 is sufficient. The respondents were either the owner/managers due to their knowledge and expertise in terms of operation and direction of the firm. Furthermore, owners/managers are the most informed individuals about the firms’ overall operational activities (Yang, 2008).
A self-reporting instrument was developed for this study containing a total of 41 items representing leadership styles and business background. The leadership style items were adapted from the Multifactor Leadership Questionnaire (MLQ) by Bass and Avolio (2004). To facilitate coding and data interpretation, the scaling format were measured on five-point Likert scales ranging from 1= not at all, 2= once in a while, 3= sometimes, 4= frequent and 5=very frequent. The choice of 5-point Likert scale is to reduce confusion among respondents and to ensure decision is made much more swiftly compared to 7-point scale. Besides, these choices clearly identify the agreement, neutrality and disagreement.
A cover letter was prepared to explain the purpose of the online questionnaire to the respondents together with the 41 itemed questionnaires. A total of 138 questionnaires were distributed for the study. Respondents were notified to participate in the survey via email and were given two weeks to complete the questionnaire. After two weeks, a reminder letter was given through email to those who have not responded, together with the extension of the new dateline for submission. After numerous attempts, 109 questionnaires were returned but 63 were removed due to incomplete and missing data. Only 46 questionnaires were found to be usable for this study which represent approximately 33% response rate.
Data obtained were analyzed through the SPSS statistical program. Reliability analysis was conducted to identify the constructs of leadership styles. As this is an exploratory study, a t-test is performed to test the data in order to see types of leadership styles preferred by technology-based firms. In this case, the mean leadership styles are 3. Test results with p-values <0.05 will indicate that the null hypotheses should be rejected. The hypothesis is as follows:
H0: the population mean is less than 3
Ha: the population mean is more than 3.
3.0 RESULTS
A general background of companies participated in this study is shown in Table 1. The profile of the company includes the sectors, size of the company, cluster and locality of the business. From the total surveyed, 79.6 percent are technology-based firms in manufacturing sector while 20.4 percent is in services sector. The respondents were heavily from small enterprises
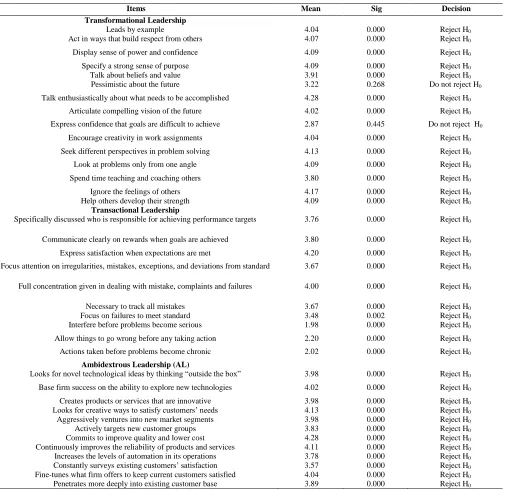
with 81.6 percent (N=37), followed by medium enterprises, 10.3 percent (N=4) and large enterprises, 8.1 percent (N=5). Majority of the technology-based firms locality are in the central region (69.4 percent), southern region (14.3 percent), northern region (10.2 percent) and eastern region (6.1 percent). The Cronbach’s alpha value for overall leadership styles representing 37 items is 0.864. It indicates that the high Cronbach’s alpha value are within the acceptable level as stated by Nunnally (1978) and Pallant (2001), where value above 0.7 is considered reliable. Table 2 presents descriptive analyses for the items of all the three leadership styles. Results of the study show the mean ranging between 4.28 and 1.98 respectively. For transformational style, the highest mean is talk enthusiastically about what needs to be accomplished (m= 4.28) while the lowest is express confidence that goals are difficult to achieve (m=2.87). The highest mean for transactional style is express satisfaction when expectations are met (m=4.20) and interfere before problems become serious (m=1.98) has the lowest mean. The mean for ambidextrous style is highest for commits to improve quality and lower cost (m=4.28) and lowest mean for constantly surveys existing customers’ satisfaction (m=3.57). All items measuring leaderhsip styles is significant except two items. The mean pessimistic about the future (m=3.22) and express confidence that goals are difficult to achieve (m=2.87) was not significantly different from the hypothesized value of 3 where the significance values are p =.268 and p=.445 respectively. Thus, at the significance level (0.05), we cannot reject the null hypothesis.
Table 1 Companies profile
Table 2 One-sample T-test for itemized leadership styles
Items Mean Sig Decision
Transformational Leadership
Leads by example 4.04 0.000 Reject H0
Act in ways that build respect from others 4.07 0.000 Reject H0
Display sense of power and confidence 4.09 0.000 Reject H0
Specify a strong sense of purpose 4.09 0.000 Reject H0
Talk about beliefs and value 3.91 0.000 Reject H0
Pessimistic about the future 3.22 0.268 Do not reject H0
Talk enthusiastically about what needs to be accomplished 4.28 0.000 Reject H0
Articulate compelling vision of the future 4.02 0.000 Reject H0
Express confidence that goals are difficult to achieve 2.87 0.445 Do not reject H0
Encourage creativity in work assignments 4.04 0.000 Reject H0
Seek different perspectives in problem solving 4.13 0.000 Reject H0
Look at problems only from one angle 4.09 0.000 Reject H0
Spend time teaching and coaching others 3.80 0.000 Reject H0
Ignore the feelings of others 4.17 0.000 Reject H0
Help others develop their strength 4.09 0.000 Reject H0
Transactional Leadership
Specifically discussed who is responsible for achieving performance targets 3.76 0.000 Reject H0
Communicate clearly on rewards when goals are achieved 3.80 0.000 Reject H0
Express satisfaction when expectations are met 4.20 0.000 Reject H0
Focus attention on irregularities, mistakes, exceptions, and deviations from standard 3.67 0.000 Reject H0
Full concentration given in dealing with mistake, complaints and failures 4.00 0.000 Reject H0
Necessary to track all mistakes 3.67 0.000 Reject H0
Focus on failures to meet standard 3.48 0.002 Reject H0
Interfere before problems become serious 1.98 0.000 Reject H0
Allow things to go wrong before any taking action 2.20 0.000 Reject H0
Actions taken before problems become chronic 2.02 0.000 Reject H0
Ambidextrous Leadership (AL)
Looks for novel technological ideas by thinking “outside the box” 3.98 0.000 Reject H0
Base firm success on the ability to explore new technologies 4.02 0.000 Reject H0
Creates products or services that are innovative 3.98 0.000 Reject H0
Looks for creative ways to satisfy customers’ needs 4.13 0.000 Reject H0
Aggressively ventures into new market segments 3.98 0.000 Reject H0
Actively targets new customer groups 3.83 0.000 Reject H0
Commits to improve quality and lower cost 4.28 0.000 Reject H0
Continuously improves the reliability of products and services 4.11 0.000 Reject H0
Increases the levels of automation in its operations 3.78 0.000 Reject H0
Constantly surveys existing customers’ satisfaction 3.57 0.000 Reject H0
Fine-tunes what firm offers to keep current customers satisfied 4.04 0.000 Reject H0
Penetrates more deeply into existing customer base 3.89 0.000 Reject H0
Frequency Percentage
Sectors Manufacturing 36 79.6
Services 10 20.4
Size of company Small 37 81.6
Medium 4 10.3
Large 5 8.1
Industry Cluster (can have more than
one)
Bio-technology 14 25
Industrial Product 8 14.3
Electronics & Electrical 10 19.6
Others 24 41.1
Business location Northern region 5 10.2
Central region 32 69.4
Southern region 7 14.3
Table 3 One-sample T-test for leadership styles dimensions
Table 4 One-sample T-test for overall leadership styles
Table 4 depicts the overall leadership styles. The mean of the variable leadership for this particular sample of technology-based firms are 3.762 which statistically significantly different from the test value of 3. We would conclude that leaderhsip styles of this technology-based firms is significantly different from the hypothesized value of 3 and H0 is rejected.
4.0 CONCLUSION
The main objective of this study was to determine the level of dimensions of leadership styles in the context of technology-based firms in Malaysia. The study has revealed that leadership styles; transformational style, transactional style and ambidextrous style seem to be applicable to technology-based firms in Malaysia. This is consistent with study done by Schreuders and Legesse (2012) where these styles have been found within technology-based firm. In fact, a study conducted by Marmaya et al. (2011) found that transformational and transactional leadership styles are prevalent among Malaysian managers. Furthermore, the results imply that ambidextrous style seems to be the key to leadership styles for technology-based firm. In a comparison of three different leadership styles (N= 46), ambidextrous leadership has the highest mean (m=3.966) followed by transformational and transactional leadership (m=3.928 and m=3.314).
Similar results have been obtained by Bass and Avolio (2004) with transformational leadership (m=2.85) has a higher mean compared to transactional leadership (m=2.27). This is in line with studies by Yang (2008) that the mean for transformational leadership is higher than transactional leadership with mean=3.00 and mean=2.68. In another study by Rumani, Ramesh and Jayakrishnan (2010) on 300 managers, they found that leaders in public sector organization in India do have both transformational and transactional behaviors with the mean values of 2.92 and 2.83. All these studies supports that transformational leadership is more effective than transactional leadership as suggested by Gardner and Stough (2002)
Few limitations have been identified from this study. As this current study only focus on technology-based firms in Malaysia, similar study may reflect different results in other parts of the world. Moreover, since this study is an exploratory study, the results of this study do not represent the whole of Malaysian technology-based firms. It is only a reflection on a small fraction of the total population. Therefore cross regional study should be considered for future research. Realizing the importance of leadership in any organization, the styles adopted by leaders is important in ensuring the success of a firm and they should take the initiative to improve their leadership styles.
References
[1] Ajagbe, M. A., Choi S. L., Aslan, S. A., Ismail, K. 2012. Investment in
Technology Based Small and Medium Sized Firms in Malaysia: Roles
For Commercial Banks. International Journal of Research in
Management & Technology (IJRMT). 2(2): 147–153.
[2] Arham, A. F & Muenjohn, N. 2012. Leadership and Organisational Performance in Malaysian SMEs: The Mediating Role of Entrepreneurial Orientation. Proceeding at Business and Information
2012. Sapporo, Japan, July 3–5. G31–41.
[3] B. M. Bass & Avolio, B. J. 2004. Multifactor Leadership
Questionnaire: Manual and Sample Set. 3rd ed. Redwood City, CA: Mind Garden.
[4] Bass, B. M. 1985. Leadership and Performance Beyond Expectations.
New York: Free Press
[5] Cooper, S. 2006. Knowledge and Expertise for High-Technology
Entrepreneurship: A Tale of Two Sectors, International Journal of Knowledge Management Studies. 1(1/2): 59–78
[6] Cresswell, J. W. 2003. Research Design: Qualitative, Quantitative and
Mixed Method Approaches. 2nd ed. Thousand Oaks, CA: Sage.
[7] Fiedler F. E. 1996. Research on Leadership Selection and Training: One View of the Future Administrative. Science Quarterly. 41(2): 241– 250.
[8] Gardner, L. and Stough, C. 2002. Examining the Relationship Between
Leadership and Emotional Intelligence in Senior Level Managers.
Leadership and Organization Development Journal. 23(1–2): 68–78
[9] Glantz, J. 2002. Finding your Leadership Style. A Guide for Educators;
Association for Supervision and Curriculum Development.
[10] Leedy ,P. and Ormrod, J. 2005. Practical Research: Planning and Design. 8th ed. Upper Saddle River, NJ, Prentice Hall.
[11] Majid, I. A, Ismail, K and Cooper, S. 2011. Prevalence of
Entrepreneurial Management Practices in Technology-Based Firms in
Malaysia, African Journal of Business Management. 5(6): 2075–2082.
[12] Marmaya, N. H., Hitam, M., Muhamad Torsiman, N. and
Balakrishnan, B. KPD. 2011. Employees’ Perceptions of Malaysian
Managers’ Leadership Styles and Organizational Commitment. African
Journal of Business Management. 5(5): 1584–1588.
[13] Massa, S and Testa, S. 2008. Innovation and SMEs: Misaligned
Perspectives and Goals Among Entrepreneurs, Academics, And Policy
Makers. Technovation. 28: 393–407
www.elsevier.com/locate/technovation. doi:10.1016/j.technovation.2008.01.002.
[14] Nahavandi, A. 2002. The Art and Science of Leadership. 3rd ed. Upper
Saddle River, New Jersey: Prentice Hall.
[15] Northouse P. G. 2007. Leadership: Theory and Practice. 4th ed. Sage
Publications, London.
[16] Nunnally, J. 1978. Psychometric Theory. New York: McGraw-Hill.
[17] Pallant, J. 2001. SPSS Survival Manual: A Step by Step Guide to Data
Analysis Using SPSS For Windows (Version 10-11). Buckingham: Open University Press.
[18] Rukmani, K., Ramesh, M. and J. Jayakrishan. 2010. Effect of
Leadership Styles on Organizational Effectiveness. European Journal of Social Sciences. 15(3): 365–370.
[19] Robbins, Stephen P. 2003. Management. French Forest, N.S.W,
Pearson Education.
[20] Roscoe, J. T. 1975. Fundamental Research Statistics for the Behavioral Sciences. New York: Holt.
Dimension Mean Significant Decision
Transformational Style 3.928 0.000 Reject H0
Transactional Style 3.314 0.000 Reject H0
Ambidextrous Style 3.966 0.000 Reject H0
Variable Mean Significant Decision
[21] Rosing, K., Frese, M., & Bausch, A. 2011. Explaining the
Heterogeneity of the Leadership-Innovation Relationship:
Ambidextrous Leadership. The Leadership Quarterly. 22(5): 956–974.
doi:10.1016/j.leaqua.2011.07.014.
[22] Schreuders, J. & Legesse, A. 2012. Organizational Ambidexterity: How Small Technology-based firms Balance Innovation and Support
Organizational Ambidexterity. Technology Innovation Management
Review. (February): 17–21.
[23] Yang, C-W. 2008. The Relationships Among Leadership Styles,
Entrepreneurial Orientation, and Business Performance. Managing
Global Transitions. 6(3): 257–275.
[24] Yildirim, H. & Serhat, S. 2011. Effects of Owners’ Leadership Style on Manufacturing Family Firms’ Entrepreneurial Orientation in the
Emerging Economies: An Empirical Investigation in Turkey. European