Using Multi-Criteria Analysis to Identify Suitable Light Rail Transit Route
Ahmad Nazri Muhamad Ludin & Siti Noor Haslinda Mohd Latip Faculty of Built Environment
University Teknologi Malaysia 81310 UTM Skudai
Johor, Malaysia
E-mail: [email protected]
Abstract
Public transportation planning and development are undergoing continuous changes often prompted by both external factors and policy-directed responses. The role of public transit, particularly rail transit, becomes increasingly importance with the changing demographic and economic pattern. The trend of returning to urban living for e.g. has significantly increased the demand for efficient public transportation in urban centres. However, the design and development of Light Rail Transit (LRT) route seldom takes into consideration land use changes and demand. This paper investigates how non-spatial and spatial data can be integrated within a multi criteria decision framework to formulate and evaluate land use development corridor to determine suitable route for LRT. A raster base multi-criteria analysis model was developed base on a set and specific objectives, criteria, indicator and data requirement. The set criteria and indicator proposed are in line with the objectives to improve public transportation as stipulated in the Kuala Lumpur Structure Plan. A case study approach is undertaken within a selected LRT railroad in Kuala Lumpur, Malaysia. The model, integrating GIS and external software, shows that suitable LRT alignment can be identified that take into account social, institutional and environmental objectives. The approach will assist in the planning and development of LRT network, and thus maximizing usage of rail-based public transport to serve the community.
Public transportation planning and development are undergoing continuous changes often
prompted by both external factors and policy-directed responses. As such, public
transportation is a vital component in any urban area and often regarded as a sustainable form
of urban transportation. It serves as a promising solution to the problem of transportation
demand in most urban cities. Public transportation is also considered as a tool used by
transportation planners in solving various transportation related problems, particularly which
are related to traffic congestion in urban areas.
Most public transportation modes in an urban area are based on roads and rails. Examples of
road based transportation modes are buses and taxis, while rail transportation modes are Light
Railway Transit (LRT), train and monorail. It is important to note that rail-based public
transportation should be fast, efficient, convenient and affordable, and able to carry a capacity
which is higher than whatever that can be accommodated by buses (Parkinson, 1989).
LRT is one of the public transportation modes that are popular in most developed countries.
There are more than 300 LRT systems of various types and sizes that have been successfully
implemented in 33 countries all over the world, including Hong Kong, Manila, United
Kingdom and Mexico (Bliss, 1989). The capability of LRT that can carry between
15,000-20,000 passengers per day or equivalent to 3,000-15,000-20,000 passengers per hour, makes the
system as an effective public transportation (Parkinson, 1989). In Asia, poor levels of service
on public transportation often lead to the vicious cycle in which the transportation system is
shifted to automobile-biased motorization. In addition, Asia also constitutes 85% of its inland
surface passenger transportation (in terms of million of kilometers) to public transportation
(including railway), which is almost double the world standard of around 45% (Wong & Lam,
2006). In effect, it is increasingly important to formulate an effective policy on the planning,
management and operation of the public transportation system including LRT.
It should be noted however that the main problems that are usually identified are from the
aspect of integration i.e. mistakes in integrating LRT route alignment or the failure in taking
into account surrounding land uses, or the linkages between other public transportation modes
that are not properly planned. The lack of integration often creates problems, such as
minimum usage of the LRT services and contributes to the financial loss incurred by the rail
development and also neglecting the macro and micro issues related to public transportation
and the community (Bickel, ____).
Thus, public transportation planners are often faced with a continuing challenge in refining
their ability to model the interactions between land uses and transportation demand and
supply. GIS as such is seen as a powerful tool to develop better public transportation analysis
techniques due to its ability to manage, recall and evaluate information effectively. It is also
regarded as a comprehensive approach due to its ability to consider various inter-related
criteria in the decision-making process. This paper will highlight on the application of
multi-criteria techniques incorporated with GIS in identifying possible LRT railroad alignment that
take into consideration important and critical spatial and aspatial criteria.
2.0 RESEARCH METHODOLOGY
In this case study, analyses are carried out on two new growing centers in Kuala Lumpur
suburbs, the capital city of Malaysia. The selection of the research area is based on the
demand of existing railroad services coverage that need to be added and extended to new
populated area. In addition, the land use meets the criteria for new railroad alignment. Since
the location of the case studies, Bukit Jalil-Seputeh and Bandar Tun Razak-Sungai Besi, are
adjacent it will be practical to integrate the allocation of route alignment in this two areas.
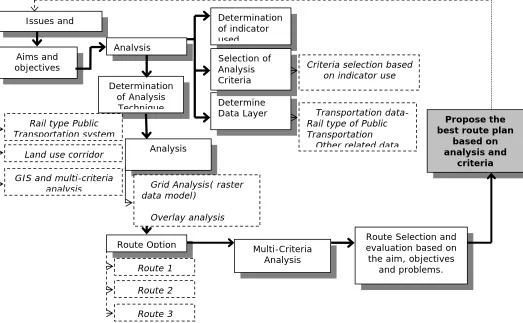
There are four main stages involves in the implementation of this research (Figure 1), which
are:
a) to identify the objectives and evaluation criteria
b) to implement the multi-criteria analysis,
c) the generation of alternative route
d) evaluation and selection of route
In creating the best possible route, the selection of criteria also has to be selected thoroughly
in order to meet the objectives set for the rail-based public transportation. Determining an
Issues and Aims and objectives Analysis Determination of Analysis Technique
Route Selection and evaluation based on the aim, objectives
and problems.
Propose the best route plan
based on analysis and criteria Determination of indicator used Route Option Route 1 Route 2 Route 3 Determine
Data Layer • Transportation
data-Rail type of Public Transportation
• Other related data
Selection of Analysis Criteria
Criteria selection based on indicator use
Analysis
• Grid Analysis( raster data model)
• Overlay analysis Rail type Public
Transportation system
Land use corridor
GIS and multi-criteria analysis
Multi-Criteria Analysis
Figure 1: Research Methodology
2.1 ESTABLISHING RESEARCH OBJECTIVES AND SELECTION OF
CRITERIA
Planning philosophy and policy formulation are vital for the development of a public
transportation system particularly in highly populated areas (Wong & Lam, 2006). Therefore,
one of the key aspects of the research is to establish the critical strategic policies effecting the
development of public transport in the study area. In determining the LRT railroad
development corridor, the transportation strategic policies is translated into criteria to provide
the basis for selecting suitable development area that take into consideration various factors.
This selected criterion is also base on the strategic policies stipulated by the Kuala Lumpur
Structure Plan (KLSP) which will form the basis in generating scenario development for the
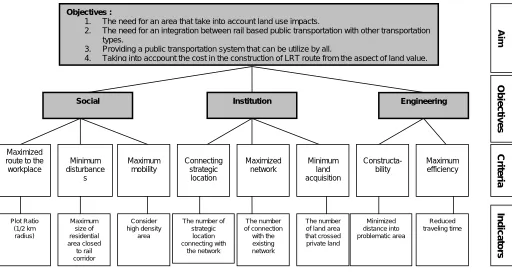
The objective based criteria are then further refined and detailed out into sub-criteria and
indicators. This is based on a study carried out by the Federal Town and Country Planning on
rail based public transportation, and agreed upon with various stake holders in Klang Valley
Region where the study area is located (Figure 2).
Social Institution Engineering
O b je c tiv e s C ri te ri a Maximized route to the workplace Minimum disturbance s Maximum mobility Connecting strategic location Maximized network Minimum land acquisition Constructa-bility Maximum efficiency In d ic a to rs Plot Ratio (1/2 km radius) Maximum size of residential area closed to rail corridor Consider high density area
The number of strategic location connecting with the network The number of connection with the existing network The number of land area that crossed private land Minimized distance into problematic area Objectives :
1. The need for an area that take into account land use impacts.
2. The need for an integration between rail based public transportation with other transportation types.
3. Providing a public transportation system that can be utilize by all.
4. Taking into accpount the cost in the construction of LRT route from the aspect of land value.
A
im
Reduced traveling time
Figure 2: Hierarchy of Aims, Objectives, Criteria and Indicators
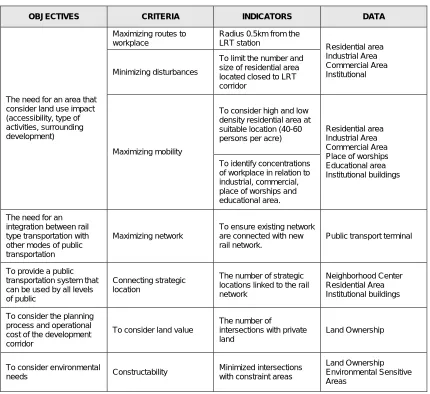
To carry out the analysis in GIS, the criteria is translated into a series of conditions that meet
the objectives explained earlier. These classifications of conditions are then used in the spatial
analysis using the required data, and the potential transportation nodes and services can be
identified (Table 3). The criteria are assumed to have taken account all related rail
transportation problems that have been identified in the Kuala Lumpur Structure Plan and the
Table 3: Relationship between Objectives, Indicators and Data
OBJECTIVES CRITERIA INDICATORS DATA
Maximizing routes to workplace
Radius 0.5km from the LRT station
Minimizing disturbances
To limit the number and size of residential area located closed to LRT corridor
Residential area Industrial Area Commercial Area Institutional
To consider high and low density residential area at suitable location (40-60 persons per acre) The need for an area that
consider land use impact (accessibility, type of activities, surrounding development)
Maximizing mobility
To identify concentrations of workplace in relation to industrial, commercial, place of worships and educational area.
Residential area Industrial Area Commercial Area Place of worships Educational area Institutional buildings
The need for an integration between rail type transportation with other modes of public transportation
Maximizing network
To ensure existing network are connected with new rail network.
Public transport terminal
To provide a public transportation system that can be used by all levels of public
Connecting strategic location
The number of strategic locations linked to the rail network
Neighborhood Center Residential Area Institutional buildings
To consider the planning process and operational cost of the development corridor
To consider land value
The number of
intersections with private land
Land Ownership
To consider environmental
needs Constructability
Minimized intersections with constraint areas
Land Ownership Environmental Sensitive Areas
2.2 MODEL ANALYSIS
Given reliable data and using a suitable method of analysis, Geographic Information System
(GIS) is seen as an effective tool to generate alternatives in the selection and solving the
problems of planning and development of a railroad. In this case study, a Decision Support
System (DSS) multi-criteria approach is undertaken using a grid base GIS data layer. The
DSS using a combination of GIS data, urban model and computer presentation technique has
been proven to be an effective tool to improved planning decisions (Ludin & Yaakup, 2006).
By incorporating spatial data, the Spatial Decision Support System (SDSS) structure and
information access make possible to visualize the world in ‘reality’ and support the
capabilities for analyzing, prediction and making planning decisions about development
In this study, a DSS software DEFINITE is used to evaluate development alternatives of the
LRT railroad alignment and corridor. A 20m x 20m grid base data layers are generated from
the existing raw data to support the analysis. In general, the DSS involve 4 basic steps, i.e.
(1) identifying assessment criteria, (2) determining scale measurement for criteria assessment,
(3) the multi criteria analysis, and (4) sensitivity analysis and uncertainties analysis. Steps (1)
and (2) has been explained in 2.1, while steps (3) and (4) will be explain in 2.3 and 2.4.
Figure 4 shows an example of the model in generating the predetermined alternatives.
2.3 GENERATION OF ALTERNATIVES
This study has selected three types of railroad layout which are ‘branch’, ‘loop’ and ‘radial’ in
generating development alternatives. Using spatial analysis model, all three types of routes
will be tested on its effectiveness and sensitivity towards the environment and other physical
criteria in providing the necessary urban LRT railroad services. The non-spatial analysis
component will be analyzed in an external environment. It is important to note however, that
the analysis need to provide the capability to maximized the output such as maximizing route
to workplace, connecting strategic locations and maximizing network. As such, all the three
routes; ‘branch’, ‘loop’ and ‘radial’ will be evaluated against the set criteria that has been
selected. Constraint areas identified will also be analyzed with the criteria. An optimal route
will then be selected after rigorous and iterative analysis done on the three railroads layout.
2.4 EVALUATION AND SELECTION OF ALTERNATIVES
To facilitate in the evaluation and selection for an optimal rail route, as explained earlier this
research used DEFINITE 2.0, whereby it will be carried out in a non-spatial analysis
environment. Although ARCGIS application could not be used interactively with DEFINITE
software, it is capable to interpret the output of the analysis (spatial data) to non-spatial data
DATA LAYERS 1ST STAGE
Land use
Residential
Commercial
Educational
Institutional
Neighborhood center
Administration
Transportation “Radial” route
Areas that are suitable and need rail network connection
Study A Boundar
rea y
Radial_Buff
Criteria area in the coverage of 400m from “Radial” route
RESELECT
RESELECT
RESELECT BUFFER
CLIP
UNION
Area of route network 400m in the site boundary Industrial
4TH STAGE 3RD
STAGE 2ND
STAGE
At this stage, the value set for the criteria and sub-criteria is crucial to the outcome of the
analysis. The criteria and sub-criteria unit are determined in quantitative value (such as the
land area and total population) or in qualitative form (‘+++ () ---‘). Each criterion is also
established whether it is in the form of cost (-) which means the higher the value score, the
lesser its contribution towards the route selection and vice versa (Figure 5). Grid analysis in
ARCGIS is used to determine each of the criteria score. Each value is inserted to a map prior
to the selection and evaluation analysis.
The final stage is to allocate weightage to the criteria and sub-criteria according to its strategic
importance as described earlier. The results shows that ‘branch’ layout are sensitive to social
objectives, while ‘radial’ are significantly sensitive to institutional objectives and
environment objectives. Overall, the ‘radial’ design provides the highest ranking (0.81)
compared to ‘branch’ (0.70) and ‘loop’ (0.70) (Figure 6). The analysis also shows that the
output are sensitive to change in the value of the weightage in the main criteria and
sub-criteria. Thus, the criteria are tested iteratively using the Sensitivity Analysis and
Uncertainties Analysis available in the software before the result is finalized.
3.0 CONCLUSION
The research demonstrates that multi-criteria analysis can be implemented in public
transportation planning to select the best railroad route plan for LRT. The research that has
been carried out also present the capability of ARCGIS to be integrated with other non-spatial
software applications. The databases can be extensively examined to generate alternative
solutions related to public transportation. This research however can be further improved
with the inclusion of more refined criteria in the analysis model. The selected criteria need to
Figure 5: Objectives, Criteria and Sub-Criteria Used in the Evaluation and Selection
of Rail Route
It is important to note that, this technique is also applicable to other development sectors such
as in the selection of suitable land use or development proposal (Ludin & Yaakup, 2006).
This technique also provides a platform where spatial and non-spatial data can be analyze
together and provide a desirable and significant result to the user that can be used by decision
makers to locate optimal development nodes and about the best use of land. In addition, there
should also be a continuous effort to search for innovative practices in the planning and
development aspects of the public transit schemes to ensure that it is in line with the ever
changing demand of the urban community.
REFERENCES
Bickel, R.G., ______, Key Issues Confronting Public Transportation Planning and Development, Delaware Valley Regional Planning Commission.
Brail, R.K. & Klosterman, R.E. (2001) Planning Support System: Integrating Geographical Information Systems, Models and Visualization Tools, ESRI Press, Redland.
Boerboom, L., M.A Sharifi, Kamalruddin Shamsuddin and Asanul Kabir (2004) Spatial Multi-Criteria Evaluation To Enhance Governance: change in Malaysian Planning, GISDECO 2004: Seventh International on GIS in Developing Countries. Universiti Teknologi Malaysia 10-12 Mei 2004.
ESRI (1996), Using the Arc View Network Analyst, Environmental System Research Institute,
United States.
ESRI (1995), Understanding GIS the Arc Info Method, Environmental System Research
Institute, United States.
Jenssen, R.Herwijnen, dan E.Beinet. (2001). DEFINITE: Case Study and User Manual.
Report No.R-01/01, Institute for Environment Studies. Vrije Universitiet Amsterdam, The Netherland.
Kamalruddin Shamsuddin. (2002). Spatial Multi-Criteria Decision Making: A Methodology for Generating and Evaluating Development Plans, World Town Planning Day Workshop, Kedah.
Ludin, A.N.M. & Yaakup, A. (2006) Scenario-based Spatial Modelling for Land Use Planning and Evaluation, Map Malaysia 2006: Geospatial Information & Knowledge Economy, Kuala Lumpur.
Projek Usahasama Transit Aliran Ringan Automatik (1994), Light Rail Transit System Two
Decision Support. International Institute for Geoinformation Science and Earth Observation (ITC), Enchede, The Netherlands.
Transportation Research Board (1989), Light Rail Transit : New System Successes at
Affordable Prices, National Conference on LRT, San Jose, California.
White.P.,(1995). Public Transport : Its Planning, management and operation, University of Westminster.England.
Wong, S.C. and Lam, W.H.K., 2006, Planning and Policy of Public Transportation Systems in Asia, Journal of Advanced Transportation, 33:111-113, Springer.