Scholarship@Western
Scholarship@Western
Electronic Thesis and Dissertation Repository
8-22-2013 12:00 AM
Cortical Representation Underlying the Semantic Processing of
Cortical Representation Underlying the Semantic Processing of
Numerical Symbols: Evidence from Adult and Developmental
Numerical Symbols: Evidence from Adult and Developmental
Studies
Studies
Stephan Erich Vogel
The University of Western Ontario
Supervisor Dr. Daniel Ansari
The University of Western Ontario
Graduate Program in Psychology
A thesis submitted in partial fulfillment of the requirements for the degree in Doctor of Philosophy
© Stephan Erich Vogel 2013
Follow this and additional works at: https://ir.lib.uwo.ca/etd
Part of the Developmental Psychology Commons
Recommended Citation Recommended Citation
Vogel, Stephan Erich, "Cortical Representation Underlying the Semantic Processing of Numerical Symbols: Evidence from Adult and Developmental Studies" (2013). Electronic Thesis and Dissertation Repository. 1500.
https://ir.lib.uwo.ca/etd/1500
CORTICAL REPRESENTATION UNDERLYING THE
SEMANTIC PROCESSING OF NUMERICAL SYMBOLS:
EVIDENCE FROM ADULT AND DEVELOPMENTAL
STUDIES
(Thesis format: Integrated-Article)
by
Stephan E. Vogel
Graduate Program in Psychology
A thesis submitted in partial fulfillment of the requirements fort the degree of
Doctor of Philosophy
The School of Graduate and Postdoctoral Studies The University of Western Ontario
London, Ontario, Canada
Abstract
Humans possess the remarkable ability to process numerical information using numerical symbols such as Arabic digits. A growing body of neuroimaging work has provided new insights into the neural correlates associated with symbolic numerical magnitude processing. However, little is known about the cortical specialization underlying the representation of symbolic numerical magnitude in adults and children. To constrain our current knowledge, I conducted a series of functional Magnetic Resonance Imaging (fMRI) studies that aimed to better understand the functional specialization of symbolic numerical magnitudes representation in the human brain.
Using a number line estimation task, the first study contrasted the brain activation associated with processing symbolic numerical magnitude against the brain activation associated with non-numerical magnitude (brightness) processing. Results demonstrated a right lateralized parietal network that was commonly engaged when magnitude dimensions were processed. However, the left intraparietal sulcus (IPS) was additionally activated when symbolic numerical magnitudes were estimated, suggesting that number is a special category amongst magnitude dimensions and that the left hemisphere plays a critical role in representing number.
replication of previous findings demonstrating that the brain response of the IPS is modulated by the semantic meaning of numbers in the absence of overt response selection.
The last study aimed to unravel developmental changes in the cortical representation of symbolic numerical magnitudes in children. Using the paradigm tested in chapter 2, results demonstrated an increase in the signal recovery with age in the left IPS as well as an age-independent signal recovery in the right IPS. This finding indicates that the left IPS becomes increasingly specialized for the representation of symbolic numerical magnitudes over developmental time, while the right IPS may play a different and earlier role in symbolic numerical magnitude representation.
Findings of these studies are discussed in relation to our current knowledge about symbolic numerical magnitude representation.
!
Statement of Co-Authorship
Dedication
!
Acknowledgement
It would not have been possible to write this doctoral thesis without the help and support of all the people around me. Thanks to all of you!!
Foremost, I would like to express my gratitude to my supervisor Prof. Dr. Daniel Ansari for his tremendous support, his patience, his motivation and his enthusiasm. His extraordinary guidance helped me in many aspects of my Ph.D. study. I could not have wished for a better advisor mentoring me.
I would like to give special thanks to the wonderful people working in the Numerical Cognition Laboratory: Christian Battista, Stephanie Bugden, Bea Goffin, Celia Goffin, Ian Holloway, Anna Matejko, Nadia Nosworthy, Gavin Price, and Ian Lyons. These empathetic and smart people played a major role in supporting me over the years.
Hereby I would like to thank the advisory and examination board, which consisted of Dr. Marc Joanisse, Dr. Jody Culham, Dr. Adam Cohen, Dr. Daniel Hyde and Dr. Chris Viger. Additionally I would like to thank the people working in the lab of the Georg-August University in Göttingen: Dr. Roland Grabner, Christian Hahn, Frieder Schillinger, Maria Schneider, Ina Schwarz and Jonas Pilgrim. Thank you for supporting me during the final months of manuscript completion.
Thanks to my friends in Europe, who supported my academic pursuit and spent many hours on Skype with me: Thanks!
I am most grateful to my parents and my grandparents who encouraged and supported me throughout my life. Thanks for supporting my determination to find my potential and to contribute to this world.
Herzlicher! Dank! gebührt! auch! Maria, für die alltägliche Unterstützung und Hilfe während der gesamten Studienzeit in Kanada. Danke, dass du mir den so wichtigen Rückhalt gegeben hast, und mit deiner Unterstützung wesentlich zum Gelingen dieser Arbeit beigetragen hast.
CHAPTER'5:'FINAL'DISCUSSION'...'156!
5.1.! INTEGRATION!OF!THE!FINDINGS!PRESENTED!IN!THIS!THESIS!...!156!
5.1.1.$The$neural$correlates$of$symbolic$numerical$and$nonQnumerical$magnitudes.$...$156!
5.1.2.$Probing$symbolic$numerical$magnitude$representation$in$adults$...$160!
5.1.3.$Developmental$changes$in$the$cortical$representation$of$number$...$163!
5.1.4.$Final$remarks$...$168!
5.2.! REFERENCES!...!170!
APPENDICES'...'174!
List of Tables
!
List of Figures
!
List of Appendices
Chapter 1: General Introduction
1.1. The importance of number
Since the dawn of civilization humans have been intrigued and fascinated by the concept of number. The idea to use arbitrary symbols (e.g., Hindu-Arabic numerals) to represent numerical magnitudes is doubtlessly one of the greatest cultural achievements in the history of mankind. Early philosophers such as Aristotle were occupied by the beauty of numbers and spent countless hours dwelling in the realm of mathematics. And even famous artists such as the German Renaissance painter and mathematician Albrecht Dürer expressed their fascination for numbers in their paintings (e.g., “The Magic Square” in Dürer’s famous work Melancholia I). However, beyond the mathematical aesthetic that numbers radiate, it is especially their practical use that has significantly transformed the existence of the human species on this planet.
Without them, citizens in the western world would not be living in comfortable and well-tempered apartments. Without them, we would not be able to use computers to write down our ideas. Even fundamental concepts such as time and space would be immeasurable. From these examples it is readily apparent that numbers have significantly contributed to the development of our modern societies.
simple tasks such as setting the time or calculating the tip in a restaurant become an enormous struggle (Landerl & Kaufmann, 2008; Vogel & Ansari, 2012).
From the examples above, the tremendous importance of numerical abilities is readily apparent and, therefore, semantic knowledge (i.e., the representation of numerical magnitude) that is conveyed by numerical symbols is crucial for every individual. Given the tremendous impact numerical knowledge exerts on our societies and individuals, there is an urgent need to better understand the cognitive and neurocognitive mechanisms that underlie the development of symbolic numerical understanding. Having discussed the impact and the importance of research, the following sections will introduce the reader to the field of numerical cognition. As such, the first part will provide a brief developmental history of the Hindu-Arabic numeral system, which is currently the most commonly used numerical notation system around the globe. After this historic overview, the next section will provide a review about our current understanding on how the human mind and brain process numerical magnitude.
1.2. History of Hindu-Arabic numerals
development of the Arabic numerals, focusing on its first appearance in India and its main transformations up to its present form.
!
Figure 1.1: The Brahmi numerals in the first century A.D. Reprinted from Brahmi numerlas, In Wikipedia,n.d., Retrieved August 26, 2013, from
http://en.wikipedia.org/wiki/Brahmi_numerals. Reprint with permission.
on a stick or scratches on stone were used to express and convey numerical meaning (Dehaene, 1992; Ifrah, 1985; Menninger, 1992). These ancient notation forms were commonly used to establish one-to-one correspondence with the number of items to be enumerated. For instance, in ancient times the quantity “four” would have been carved as IIII marks on a stone. However, the concrete system is a very tedious way to express numerical magnitudes, especially once the amount of items to be enumerated reaches a certain magnitude at which discrimination of consecutive items becomes difficult (e.g., IIIIII vs. IIIIIII). To overcome this problem some cultures invented new systems (e.g., grouping) in which the marks were organized in more recognizable patterns (e.g., 5 is represented with a space between the marks III II). Others, like the early Brahmi numeral system in India, introduced arbitrary shapes (see Figure 1.1) in order to represent numerical magnitudes more efficiently. However, this early Indian number system was not yet based on the modern place-value system and numerical expressions were instead additively composed. For instance, using the appropriate symbols the number 32 would have been written as “10 10 10 1 1”. In this additive form of numerical expression the power of ten served frequently as the numerical base, however, other cultures such as the Sumarians used different numbers as numerical base (e.g., 60).
positional coding of 2 3 2. However, the still unknown “0” left this notation system ambiguous. Take for instance the numbers 32 and 302. The number 302 would have been expressed as 3 2, and the number 32 would have been expressed as 3 2. As can be readily seen the ambiguity of this expression was not satisfying, which ultimately gave rise to the next transformational step, the introduction of the number “0”. The invention of “nothing”, as a placeholder, enabled the writer to express the multi-digit number 302 with the well-known place-value system as 302. The origin of this important advancement appears to be lost in history and only speculations remain how it occurred. However, one can assume that the Indian culture was simply ripe for this tremendous change and in the 9th century the success of this new writing system quickly spread to neighbouring countries such as Persia and Arabia.
The cultural development and transformation of the Arabic numeral system is remarkable. It is also notable that different numerical notation systems were introduced independently across different cultures on different continents. This independent appearance of different notation systems is frequently taken as evidence to suggest that the human species is endowed to perceive numerical magnitudes and that the invention of numerical notation systems was a natural step to occur (Butterworth, 1999). So, is there a foundational ability in humans to process numerical magnitudes? The next section will discuss accumulating research evidence that suggests that a variety of animal species as well as human infants are able to perceive and to discriminate between non-symbolic numerical magnitudes. Furthermore, I will discuss empirical evidence that indicates that the way non-symbolic numerical magnitudes are processed may be universal.
1.3. A sense for non-symbolic numerical magnitudes
The following section discusses empirical evidence that suggests that animals, non-human primates and non-human infants are able to perceive and to discriminate non-symbolic numerical magnitudes. In doing so, this section will provide arguments that humans might be endowed with an early ability to approximate non-symbolic numerical magnitude (e.g. dot arrays). In addition, this section will provide a general scaffold upon which to situate the main body of experimental work discussed in the present thesis.
magnitudes refer to a quality that defines the number of items in a set independently of their visual appearances or categorical classification. In other words, whether you have 2 apples and 3 peas in a basket or 4 cherries and 1 grape the overall number of items in the basket is 5. Therefore, non-symbolic numerical magnitudes describe an abstract quality that refers to the number of items displayed in a set. Non-symbolic numerical magnitudes can be either represented as exact or approximate magnitudes. Approximation refers to an imprecise estimation of the number of items in a set. In contrast, the exact assessment of numerical magnitudes refers to a precise representation of number (for example by counting the individual items in a set).
approximating and comparing the number of fruits on different branches of a tree might guide one’s behaviour to choose the branch that will provide more food. In an environment that is guided by natural selection the ability to perform numerical approximation and discrimination might be the difference between surviving or not (Butterworth, 1999; Dehaene, 1997).
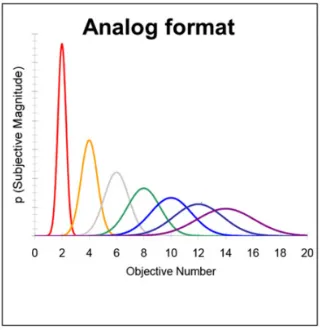
numerical magnitudes follows Weber’s law, which states that the threshold with which two magnitudes are compared increases linearly with the overall size of the magnitudes being discriminated. Therefore, the discrimination between 54 apples and 55 apples will be considerable more difficult than the discrimination of 4 apples and 5 apples. Although the numerical difference between the sets in both examples is exactly 1, however, the numerical ratio differs. Based on this evidence, the data suggests that the representation of non-symbolic numerical magnitudes might be based on an approximate system – the approximate number system (ANS) - in which numbers are internally represented as noisy quantities (see also Figure 1.2) that follow a Gaussian distribution (either on a logarithmic scale with a fixed variability of internal noise, or on a linear scale in which the internal noise increases linearly; Dehaene, 2003; Gallistel & Gelman, 2000).
The scientific evidence reviewed above suggests that the discrimination of non-symbolic numerical magnitudes is based on an approximate number system that does not rely on language capabilities. In addition to the evidence derived from animal studies, a growing number of studies have demonstrated that even preverbal human infants are able to discriminate non-symbolic numerical magnitudes (Libertus & Brannon, 2009; Xu & Spelke, 2000; Xu, Spelke, & Goddard, 2005). Results of several infant habituation (habituation is a decreased response to a stimuli after its repeated presentation) studies have demonstrated that infants ability to discriminate non-symbolic numerical magnitudes is subject to a similar numerical ratio effect as was observed in animals (Hyde, Boas, Blair, & Carey, 2010; Libertus & Brannon, 2009; Xu & Spelke, 2000; Xu et al., 2005). Thus, the current evidence from infant’s studies suggests that numerical abilities are present early in life and that the underlying mechanisms of non-symbolic numerical magnitude discrimination is similar across species. This similarity in discrimination performance across different species including humans has led authors to suggest that humans are equipped with an inborn preverbal ability to approximate numerical magnitudes, which has been called “Approximate Number System” or the “Sense for Numbers” (Dehaene, 1997).
1.4. Symbolic numerical magnitude processing
The central aim of the present dissertation is to discuss and to explore how the human mind and brain represents symbolic numerical magnitude. The following section will discuss two central behavioural effects that have provided important insights into the ways symbolic numerical magnitudes are processed and represented in humans. In addition, a prominent cognitive model of number processing will be described.
!
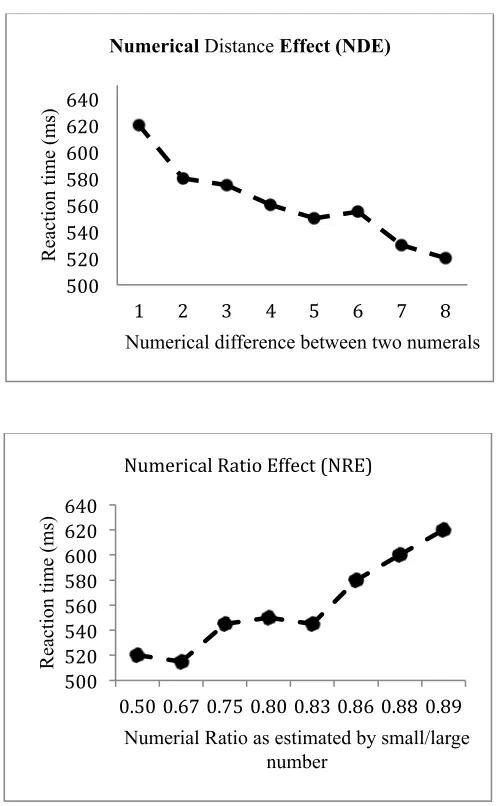
Figure 1.3: The figures illustrate typical reaction time data observed for the numerical distance effect (upper figure) and for the numerical ratio effect (lower figure; figures represent fictional data for the purpose of illustration).
Given the presence of the NDE and the NRE in symbolic numerical magnitude comparisons, it is not surprising that behavioural studies as well as neuroimaging studies, investigating the representation of symbolic numerical magnitudes, frequently use these effects as an index for semantic number processing (Bugden & Ansari, 2010; Holloway
500! 520! 540! 560! 580! 600! 620! 640!
1! 2! 3! 4! 5! 6! 7! 8!
Re ac ti on t im e (m s)
Numerical difference between two numerals Numerical Distance Effect (NDE)
500! 520! 540! 560! 580! 600! 620! 640! 0.50!0.67!0.75!0.80!0.83!0.86!0.88! 0.89! Re ac ti on t im e (m s)
Numerial Ratio as estimated by small/large number
2009; Moyer & Landauer, 1967; Sekuler & Mierkiewicz, 1977; Verguts & Van Opstal, 2005).
!
Figure 1.4: The figure displays the Triple Code Model (TCM) proposed by Dehaene (1992). The Arabic Number Form, the Auditory Verbal Word Frame and the Analoge (approximate) Magnitude Representation are the building blocks of the model.
Interconnections (shown in the letters A,B,C,C’ and D’) enable the transformation of information from one code to another code. Reprinted from “Varieties of numerical abilities,” by S. Dehaene, 1992, Cognition, 44, p. 31. Copyright Elsevier. Reprinted with permission.
one central abstract number representation through which every transformation has to pass through (i.e., a processing bottleneck).
Taken together, the evidence discussed in this section indicates that the discrimination of symbolic numerical magnitudes is subject to a numerical distance effect and a numerical ratio effect similar to the comparison of non-symbolic numerical magnitudes. Thus, it is assumed that numerical distance and numerical ratio are an index of numerical magnitude representation that is governed by Weber’s law. Furthermore, I reviewed evidence that the size of the numerical ratio effect in children may be a good indicator for the precision with which symbolic numerical magnitudes are represented in the human mind. Despite these advances in our understanding, still little is know about the ways the human brain represents symbolic numerical magnitude and how symbolic numerical representation develops over time. In the next section I will provide an introduction to the neuronal architecture related to the processing of symbolic numerical magnitudes in the human brain.
1.5. Neuronal architecture of symbolic number processing
and independent of domain general mechanisms. In line with other neuropsychological case (Dehaene & Cohen, 1997; Delazer & Butterworth, 1997) studies, the work by Cipolotti and colleagues (1991) was able to demonstrate the importance of the parietal lobe for the processing of symbolic numerical magnitude. Together, there is substantial evidence to suggest that the parietal lobe is involved in domain specific processing of numerical information.
While there is ample evidence from patients with parietal damage to suggest that that the intraparietal sulcus (IPS) is critically involved in the processing of numerical magnitude information, the exact anatomical architecture and the functional principles underlying the processing of numerical operations remained elusive. With the advent of functional neuroimaging technologies new evidence was generated to further constrain the neuronal architecture related to the processing of symbolic numerical magnitudes. Important information about the neuronal mechanisms underlying the representation of symbolic numerical magnitudes has been derived from symbolic numerical comparison studies. As discussed in the previous sections, the NDE has been related to the representation of symbolic and non-symbolic numerical magnitudes. As such it is not surprising that the majority of neuroimaging studies exploring the neural correlates of numerical magnitude processing used the number comparison task as a way to further investigate the neuronal architecture of symbolic numerical magnitude presentation in the human brain.
affected by numerical distance. In one of the earliest investigations, Grune, Mecklinger and Ullsperger (1993) asked participants to perform a number comparison task while ERPs were recorded from their scalp. The findings from this study demonstrated that numerical distance affects ERPs 300 milliseconds following the presentation of digits pairs. The positive going ERP (the P300) differed significantly between pairs of digits that were separated by a relatively small numerical distance compared to pairs that expressed a comparatively large numerical distance. Specifically, the amplitude of the P300 was thereby larger for number pairs that were separated by a large numerical distance compared to digit pairs that were small in numerical distances. This finding is important as it suggests that numerical distance influences brain activation before participants make an overt response and hence, seems to affect processes related to stimulus encoding and activation of representations that will allow for discrimination to occur.
parietal sites between 170-200 milliseconds following stimulus onset. The effect of numerical distance on this component was not found to differ between number words and digits. A later effect was also reported related to differences in the electrophysiology as a function of the response side for a given trial.
These ERP findings are interesting for a number of reasons. First of all, they reveal a temporal independence in the brain of semantic processing of numerical magnitude (as indexed by the NDE) from the visual identification of the numerical stimuli as well as the response execution. Second, these findings extend those by Grune and colleagues (1993), discussed above, by demonstrating that numerical distance affects brain activation at very early processing stages (within the first 200 milliseconds). Finally, the source localization data presented by Dehaene (1996) suggest that the areas of the parietal cortex may play a critical role in numerical magnitude processing.
This finding indicates that the IPS is a crucial structure in the processing of numerical magnitudes in a symbolic format and that the neural activity within this region is modulated by numerical distance, indicating that the neural representation of symbolic numerical magnitude may be governed by Weber’s law.
!
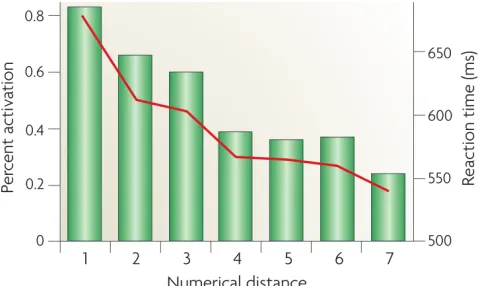
Figure 1.5: The figure illustrates the typical parametric modulation (i.e., the numerical distance effect) oft the IPS observed in number comparison tasks. Note that the brain activation decreases with an increase in numerical distance. This effect is argued to reflect a decrease in neural representational conflict (representational overlap of numbers) when numerals are compared that are farther away. Reprinted from “Effects of
development and enculturation on number representation in the brain,” by D. Ansari, 2008, Nature Reviews Neuroscience, 9, p. 280. Copyright Nature Publishing Group. Reprinted with permission.
distance effect do not merely reveal distance effects on activation of parietal regions. Many of the above-cited published studies reported distance effects across a distributed network of regions, including areas of the frontal cortex whose activity is also modulated by numerical distance. These findings, however, converge with findings from neuropsychological case studies to suggest that the parietal lobe and more specifically the IPS is critical for the processing of numerical magnitude information (for a review see Dehaene et al., 2003). Furthermore, the neuroimaging data suggest that numerical distance (numerical ratio) is a powerful predictor for brain activation that can be used to further constrain our understanding of how the human brain represents numerical magnitudes.
!
Figure 1.6: This view illustrates three parietal regions that are commonly activated in numerical tasks (Dehaene et al., 2003). In blue the bilateral posterior superior parietal lobe (PSPL), in green the left Angular gyrus and in red the bilateral horizontal segment of the intraparietal sulcus (IPS). The IPS is commonly engaged in processes that involve representations of numerical magnitude such as the comparison of two numerals. Reprinted from “Three Parietal Circuits for Number Processing,” by S. Dehaene, 2003, Cognitive Neuropsychology, 20(3), p. 494. Copyright Taylor & Francis. Reprinted with permission.
architecture of symbolic numerical magnitude representations. Converging evidence suggests that the processing of numerical magnitudes is domain-specific and relates to regions of the parietal lobe, in particular the IPS (see also Figure 1.6). The neural activity of the IPS has been demonstrated to be modulated by numerical distance (numerical ratio), suggesting that this region is involved in processing the semantics of numerical magnitudes. Furthermore, the numerical ratio dependency of brain activation suggests that the IPS represents numerical magnitudes as approximate magnitudes in which close numerical distances elicit a larger representational overlap compared to numerical distances that are farther apart. While these studies have unravelled the principles of numerical magnitude representations in the human brain many important questions remain to be answered. Some of them are addressed in the present thesis. The next sections will provide a compact literature overview of current issues that motivated the questions addressed in the present work.
1.6. Neural correlates of numerical and non-numerical
magnitude processing
common as well as distinct neural representations underlying the processing of numerical and non-numerical magnitudes (Cappelletti, Freeman, & Cipolotti, 2009, 2011; Cohen Kadosh et al., 2005; Dormal, Andres, & Pesenti, 2008; Dormal, Dormal, Joassin, & Pesenti, 2012; Dormal & Pesenti, 2009; Pinel, Piazza, Le Bihan, & Dehaene, 2004). Some of the evidence points towards hemispheric differences. Especially the involvement of the left IPS is commonly demonstrated for symbolic numerical magnitudes in contrast to non-numerical magnitudes, which are more strongly associated with activation of the right parietal cortex.
addition, significant brain activity was found in regions of posterior parietal cortex in response to brightness and size comparisons. Together, this evidence demonstrates the parietal cortex is involved in the processing of numerical and non-numerical magnitudes. Moreover, the data of this study suggest that the processing of numerical and non-numerical magnitudes draws upon common as well as distinct regions of the parietal cortex.
The evidence reviewed above provides converging evidence to suggest that symbolic numerical magnitudes and non-numerical magnitudes rely neither on a fully independent magnitude system, nor on a single common magnitude representation (Cohen Kadosh et al., 2005; Dormal, Andres, & Pesenti, 2008; Dormal, Dormal, Joassin, & Pesenti, 2012; Dormal & Pesenti, 2009; Pinel et al., 2004). Moreover, there is growing evidence that points towards number as a special case amongst different magnitude dimensions and that left IPS may play a special role in the representation of symbolic numerical magnitudes. The question of laterality, however, remains elusive and more research is needed in order to better understand the contribution of different brain regions to the processing of symbolic numerical and non-numerical magnitudes
1.7. Developmental changes in the cortical representation of
symbolic numerical magnitudes
One of the first studies to investigate the neural basis of the symbolic numerical distance effect in children and adults, Ansari et al. (2005) found differences in the brain regions modulated by numerical distance between a group of 9-12 year old children and a group of adults. Specifically, children were found to exhibit a symbolic numerical distance effect on right frontal brain regions (right inferior and middle frontal gyri), while adults exhibited a symbolic numerical distance effect on parietal brain regions such as the right IPS and bilateral regions of the precuneus. This finding suggested a shift from the initial reliance on frontal brain regions to an increasing age-related specialization of the parietal cortex for the processing of symbolic numerical magnitude. These findings were supported by a similar observation by Kaufmann et al. (2006) using a number stroop paradigm, in which an age-related fronto-parietal shift in brain activation was observed between children and adults. The engagement of frontal brain regions in children (distance related modulations of frontal brain areas) has been posited to reflect the engagement of frontal brain resources such as cognitive control and conflict resolution. More specifically, it has been argued that the parietal brain representations of symbolic numerical magnitude in children may be more overlapping and hence, less precise compared to the representation of adults. Consistent with behavioural evidence (Holloway & Ansari, 2008; Sekuler & Mierkiewicz, 1977) this indicates that children engage more cognitive resources of the frontal lobe (i.e., executive functions) in order to resolve the representational overlap of numerical magnitudes in the context of number comparison.
specialization of the parietal cortex for the processing of symbolic numerical magnitude. However, functional neuroimaging studies with children are inherently noisy and heavily confounded by performance differences across different ages. In addition, non-numerical processes such as response selection are well known to activate regions of the IPS. Hence, it is currently unclear whether developmental changes observed in parietal areas are directly related to changes in the underlying representation of symbolic numerical magnitude or to changes in non-numerical processing such as response selection. Moreover, there is a great need for studies that move beyond the relatively coarse comparison of children and adults towards a characterization of the full developmental trajectory underlying the neural correlates of symbolic numerical magnitude processing. Clearly, more evidence is needed in this area in order to further constrain our knowledge about the development of symbolic numerical magnitude representation.
1.8. Overview of the thesis
has indicated that the parietal lobe is involved in the processing of symbolic numerical magnitudes and the brain activation of the IPS is modulated by numerical distance (numerical ratio) when numbers are being compared.
As already discussed, there is a growing body of evidence that indicates that the left IPS is particularly important for the processing of symbolic numerical magnitudes compared to the processing of non-numerical magnitudes. The first fMRI study with adults in chapter 2 further explored this question and contrasted the neural correlates associated with the processing of symbolic numerical to the brain activation associated with non-numerical magnitudes (i.e., brightness). A task that has been used to investigate the spatial properties (the mapping of numerical symbols onto an internal mental number line) of symbolic numerical magnitude representations is the number line estimation task. In this task participants are asked to place a numerical probe onto the correct position along a spatially extended number line (e.g., place the number 35 on the correct position of a number line that ranges from 0 – 100). By contrasting the brain activation associated with the mapping of numerical symbols into space (i.e., the placing of the probe on a spatially extended number line) with the brain activation associated with mapping non-numerical magnitudes (i.e., brightness) into space, the first study was able to investigate commonalities and differences in cortical specialization for the processing of symbolic numerical magnitudes in contrast to the processing of non-numerical magnitudes.
heavily confounded by non-numerical cognitive mechanisms such as response selection and performance differences. As such it is unresolved whether activation differences found in the IPS are directly related to the processing of symbolic numerical magnitudes per se, or, whether brain activations are related to non-numerical operations such as response selection. Since the ultimate goal of the present work was to investigate developmental changes in cortical specialization of symbolic numerical magnitude representation, we piloted an adjusted child friendly fMRI adaptation paradigm in adults. This design minimizes confounding variables such as performance differences and response selection. Hence, this paradigm allows for a stringent investigation into the developmental changes in the cortical representation of symbolic numerical magnitudes. As such the second study aimed to replicate findings of numerical ratio dependent signal recovery effects observed in the brain of human adults.
As already pointed out in the paragraph above, the last study of the thesis, discussed in chapter 5, investigates developmental changes in the cortical representation of symbolic numerical magnitudes in a group of children ranging from 6 to 14 years of age. Using the paradigm tested in study 2 of the present thesis, this study minimized the impact of confounding variables and, hence, aimed to further constrain our current knowledge about how the human brain represents symbolic numerical magnitudes over developmental time.
1.9. References
Agrillo, C., Dadda, M., Serena, G., & Bisazza, A. (2009). Use of number by fish. PloS one, 4(3), e4786.
Ansari, D. (2008). Effects of development and enculturation on number representation in the brain. Nature Reviews Neuroscience, 9(4), 278–91.
Ansari, D., Garcia, N., Lucas, E., Hamon, K., & Dhital, B. (2005). Neural correlates of symbolic number processing in children and adults. Neuroreport, 16(16), 1769–73.
Boysen, S. T., Bernston, G. G., Hannan, M. B., & Cacioppo, J. T. (1996). Quantity-based interference and symbolic representations in chimpanzees (Pan troglodytes). Journal of Experimental Psychology: Animal Behavior Processes, 22(1), 76–86.
Brannon, E. M., & Terrace, H. S. (1998). Ordering of the Numerosities 1 to 9 by Monkeys. Science, 282(5389), 746–749.
Brannon, E. M. (2006). The representation of numerical magnitude. Current Opinion in Neurobiology, 16(2), 222–9.
Bugden, S., & Ansari, D. (2010). Individual differences in children’s mathematical competence are related to the intentional but not automatic processing of Arabic numerals. Cognition, 118(1), 32–44.
Butterworth, B. (1999). The mathematical brain. London: Macmillan.
Butterworth, B., Varma, S., & Laurillard, D. (2011). Dyscalculia: From brain to education. Science, 332(6033), 1049–1053.
Cantlon, J. F. (2012). Math, monkeys, and the developing brain. Proceedings of the National Academy of Sciences of the United States of America, 109 Suppl , 10725– 10732.
Cantlon, J. F., & Brannon, E. M. (2006). Shared system for ordering small and large numbers in monkeys and humans. Psychological Science, 17(5), 401–406. Cappelletti, M., Freeman, E. D., & Cipolotti, L. (2009). Dissociations and interactions
between time, numerosity and space processing. Neuropsychologia, 47(13), 2732– 2748.
Cipolotti, L., Butterworth, B., & Denes, G. (1991). A specific deficit for numbers in a case of dense acalculia. Brain!: A Journal of Neurology, 114, 2619–2637.
Cohen Kadosh, R., Henik, A., Rubinsten, O., Mohr, H., Dori, H., Van de Ven, V., Zorzi, M., et al. (2005). Are numbers special? The comparison systems of the human brain investigated by fMRI. Neuropsychologia, 43(9), 1238–1248.
Dehaene, S. (1992). Varieties of numerical abilities. Cognition, 44, 1–42.
Dehaene, S. (1996). The organization of brain activations in number comparison: Event-related potentials and the additive-factors method. Journal of Cognitive
Neuroscience, 8(1), 47–68.
Dehaene, S. (1997). The number sense: How the mind creates mathematics. New York, NY: Oxford University Press.
Dehaene, S. (2003). The neural basis of the Weber-Fechner law: a logarithmic mental number line. Trends in cognitive sciences, 7(4), 145–147.
Dehaene, S., & Cohen, L. (1997). Cerebral pathways for calculation: Double dissociation between rote verbal and quantitative knowledge of arithmetic. Cortex, 33, 219–250. Dehaene, S., Piazza, M., Pinel, P., & Cohen, L. (2003). Three parietal circuits for number
processing. Cognitive neuropsychology, 20(3), 487–506.
Delazer, M., & Butterworth, B. (1997). A dissociation of number meanings. Cognitive Neuropsychology, 14(4), 613–636.
Dormal, V., Andres, M., & Pesenti, M. (2008). Dissociation of numerosity and duration processing in the left intraparietal sulcus: A transcranial magnetic stimulation study. Cortex, 44(4), 462–969.
Dormal, V., Dormal, G., Joassin, F., & Pesenti, M. (2012). A common right fronto-parietal network for numerosity and duration processing: An fMRI study. Human Brain Mapping, 33(6), 1490–1501.
Dormal, V., & Pesenti, M. (2009). Common and specific contributions of the intraparietal sulci to numerosity and length processing. Human brain mapping, 30(8), 2466– 2476.
Gabay, S., Leibovich, T., Ben-Simon, A., Henik, A., & Segev, R. (2013). Inhibition of return in the archer fish. Nature Communications, 4(1675). 1–5.
Gallistel, C., & Gelman, I. (2000). Non-verbal numerical cognition: from reals to integers. Trends in Cognitive Sciences, 4(2), 59–65.
Gross, J., Hudson, C., & Price, D. (2009). The longterm costs of numeracy difficulties. Every Child a Chance Trust and KPMG, London.
Grune, K., Mecklinger, A., & Ullsperger, P. (1993). Mental comparison: P300 component of the ERP reflects the symbolic distance effect. Neuroreport, 4(11), 1272–1274.
Holloway, I. D., & Ansari, D. (2008). Domain-specific and domain-general changes in children’s development of number comparison. Developmental Science, 11(5), 644– 649.
Holloway, I. D., & Ansari, D. (2009). Mapping numerical magnitudes onto symbols: the numerical distance effect and individual differences in children’s mathematics achievement. Journal of Experimental Child Psychology, 103(1), 17–29. Holloway, I. D., & Ansari, D. (2010). Developmental specialization in the right
intraparietal sulcus for the abstract representation of numerical magnitude. Journal of Cognitive Neuroscience, 22(11), 2627–2637.
Honig, W. K., & Stewart, K. E. (1989). Discrimination of relative numerosity by pigeons. Animal Learning & Behavior, 17(2), 134–146.
Hyde, D. C., Boas, D. a, Blair, C., & Carey, S. (2010). Near-infrared spectroscopy shows right parietal specialization for number in pre-verbal infants. NeuroImage, 53(2), 647–652.
Ifrah, G. (1985). From One to Zero: A universal history of numbers. New York, NY: Viking Penguin, Inc.
Kaufmann, L., Koppelstaetter, F., Siedentopf, C., Haala, I., Haberlandt, E., Zimmerhackl, L.-B., Felber, S., et al. (2006). Neural correlates of the number-size interference task in children. Neuroreport, 17(6), 587–591.
Krusche, P., Uller, C., & Dicke, U. (2010). Quantity discrimination in salamanders. The Journal of Experimental Biology, 213(11), 1822–1828.
Lebrun, Y. (2005). Gerstmann’s syndrome. Journal of Neurolinguistics, 18(4), 317– 326.
Libertus, M. E., & Brannon, E. M. (2009). Behavioral and neural basis of number sense in infancy. Current Directions in Psychological Science, 18(6), 346–351.
McCloskey, M. (1992). Cognitive mechanisms in numerical processing: Evidence from acquired dyscalculia. Cognition, 44(1-2), 107–157.
Meck, W. H., & Church, R. M. (1983). A mode control model of counting and timing processes. Journal of Experimental Psychology. Animal behavior processes, 9(3), 320–334.
Menninger, K. (1992). Number Words and Number Symbols: A Cultural History of Numbers. Mineola, NY: Dover Publications.
Moyer, R. S., & Landauer, T. K. (1967). Time required for judgements of numerical inequality. Nature, 215(2), 1519–1520.
Parsons, S., & Bynner, J. (2005). Does numeracy matter more. NRDC (National Research and Development Centre for Adult Literacy and Numeracy). London. Pepperberg, I. M. (2006). Ordinality and Inferential Abilities of a Grey Parrot (Psittacus
erithacus). Journal of Comparatively Psychology, 120(3), 205–216.
Pepperberg, I. M. (2012). Abstract concepts: Data from a Gray parrot. Behavioural Processes, 93, 82–90.
Pepperberg, I. M., & Carey, S. (2012). Grey parrot number acquisition!: The inference of cardinal value from ordinal position on the numeral list. Cognition, 125(2), 219– 232.
Pinel, P, Dehaene, S., Rivière, D., & LeBihan, D. (2001). Modulation of parietal activation by semantic distance in a number comparison task. NeuroImage, 14(5), 1013–1026.
Pinel, P, Le Clec’H, G., Van de Moortele, P. F., Naccache, L., Le Bihan, D., & Dehaene, S. (1999). Event-related fMRI analysis of the cerebral circuit for number
comparison. Neuroreport, 10(7), 1473–1479.
Platt, J. K., & Johnson, M. (1971). Localization of position within a homogeneous behavior chain: Effects error contingencies. Learning and Motivation, 2, 386–414. Ritchie, S. J., & Bates, T. C. (2013). Enduring links from childhood mathematics and
reading achievement to adult Socioeconomic Status. Psychological science, XX(X). 1–8.
Roberts, W. a., & Mitchell, S. (1994). Can a pigeon simultaneously process temporal and numerical information? Journal of Experimental Psychology: Animal Behavior Processes, 20(1), 66–78.
Roitman, J. D., Brannon, E. M., & Platt, M. L. (2007). Monotonic coding of numerosity in macaque lateral intraparietal area. PLoS biology, 5(8), e208.
Romano, E., Babchishin, L., Pagani, L. S., & Kohen, D. (2010). School readiness and later achievement: Replication and extension using a nationwide Canadian survey. Developmental Psychology, 46(5), 995–1007.
Sekuler, R., & Mierkiewicz, D. (1977). Children’s judgments of numerical inequality. Child Development, 48(2), 630–633.
Van Opstal, F., Gevers, W., De Moor, W., & Verguts, T. (2008). Dissecting the symbolic distance effect: Comparison and priming effects in numerical and nonnumerical orders. Psychonomic Bulletin & Review, 15(2), 419–425.
Verguts, T., & Van Opstal, F. (2005). Dissociation of the distance effect and size effect in one-digit numbers. Psychonomic Bulletin & Review, 12(5), 925–30.
Vogel, S. E., & Ansari D. (2012). Neurokognitive Grundlagen der typischen und atypischen Zahlenverarbeitung. Lernen und Lernstoerungen, 1(2), 135–149. Xu, F., & Spelke, E. S. (2000). Large number discrimination in 6-month-old infants.
Cognition, 74(1), B1–B11.
Chapter 2: Neural correlates underlying the processing of
numerical and non-numerical magnitude
2.1. Introduction
Research into the neural correlates of numerical cognition has implicated the parietal lobe, and more specifically the intraparietal sulcus (IPS), as a critical brain region for processing the abstract meaning of numerical magnitude (the total number of items in a set). Brain activity in this region is consistently activated whenever participants are presented with symbolic (e.g., Arabic digit) or non-symbolic (e.g., dot arrays) numerical magnitudes (for a review see Nieder & Dehaene, 2009).
Most tasks that have investigated the neural correlates of symbolic numerical magnitude processing have focused on the comparison of symbolic numerical magnitudes. In such comparison tasks, numerical symbols are presented on a screen and participants are either asked to decide which of two simultaneously presented digits is numerically larger/smaller, or whether a presented numeral is numerically larger/smaller than a non-presented reference number (e.g., 5).
reflect an approximate representation of symbolic numerical magnitudes. Specifically, numerical magnitudes that are close in distance (e.g., 4 and 5) exhibit a greater representational overlap than do numerical magnitudes that are further apart (e.g., 4 and 9). Consistent with this idea, the comparison of pairs of numbers that are separated by relatively numerically smaller distances is associated with greater brain activation in the IPS than is the case for pairs separated by comparatively larger distances (Ansari, Dhital, & Siong, 2006; Ansari et al., 2005; Kaufmann et al., 2005; Pinel et al., 2001). This effect has been interpreted as a signature of symbolic numerical magnitude processing in the brain.
Nelis, & Reynvoet, 2011; Piazza, Izard, Pinel, Le Bihan, & Dehaene, 2004; Piazza, Pinel, Le Bihan, & Dehaene, 2007).
Another task that has proved useful for generating behavioral evidence regarding the relation between number and space is the number line estimation paradigm (Siegler & Opfer, 2003). In this paradigm, participants are asked to estimate the spatial position of a number on a physical number line. This task is thought to directly tap into the mechanisms associated with subserving the mapping of symbolic numerical magnitude into space because it involves the mental activity of taking an internal representation of numerical magnitude and mapping it onto a spatial reference frame (i.e., the number line). Recent behavioral studies have shown that children’s performance on the number line estimation task correlates with their proficiency in arithmetic and other estimation tasks, memory for numbers, standardized mathematical achievement test scores, and mathematical school grades (Booth & Siegler, 2006; Schneider et al., 2008; Schneider, Grabner, & Paetsch, 2009; Siegler & Booth, 2004; Thompson & Siegler, 2010). Furthermore, interventions that increase the accuracy of children’s estimates on the number line cause increases in the children’s arithmetic competence (Booth & Siegler, 2008; Siegler & Ramani, 2009). Therefore, it is important to address the question of which regions of the human brain are involved in the mapping process on this task.
symbolic numbers on a number line to those involved in estimating levels of luminance on a spectrum from bright white to dark black. Functional neuroimaging studies using symbolic numerical and non-numerical comparison paradigms have indicated that both similar and dissociated regions in the parietal lobe are activated when magnitudes of different kinds are compared. For example, Pinel and colleagues (2004) investigated brain activity while participants decided which of two simultaneously presented numerals was brighter, physically larger, or numerically larger. Judgments of number and area were associated with overlapping responses in the IPS, while comparisons of luminance and size were found to share activation in regions of the occipito-temporal cortex.
This evidence suggests that at least some regions of the parietal cortex are involved in the processing of both symbolic numerical and non-numerical magnitudes. Another fMRI study by Cohen Kadosh and colleagues (2005) used similar comparisons tasks as those that were used in Pinel et al. (2004) and showed overlapping brain representations for size, luminance, and symbolic numerical magnitude in bilateral regions of the parietal cortex. However, in addition to these common effects across different magnitude comparison tasks, the authors found that the left IPS was uniquely engaged in the numerical comparison task: it was the only region that showed a significant neural distance effect for number.
found in regions along the right IPS, while the processing of symbolic numerical magnitudes also involves regions of the left anterior IPS. The use of both a symbolic numerical and a non-numerical line estimation tasks allowed for an examination of whether these effects were unique to the numerical comparison tasks or whether these effects can be generalized to other symbolic numerical tasks.
For these reasons, a number line estimation task with numbers from 0-100 was administered to investigate which brain regions are involved in mapping symbolic numerical magnitudes onto space. The comparison task involved estimation of the luminance of gray swatches on a number line ranging from white to black.
2.2. Materials and Methods
2.2.1.Participants
Participants were 14 healthy, right-handed adult participants: 7 female (mean age = 24.86 years; SD = 5.40; range = 18 – 33) and 7 male (mean age = 24.29 years; SD = 2.87; range = 19 – 28).
2.2.2.Task Design and Stimuli
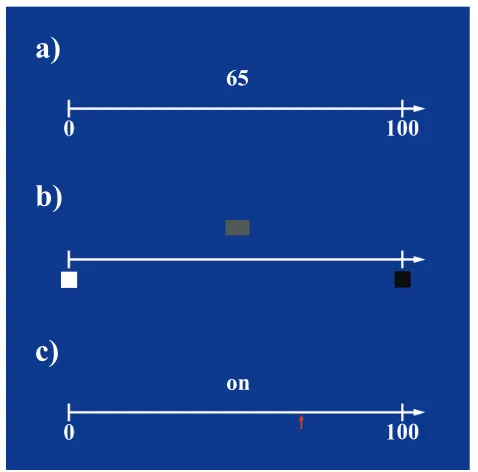
Two experimental conditions – number line estimation (NLE) and brightness estimation (BE) - and one control condition were used in this experiment (see Figure 2.1 for example of stimuli).
!
Figure 2.1: Example stimuli used in the three different experimental conditions. A) Number line estimation, b) Brightness estimation and c) word control task. Reprinted
a)
on
b)
c)
from “Overlapping and distinct brain regions involved in estimating the spatial position of numerical and non-numerical magnitudes: An fMRI study,” by S. Vogel, 2013, Neuropsychologia, 51(5), p. 981. Copyright Elsevier. Reprinted with permission.
2.2.2.1.Number Line Estimation (NLE)
A white vertical line was presented on a blue screen to visually map out a spatial reference frame from left to right. At the right end of the line, an arrow was pointing towards infinity indicating that the reference space-line extends further to the right. In addition, at the left end, a small horizontal line marked the beginning of the line. Furthermore, the spatial reference line was supplemented in such a way that two Arabic numerals – 0 at the left-end and 100 on the right-end - were presented as flankers below the vertical line. The purpose of the two numerals was to indicate the spatial-numerical extent of the reference line ranging from 0 on the left to 100 on the right.
Numbers in the NLE Brightness in the BE Words in the control
3 !! ! on
7 !! ! in
11 !! ! to
13 !! ! at
21 !! ! me
28 !! ! we
33 !! ! he
36 !! ! it
42 !! ! no
45 !! ! so
56 !! ! by
57 !! ! go
60 !! ! do
65 !! ! am
74 !! ! as
77 !! ! my
83 !! ! or
85 !! ! ox
90 !! ! if
98 !! ! be
Table 2.1: List of stimuli used in the experimental and in the control condition. Note that the brightness values in the BE task correspond to the numerical values used in the NLE task in such a way that the steps between brightness and numerical levels are equivalent. For example, the magnitude difference between the 1st number (i.e., 3) and the 2nd
2.2.2.2.Brightness Estimation (BE)
The same visual reference line as in the NLE condition was used for the BE condition. However, instead of 0 and 100 anchoring the line, two square boxes, one filled with the brightness level of white and the other filled with the brightness level of black1 were presented below the vertical line and were used to indicate the brightness range of the reference line, from white on the left to black on the right. The same procedure as in the NLE condition was used for the BE task. However, instead of Arabic digits, brightness levels (Table 2.1) were presented randomly on the screen at the same location as the numeric probe in the NLE task. Participants needed to indicate with the trackball the spatial position on the reference line at which they would place the presented brightness.
2.2.2.3.Control Condition
The same reference line as in the NLE condition was used in the control condition. In contrast to the two experimental conditions, two-letter words (Table 2.1) were used as probes. The rationale for using two-letter words in the control condition was to equate visual complexity across the word and number conditions. The task was to move the trackball to the location on the line indicated by an arrow, and to click on it. The arrows indicated the locations of correct estimates in the other two conditions, thus requiring the same hand movements in all three conditions. However, in the control condition the
!!!!!!!!!!!!!!!!!!!!!!!!!!!!!!!!!!!!!!!!!!!!!!!!!!!!!!!!
stimuli were irrelevant to task performance and were only used to equate complexity of visual input.
Please note that the visual indicator of the trackball was reset to the center of the screen (i.e., same location as the presented probe) after each trial. In addition, the spatial locations of the correct answers on the reference line were matched across identical trials between conditions. For example, the correct position on the reference line for the numerical probe 36 was identical to the correct position of the corresponding gray shade (see Figure 2.1 for the correspondence between numerical and brightness values) and the arrow in the word control condition. This standardized procedure ensured that hand movements were matched as much as possible across the three experimental conditions.
Since the word control task did not involve explicit processing of the two-letter words presented in the middle of the screen, additional dummy trials were included in all conditions. On these trials, numbers, brightness stimuli, and dummy words were crossed out with two red lines. Whenever dummy trials appeared on the screen, participants were asked to indicate the presence of such a trial with a button press. The inclusion of these additional trials ensured that participants paid attention to the dummy words in the word control condition and that perceptual processing mechanisms across all tasks were at least roughly comparable.
2.2.3.Procedure
blocks – 4 for NLE, 4 for BE, and 4 for the word controls - divided into four functional runs (3 blocks per run). The order of the 12 blocks was counterbalanced across the four runs; thus, the block presentation order from one run to the next was not predictable for participants. Within each block, 15 stimuli for the same task were presented, resulting in a total of 45 trials per run (see also Table 2.1) and 180 trials for the four runs. Stimuli were presented in a pseudo-random order, with the rule that the same stimulus must not be presented on consecutive trials. Between stimuli, a jitter interval of 5,000 ms, 7,500 ms and 10,000 ms was used to optimize the hemodynamic response function (HRF). Jitter time was balanced in such a way that the same jitter-time was never presented on consecutive trials. As a result, the stimuli were presented in an event-related design.
2.2.4.Data Acquisition
2.3. Data Analysis
All functional and structural imaging data were pre-processed and analyzed with the software package Brain Voyager QX 2.3 (Brain Innovation, Maastricht, The Netherlands). Participants’ functional runs were first corrected for slice time acquisition (cubic spline, images were acquired in an ascending-interleaved order) and head motion (trilinear/sinc interpolation). Furthermore, a High-Pass filter (GLM-Fourier, 2 sine/cosine cycles) was applied to remove frequencies related to physiological noise, such as breathing and the heart beat. Finally, all functional runs were spatially smoothed using a kernel of 6 mm full width at half maximum (FWHM). Individual’s structural 3D images and individual functional runs were co-registered. This was attained by mapping the individual functional runs onto the anatomical 3D image until a maximum of spatial overlap of anatomical landmarks was achieved. To maximize the accuracy of the functional-to-structural alignment, all anatomical images were stripped from the skull and only the remaining brain tissue was used for the co-registration process. After all the functional images were aligned to their corresponding anatomical image, the data were transformed into Talairach space (Talairach & Tournoux, 1988) for group statistical analysis.
convolved with a two-gamma hemodynamic response gamma function (HRF) to model the expected (BOLD) function (Friston et al., 1998).
2.3.1.Tasks > control condition
The initial analysis aimed to investigate brain areas that were significantly modulated by the experimental conditions compared to the word control condition. Contrasts of “[NLE > control]” and “[BE > control]” were calculated separately.
2.3.2.Areas involved in both number line and brightness estimation
To examine regions that showed a significant common neural response to number and brightness estimation, a RFX conjunction analysis was calculated over the contrasts
“[NLE > control] ∩ [BE > control]”.
2.3.3.Analyses used to investigate distinct activation for number and brightness
To evaluate numerical and non-numerical task specific brain activation patterns, two conjunction analyses were calculated. To investigate number specific activation, the
conjunction of “[NLE > BE] ∩ [NLE > control]” was calculated. To calculate brightness
specific activation, the conjunction of “[BE > NLE] ∩ [BE > control]” was calculated.
These analyses ensured that activation differences between the two experimental estimation conditions (i.e., NLE and BE) were over and above activation of the word control task.
corrected for multiple comparisons using cluster size thresholding (Forman et al., 1995; Goebel, Esposito, & Formisano, 2006). In this method, an initial voxel-level (uncorrected) threshold is set. Then, threshold maps are submitted to different correction criteria, based on the estimates of the map’s spatial smoothness and on an iterative procedure (Monte Carlo simulation) for estimating cluster-level false-positives rates. After 1000 iterations, the minimum cluster-size that yielded a cluster-level false –positive rate (α) of 0.05 was used to threshold the statistical maps. Only activations whose size
met or exceeded the cluster threshold were allowed to remain on the statistical maps.
2.4. Results
2.4.1.Behavioural Results
We also compared the mean PAEs (percent absolute errors) for the three conditions. The PAEs were 2.43 (SD = 0.71) for the NLE condition, 17.32 (SD = 7.00) for the BE condition, and 0.41 (SD = 0.17) for the word condition, where participants only needed to duplicate the position of the arrow on the number line. An ANOVA with repeated measurements showed a significant difference across the three conditions (F(2,13) = 70.803, p < 0.001). Post-hoc t-tests for paired samples revealed significant differences for all possible combinations: NLE versus BE t(13) = -7.735, p < 0.001; NLE versus Control t(13) = 10.896, p < 0.001; BE versus Control t(13) = 9.056, p < 0.001).
2.4.2.fMRI Results
2.4.2.1.Number and brightness versus control
!
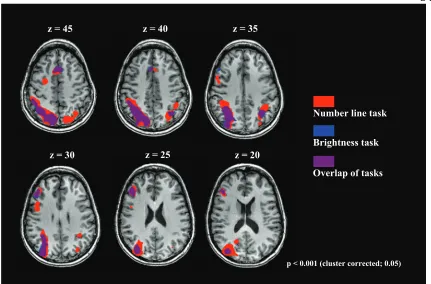
Figure 2.2: Activations of the “Number line task > word control” and the “Brightness task > word control” are displayed in six transversal sections of the brain. Number related activations are shown in red while Brightness related activations are shown in blue. Overlapping regions are shown in puple. Reprinted from “Overlapping and distinct brain regions involved in estimating the spatial position of numerical and non-numerical magnitudes: An fMRI study,” by S. Vogel, 2013, Neuropsychologia, 51(5), p. 984. Copyright Elsevier. Reprinted with permission.
! ! ! ! ! ! ! ! ! ! ! !
z = 30 z = 20
p < 0.001 (cluster corrected;; 0.05)
z = 45 z = 40 z = 35
Overlap of tasks Brightness task Number line task
!
Hemisphere Stereotaxic coordinates
X Y Z
Precuneus R 8 -77 48
Intraparietal Sulcus R 29 -62 36
Middle Occipital Gyrus R 35 -77 21
Middle Frontal Gyrus R 32 1 51
Superior Frontal Gyrus R 8 10 48
Superior Frontal Gyrus R 41 37 27
Cuneus L -16 -95 9
Precuneus L -13 -80 48
Intraparietal Sulcus L -31 -68 42
Middle Frontal Gyrus R 47 13 33
Table 2.2: List of those areas that showed a significant difference between the number line estimation task and word control task (i.e., NLE > control). Coordinates are given in Talairach space (Talairach & Tournoux, 1988). Activations are reported at a threshold level of p > 0.001 (0.05 corrected on cluster level). Reprinted from “Overlapping and distinct brain regions involved in estimating the spatial position of numerical and non-numerical magnitudes: An fMRI study,” by S. Vogel, 2013, Neuropsychologia, 51(5), p. 984. Copyright Elsevier. Reprinted with permission.
! Hemisphere Stereotaxic coordinates
! X Y Z
Intraparietal Sulcus R 32 -56 39
Sub-Gyral R 29 1 54
Precuneus R 8 -80 48
Intraparietal Sulcus L -34 -59 36
Medial Frontal Gyrus L -4 19 45
Lingual Gyrus R 14 -89 0
Middle Frontal Gyrus R 48 31 30
Table 2.3: List of those areas that demonstrated a significant difference between the brightness estimation task and the word control task (i.e., BE > control). Coordinates are given in Talairach space (Talairach & Tournoux, 1988). Activations are reported at a threshold level of p < 0.001 (0.05 corrected on cluster level). Reprinted from
2.4.2.2.Common activations for number and brightness
To analyze the extent to which the neural correlates of the experimental tasks
overlapped, a whole-brain conjunction analysis between “[NLE > control] ∩ [BE >
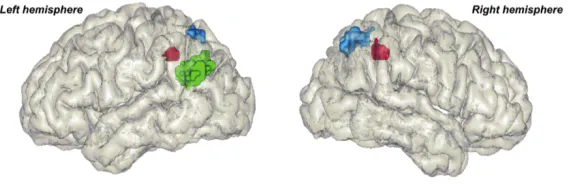
control]” was performed. Results of this contrast showed a significant overlap in the right hemisphere of the parietal cortex and the frontal lobe (see Figure 2.3, activation displayed in blue; for Talairach coordinates see Table 2.4). Activation overlap between NLE and BE tasks in the parietal lobe spanned the right IPS extending to the PSPL, while activation in the frontal lobe was found in the dorsolateral prefrontal cortex (DLPFC) and the right middle frontal gyrus.
2.4.2.3.Number specific activations
The last analysis was designed to reveal brain regions that showed activation specifically modulated to the number line estimation task. For the contrast “[NLE > BE]
∩ [NLE > control]”, number specific activations were found in bilateral regions of the anterior IPS and the left PSPL. In addition to the activation clusters in the parietal lobe, right lateralized activations were found in the DLPFC and occipital-parietal junction (see Figure 2.3, activation displayed in red; also for Talairach coordinates see Table 2.5).
To investigate regions specifically modulated in response to brightness estimation,
!
Figure 2.3: The blue areas represent areas that were involved both when participants mapped number and brightness into space. Areas in red displayed number specific regions that were activated only when the position of numbers were estimated. The coronal section displays in addition gravity centers of two metal-analysis of numerical magnitude processing – green square (1): Cohen Kadoh, Lammertyn, & Izard (2008), in yellow square (2): Dehhaene et al. (2003). Reprinted from “Overlapping and distinct brain regions involved in estimating the spatial position of numerical and non-numerical magnitudes: An fMRI study,” by S. Vogel, 2013, Neuropsychologia, 51(5), p. 985. Copyright Elsevier. Reprinted with permission.
! Hemisphere Stereotaxic coordinates
! X Y Z
Intraparietal Sulcus R 32 -56 39
Sub-Gyral R 29 1 54
Precuneus R 8 -80 48
Middle Frontal Gyrys R 47 31 27
Middle Frontal Gyrus R 5 19 45
!
Hemisphere Stereotaxic coordinates
X Y Z
Intraparietal Sulcus R 38 -38 36
Intraparietal Sulcus L -43 -44 39
Middle Temporal Gyrus R 35 -71 15
Middle Frontal Gyrus R 23 -5 48
Precuneus L -10 -81 51
Table 2.5: Brain regions that demonstrated a significatn number specific activation (i.e., [NLE > BE] ∩ [NLE > control]). Coordinates are given in Talairach space (Talairach & Tournoux, 1988). Activations are reported at a threshold level of p < 0.001 (0.05
corrected on cluster level). Reprinted from “Overlapping and distinct brain regions involved in estimating the spatial position of numerical and non-numerical magnitudes: An fMRI study,” by S. Vogel, 2013, Neuropsychologia, 51(5), p. 985. Copyright Elsevier. Reprinted with permission.