Did galaxies reionize the universe?
Thesis by
Matthew A. Schenker
In Partial Fulfillment of the Requirements for the Degree of
Doctor of Philosophy
California Institute of Technology Pasadena, California
2015
c
⃝2015
Acknowledgments
The past 5 years of graduate studies at Caltech have easily been both the most challenging, but also most fulfilling years of my life. I consider myself fortunate to have worked with my thesis advisor, Richard Ellis; for the last four of them after I discovered how tedious CMB cosmology in the lab can be. Studying under Richard has truly been a pleasure, and I have regularly told colleagues that I could hardly imagine a better advisor. Richard’s passion for science and his work ethic are contagious, and I am sure that my thesis would not be half as good without his constant drive to uncover the truth. I’m also thankful that I can consider him a mentor, as well as a good friend.
Thanks to the others that have played the role of advisor during my time in graduate school: Brant Robertson, Dan Stark, and Andrew Lange. Whether it was a late night whiteboard session or watching Youtube clips of Rocky IV for inspiration, I never stopped learning while around these people. Chuck Stiedel, Nick Scoville, Gregg Hallinan, and Phil Hopkins are also owed gratitude for serving on my defense committee. It was a pleasure to share my years of research with such excellent scientists.
Of course, I never could have made it through five years without the support of the astronomy graduate student community. Thanks to Ryan and Sam (and Thinh) for putting up with me as a roommate and driving my carless self around LA for my first year and a half here. Gwen and Drew for always having us over for cultured events. Sirio for always having someone to rile up during an argument. Trevor for always having someone to discuss various circlon theories of physics with. Tucker for his companionship in outdoor adventure. Ben and Brandon for having friends to discuss the latest trends in credit card points and airline miles with (in addition to Richard, of course). Finally, thanks to Jason, Kat, Alex, Brian, Anna, Luke, and Brandon for all those 4 AM departures to Mammoth and the Sierra backcountry.
The support staff at Caltech has been truly phonemonal. I’m sure my computer would be smashed to pieces during a fit of rage many times over were it not for the help of Anu, Patrick, and Jose. Judy, Gita, and Gina helped my time here run as smoothly as possible. I’m also unbelievaly grateful for the hard work from the Keck crew, particularly Mark Kassis and Jim Lyke, who helped keep the instruments in top shape while observing.
Abstract
The epoch of reionization remains one of the last uncharted eras of cosmic history, yet this time is of crucial importance, encompassing the formation of both the first galaxies and the first metals in the universe. In this thesis, I present four related projects that both characterize the abundance and properties of these first galaxies and uses follow-up observations of these galaxies to achieve one of the first observations of the neutral fraction of the intergalactic medium during the heart of the reionization era.
First, we present the results of a spectroscopic survey using the Keck telescopes targeting 6.3< z <8.8 star-forming galaxies. We secured observations of 19 candidates, initially selected by applying the Lyman break technique to infrared imaging data from the Wide Field Camera 3 (WFC3) onboard the Hubble Space Telescope (HST). This survey builds upon earlier work from Stark et al. (2010, 2011), which showed that star-forming galaxies at 3< z <6, when the universe was highly ionized, displayed a significant increase in strong Lyman alpha emission with redshift. Our work uses the LRIS and NIRSPEC instruments to search for Lyman alpha emission in candidates at a greater redshift in the observed near-infrared, in order to discern if this evolution continues, or is quenched by an increase in the neutral fraction of the intergalactic medium. Our spectroscopic observations typically reach a 5σ limiting sensitivity of<50˚A. Despite expecting to detect Lyman alpha at 5σ in 7-8 galaxies based on our Monte Carlo simulations, we only achieve secure detections in two of 19 sources. Combining these results with a similar sample of 7 galaxies from Fontana et al. (2010), we determine that these few detections would only occur in < 1% of simulations if the intrinsic distribution was the same as that at z ∼ 6. We consider other explanations for this decline, but find the most convincing explanation to be an increase in the neutral fraction of the intergalactic medium. Using theoretical models, we infer a neutral fraction ofxHI ≃0.44 atz= 7.
−1.87+0−0..1817 and αz∼8=−1.94+0−0..2124. We discuss these results in the context of cosmic reionization,
and show that given reasonable assumptions about the ionizing spectra and escape fraction of ionizing photons, only half the photons needed to maintain reionization are provided by currently observable galaxies atz∼7−8. We show that an extension of the luminosity function down toMUV=−13.0,
coupled with a low level of star-formation out to higher redshift, can fit all available constraints on the ionization history of the universe.
Third, we investigate the strength of nebular emission in 3 < z <5 star-forming galaxies. We begin by using the Infrared Array Camera (IRAC) onboard the Spitzer Space Telescope to investigate the strength of Hαemission in a sample of 3.8< z <5.0 spectroscopically confirmed galaxies. We then conduct near-infrared observations of star-forming galaxies at 3< z <3.8 to investigate the strength of the [OIII] 4959/5007 and Hβ emission lines from the ground using MOSFIRE. In both cases, we uncover near-ubiquitous strong nebular emission, and find excellent agreement between the fluxes derived using the separate methods. For a subset of 9 objects in our MOSFIRE sample that have secure Spitzer IRAC detections, we compare the emission line flux derived from the excess in theKs band photometry to that derived from direct spectroscopy and find 7 to agree within a
factor of 1.6, with only one catastrophic outlier. Finally, for a different subset for which we also have DEIMOS rest-UV spectroscopy, we compare the relative velocities of Lyman alpha and the rest-optical nebular lines which should trace the cites of star-formation. We find a median velocity offset of only vLyα = 149 km s−1, significantly less than the 400 km s−1 observed for star-forming
galaxies with weaker Lyman alpha emission atz = 2−3 (Steidel et al. 2010), and show that this decrease can be explained by a decrease in the neutral hydrogen column density covering the galaxy. We discuss how this will imply a lower neutral fraction for a given observed extinction of Lyman alpha when its visibility is used to probe the ionization state of the intergalactic medium.
Finally, we utilize the recent CANDELS wide-field, infra-red photometry over the GOODS-N and S fields to re-analyze the use of Lyman alpha emission to evaluate the neutrality of the intergalactic medium. With this new data, we derive accurate ultraviolet spectral slopes for a sample of 468 3< z <6 star-forming galaxies, already observed in the rest-UV with the Keck spectroscopic survey (Stark et al. 2010). We use a Bayesian fitting method which accurately accounts for contamination and obscuration by skylines to derive a relationship between the UV-slope of a galaxy and its intrinsic Lyman alpha equivalent width probability distribution. We then apply this data to spectroscopic surveys during the reionization era, including our own, to accurately interpret the drop in observed Lyman alpha emission. From our most recent such MOSFIRE survey, we also present evidence for the most distant galaxy confirmed through emission line spectroscopy atz= 7.62, as well as a first detection of the CIII]1907/1909 doublet atz >7
Contents
Acknowledgments iii
Abstract v
1 Introduction 2
1.1 Star-forming galaxies . . . 3
1.2 Reionization . . . 8
1.2.1 Cosmic Microwave Background . . . 9
1.3 Goals of the thesis . . . 10
2 A first measurement of XHI using Lyman Break Galaxies 12 Abstract 13 2.1 Introduction . . . 14
2.2 Observations . . . 15
2.3 Analysis . . . 19
2.4 Discussion . . . 24
3 The UV Luminosity Function of Star-Forming Galaxies via Dropout Selection at Redshifts z ∼7 and 8 from the 2012 Ultra Deep Field Campaign 27 Abstract 28 3.1 Introduction . . . 29
3.2 Data . . . 31
3.2.1 UDF . . . 32
3.2.2 Auxiliary data . . . 32
3.2.3 Data Reduction . . . 35
3.2.3.1 UDF and Parallels . . . 35
3.2.3.2 ERS and CANDELS-Deep . . . 35
3.2.4 Photometry . . . 36
3.3 Candidate selection . . . 37
3.3.1 Potential contaminants . . . 37
3.3.2 Optical non-detection criteria . . . 38
3.3.3 Contamination simulations and the adopted UDF12 color-color selection . . . 39
3.3.4 UDF-P1 and UDF-P2 . . . 49
3.3.5 ERS . . . 49
3.3.6 CANDELS . . . 49
3.4 The Luminosity Function atz∼7 and∼8 from UDF12 data . . . 50
3.4.1 Simulations . . . 50
3.4.2 Maximum Likelihood Luminosity Functions . . . 51
3.4.2.1 Stepwise Maximum Likelihood Luminosity Function . . . 51
3.4.2.2 Schechter Luminosity Functions . . . 52
3.4.2.3 Cosmic Variance . . . 56
3.5 Discussion . . . 58
3.5.1 Comparison with McLure et al. (2013) . . . 58
3.5.2 Comparison with other high-redshift literature . . . 60
3.5.3 Summary . . . 61
4 Contamination of Broad-Band Photometry by Nebular Emission in High Redshift Galaxies: Investigations with Spitzer and MOSFIRE 62 Abstract 63 4.1 Introduction . . . 64
4.2 Hαemission line strengths from Spitzer IRAC photometry . . . 66
4.2.1 Data . . . 66
4.2.2 SED fitting . . . 67
4.2.3 Evidence for [3.6] emission line contamination . . . 68
4.2.3.1 Comparison to control sample . . . 68
4.2.3.2 Hαstrength . . . 69
4.3 [OIII]4959/5007 and Hβ emission line strengths from MOSFIRE . . . 71
4.3.1 Target selection . . . 71
4.3.1.1 Photometry . . . 71
4.3.1.2 Spectroscopic Sample . . . 71
4.3.1.3 Photometric Sample . . . 72
4.3.2 Observations . . . 76
4.4.1 Equivalent width distribution . . . 81
4.4.2 Comparison with Section 4.2 . . . 81
4.4.3 Verifying the SED fitting method . . . 85
4.4.4 Revised stellar mass density . . . 85
4.4.5 Lyαvelocity offsets . . . 89
4.4.6 Lyαradiative transfer modeling . . . 91
4.5 Discussion . . . 94
5 An Improved Method for Estimatingthe Evolving Neutrality of the Intergalactic Medium 96 Abstract 97 5.1 Introduction . . . 98
5.2 Lyman Alpha Fraction Test — A New Approach . . . 99
5.3 Improved Post-Reionization Data . . . 101
5.3.1 DEIMOS/FORS2 Spectroscopy . . . 101
5.3.2 Photometry . . . 101
5.4 Analysis . . . 102
5.4.1 Lyman alpha and the UV continuum . . . 102
5.4.2 The UV slope-dependent EW distribution . . . 104
5.4.2.1 Equivalent Width Distributions for a Fixed UV Continuum Slope . 105 5.4.2.2 A Generalized Approach . . . 108
5.4.3 UV Slope versus UV Luminosity . . . 109
5.5 First Application to Data within the Reionization Era . . . 110
5.5.1 A New MOSFIRE Survey . . . 110
5.5.1.1 The GOODS-South / Ultra Deep Field . . . 113
5.5.1.2 CLASH Lensing Sample . . . 113
5.5.1.3 Data reduction . . . 114
5.5.2 A New z=7.62 Lyman Alpha Emitting Galaxy . . . 115
5.5.3 Additional Data from Published Surveys . . . 116
5.5.3.1 Monte Carlo simulation . . . 117
5.5.3.2 Comparison between UV slope and UV luminosity predictions . . . 118
5.5.3.3 Analysing the entire sample . . . 119
5.6 Spectroscopy with the CIII] 1907/1909 doublet . . . 121
5.6.1 Data . . . 122
5.6.2 Results . . . 123
5.8 Appendix . . . 127
5.8.1 A. Models for p(EW—β) . . . 127
5.8.2 B. Results of full modeling procedure . . . 129
6 Synthesis and future prospects 131 6.1 Charting cosmic reionization . . . 131
6.1.1 Systematic errors in the xLyα test . . . 133
6.1.1.1 Intrinsic Lyαdistribution atz≥7 . . . 133
6.1.1.2 Lyαvelocity offset . . . 134
6.1.1.3 Ionizing photon escape fraction . . . 134
6.2 Understanding reionization in the context of observations . . . 135
6.2.1 Observational constraints . . . 136
6.2.1.1 UV luminosity densities . . . 136
6.2.1.2 Stellar mass densities . . . 137
6.2.1.3 Thomson scattering optical depth . . . 137
6.2.2 Other inputs . . . 137
6.2.3 Results . . . 139
6.3 Future directions . . . 141
6.3.1 High redshift galaxies . . . 141
6.3.2 Neutral fraction measurements . . . 146
List of Figures
1.1 Lyman break galaxy selection example . . . 5
1.2 Star-formation rate density across cosmic time . . . 7
2.1 Distribution ofMU V for 2011 spectroscopic campaign . . . 18
2.2 Lyαdetections from 2011 spectroscopic campaign . . . 20
2.3 2011 NIRSPEC and LRIS Lyαsensitivity limits . . . 22
2.4 Expected Lyαdetections for 2011 NIRSPEC and LRIS . . . 23
2.5 Redshift-dependent fraction of LBGs with Lyαemission . . . 25
3.1 UDF12 contaminant color cuts . . . 40
3.2 UDF12 selection function . . . 41
3.3 UDF12 dropout color-color diagrams . . . 42
3.4 Thez∼7 LF . . . 54
3.5 Thez∼8 LF . . . 55
4.1 Broadband line contamination by redshift . . . 65
4.2 IRAC color 3.1< z <3.6 vs. 3.8< z <5.0 . . . 68
4.3 3.6µm excess and inferredEWHα distribution . . . 69
4.4 GOODS-N sample redshift distribution . . . 73
4.5 Example 2D MOSFIRE spectra . . . 77
4.6 OIII 4959+5007 EW distribution . . . 82
4.7 Comparison with photometric Hαdistribution . . . 83
4.8 MOSFIRE target example SEDs . . . 86
4.9 CorrectedM⋆−MU V relationship atz∼4,5,6,7 . . . 88
4.10 Derived stellar mass densities atz∼4−8 . . . 89
4.11 Lyαvelocity offset . . . 91
5.1 UV slope vs. Lyman alpha EW . . . 103
5.2 Predicted and observed UV slopes for DEIMOS sample . . . 104
5.4 LyαEW distribution atβ∼ −2.3 . . . 107
5.5 Best fitβ vs. EWLyα curves . . . 108
5.6 One and two dimensional spectra of UDF12-3313-6546 . . . 115
5.7 Cutouts and p(z) ofz= 7.62 candidate galaxy . . . 116
5.8 Predictedz∼8 MOSFIRE Lyαdetections . . . 118
5.9 Composite predicted detections atz∼7 and 8 . . . 119
5.10 Lyman alpha fraction fromz= 4−8 . . . 121
5.11 1D and 2D spectra of tentative CIII detection . . . 124
5.12 CIII spectrum broken down by epoch . . . 124
5.13 Correlation between Lyαand CIII equivalent widths . . . 126
5.14 Posterior probability forβ-EWLyα model parameters . . . 130
6.1 UV slope and ionizing photon output constraints from UDF12 . . . 138
6.2 Best fit reionization model and observational constraints . . . 140
6.3 Reionization model with independent constraints onQHII . . . 142
6.4 Simulatedz∼7 lf from the HST Frontier Fields . . . 144
List of Tables
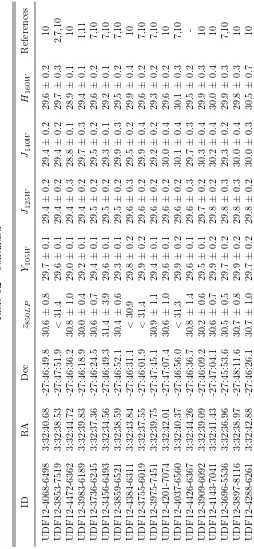
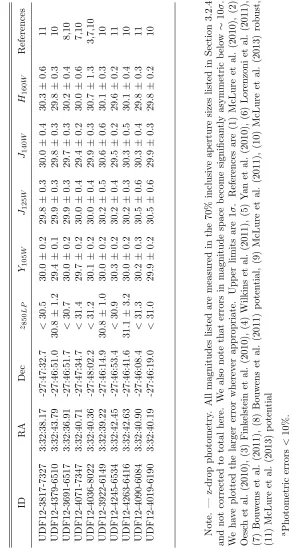
2.1 2011 NIRSPEC and LRIS target list . . . 17
3.1 LF Datasets, candidates, and Survey Depth 5σAB . . . 34
3.2 UDF12z-drops 6.2< z <7.3 . . . 44
3.2 UDF12z-drops 6.2< z <7.3 . . . 45
3.2 UDF12z-drops 6.2< z <7.3 . . . 46
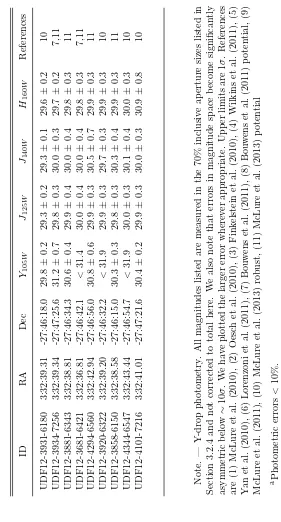
3.3 UDF12Y-drops 7.3< z <8.5 . . . 47
3.3 UDF12Y-drops 7.3< z <8.5 . . . 48
3.4 SWML determination of thez∼7 LF . . . 53
3.5 SWML determination of thez∼8 LF . . . 53
3.6 Best fit LF parameter compilation . . . 59
4.1 MOSFIRE target list and properties . . . 74
4.1 MOSFIRE target list and properties . . . 75
4.2 MOSFIRE Hβ + [OII] spectroscopic measurements . . . 79
4.2 MOSFIRE Hβ + [OII] spectroscopic measurements . . . 80
4.3 Lyαradiative transfer best-fit parameters . . . 93
5.1 Summary of MOSFIRE survey for Lyα . . . 111
5.1 Summary of MOSFIRE survey for Lyα . . . 112
5.2 xLyαtarget compilation and results . . . 120
Statement of Originality
Sections of this thesis have been previously published as Schenker, M. A., Stark, D. P., Ellis, R. S., et al. 2012, ApJ, 744, 179 (Chapter 2), Schenker, M. A., Robertson, B. E., Ellis, R. S., et al. 2013, ApJ, 768, 196 (Chapter 3), Stark, D. P., Schenker, M. A., Ellis, R., et al. 2013a, ApJ, 763, 129 and Schenker, M. A., Ellis, R. S., Konidaris, N. P., & Stark, D. P. 2013a, ApJ, 777, 67 (Chapter 4), and Robertson, B. E., Furlanetto, S. R., Schneider, E., et al. including M.A. Schenker 2013, ApJ, 768, 71 (Section 6.2). The majority of the work presented in Chapter 5 has been submitted to
The Astrophysical Journal as Schenker et al. (2014), while Section 5.6 will appear in an additional forthcoming paper (Stark et al., in preparation).
Chapter 1
Introduction
Remarkably, our knowledge of the physical state of the universe in its earliest moments remains much more complete than that of the subsequent billion years. Until 380,000 years after the big bang, free electrons, nuclei, and photons were coupled to one another and smoothly spread throughout the uni-verse along with an underlying distribution of dark matter. Once the uniuni-verse had cooled enough that nuclei and electrons were able to recombine, the mean free path of photons dramatically increased. We observe this free streaming of photons today as the cosmic microwave background (CMB), and it is this decoupling of baryons and photons that also finally permitted baryonic structures to grow. Overdensities of dark matter, imprinted from primordial quantum fluctuations, provided the scaf-folding upon which baryonic matter subsequently accreted. These collapsed structures, or halos, continued to grow, and by a redshift of perhaps z∼20−30 (100-200 Myr after the big bang), the largest had grown hot enough to radiate energy through molecular hydrogen. With the new-found ability for these baryonic structures to cool and therefore further collapse, the first stars then formed (Bromm 2013). Throughout the subsequent 800 Myr, these structures grew through both mergers and further accretion, eventually producing enough energetic photons to reionize the vast majority of the hydrogen gas that lay between galaxies in the intergalactic medium (IGM).
Although the hunt to find these first stars and galaxies continues, technical and observational breakthroughs in the preceding two decades have transformed our knowledge of galaxy formation and evolution in the first 2 billion years. Prior to the pioneering work of Steidel et al. (1995), there existed no functional method to detect “normal” star-forming galaxies in this era. Today, we have the first useful constraints on the star-formation rate density of the universe out to z ∼ 10 (Ellis et al. 2013; Oesch et al. 2014), only 500 Myr after the big bang. Independent lines of evidence also now imply that reionization concluded at a redshift of z ∼6.5 (e.g., Fan et al. 2006; Bolton et al. 2011; Konno et al. 2014).
drive this phase transition? How well do we really understand the properties of the high-redshift galaxies we discover? These are the questions that I have sought to answer over the previous five years at Caltech and in this thesis. In the following sections, I provide historical overviews of both the searches and characterization of high-redshift galaxies as well as measurements of reionization, concluding each with a summary of present day knowledge.
1.1
Star-forming galaxies
Dating back to the beginning of extragalactic astronomy with pioneering observations by Vesto Slipher and Edwin Hubble in the early 20th century, astronomers have been keenly interested in the study of distant galaxies. With the discovery of the CMB, and the firm establishment of big bang cosmology, these searches took on an even more important goal. By predicting that all matter in the universe originated at a single point in time, to understand conditions earlier in the universe, it was simply necessary to discover yet more distant objects. Indeed, the quasars discovered at cosmological distances by Schmidt (1965) provided our first glimpse at early structure formation in the universe and the intergalactic conditions at that time. The hunt for “normal” star-forming galaxies proved much more difficult.
From 1960 through the mid 1980s, the most distant confirmed galaxies were discovered almost exclusively as intense radio sources from the Cambridge 3C survey (Edge et al. 1959). While these sources helped to push back our redshift frontier, given the presence of an active galactic nucleus which leads to a luminous radio source, they could not be used to construct any kind of characteristic sample. The lack of detection of a population of distant star-forming galaxies without these central engines, however, was not for lack of trying.
Early work by Partridge & Peebles (1967) suggested that the rest-UV continuum and the Lyα emission line could be useful signposts for the discovery of primeval galaxies, with up to∼6−7% of the total flux emerging through Lyαemission. Subsequent attempts to discover these objects using direct detection through photographic plates (Partridge 1974) and fluctuations in the far-optical sky background measured through photometers (Davis & Wilkinson 1974) unfortunately proved unsuccessful.
than halfway back to the beginning of the universe, making these excellent candidates for primeval galaxies.
The advent of CCDs in the 1980s brought even deeper surveys that confirmed this abundance of faint blue galaxies (Hall & Mackay 1984; Tyson 1988), as well as studies of infrared colors of brighter galaxies that pointed toward increased star formation at z > 0.5 (Ellis & Allen 1983). However, the distance of these could not be thoroughly investigated until the advent of multiobject spectrographs. The necessary samples were finally built up with FOCAP, LDSS, and Autofib at the Anglo Australian Telescope (Broadhurst et al. 1988; Colless et al. 1990; Ellis et al. 1996), as well as LDSS-2 on the William Hershel Telescope (Glazebrook et al. 1995). Unfortunately, these surveys found that the large majority of the faint blue galaxy population lay atz <1, and did not consist of thez >2 primordial galaxies initially expected (Colless et al. 1993; Ellis et al. 1996).
Narrowband searches for the Lyα emission line were also undertaken, but also had difficulty locating these early galaxies. Djorgovski et al. (1985) initially reported the discovery of a galaxy through Lyαemission nearby az∼3.2 quasar. The authors imaged the field in both a narrowband filter at the expected wavelength of Lyα and a broadband filter longward of this wavelength, in order to distinguish objects with an excess in the narrowband, and thus strong Lyαemission. Un-fortunately, this object was later found to be yet another active galactic nucleus through follow-up spectroscopy, but the path to discovery of these objects (known as Lyman alpha emitters, or LAEs) had been paved.
Attempts to recover primeval galaxies continued this technique in the coming years through further narrowband imaging (e.g., Pritchet & Hartwick 1987, 1990), slitless spectroscopy (Crampton et al. 1987), and longslit spectroscopy (Lowenthal et al. 1990), but were met with little success. Indeed, the first LAEs atz >3 would not be discovered until the successful survey of Cowie & Hu (1998) atz∼3.4.
However, the breakthrough to open the door to discovery of star-forming, but otherwise nor-mal, galaxies at high redshift was achieved by Chuck Steidel and collaborators with the successful application of the Lyman break technique (Steidel et al. 1995, 1996). This observational method used a custom set of broadband filters designed to identify the sharp cutoff in flux below the 912 ˚A Lyman limit in the rest frame of distant galaxies, due to both a combination of opacity in stellar atmospheres themselves and residual HI in the intergalactic medium. Spectroscopic follow-up ob-servations of these galaxies with the Keck telescope then proved incredibly effective, with upwards of 70% confirmed to lie atz≥3 (Steidel et al. 1996).
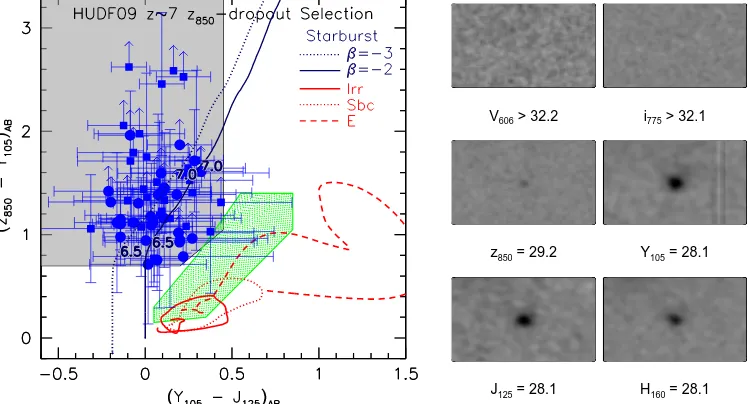
V606 > 32.2 i775 > 32.1
z850 = 29.2 Y105 = 28.1
J125 = 28.1 H160 = 28.1
Figure 1.1 Demonstration of the color-color method used to select high-redshift star-forming galaxies pioneered by Steidel et al. (1995). Left: Demonstration of the technique atz∼7 in the HUDF from Bouwens et al. (2011). Vertical axis denotes the amplitude of the targeted spectral break, while the horizontal axis displays the color just longward of the break. z ∼7 galaxies are selected in the grey region, where the break amplitude is large (z850−Y105≥0.75), and the color longward is only
moderately red (Y105−J125 ≤0.45). In addition, all candidates have fluxes below the 2σ limits
next breakthrough. Progress came from both the wide-area 320′2 GOODS fields (e.g., Giavalisco
et al. 2004; Dickinson et al. 2004) and the 11′2 Hubble Ultra Deep Field (e.g., Bunker et al. 2004;
Beckwith et al. 2006; Coe et al. 2006), both of which uncovered Lyman break galaxies out toz∼6. As before, spectroscopic follow-up of these candidates found that the majority of these populations indeed reside at high redshift (Bunker et al. 2003; Stanway et al. 2004; Stark et al. 2010).
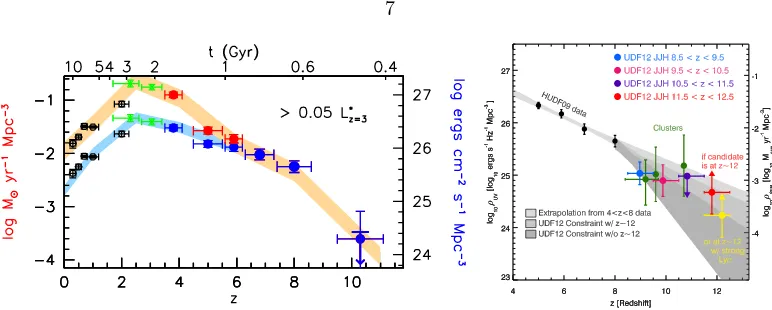
With the discovery of such distant populations, an understanding of the evolution of galaxies in this early time began to come about. As at lower redshift, the UV-selected galaxy luminosity function closely resembles that originally proposed by Schechter (1976), with an exponential dropoff above a given brightness and a power law growth in the number density of galaxies below this brightness. The total star-formation rate density of the universe, as shown in Figure 1.2, was seen to steadily decline from its peak at z ∼ 2−3 out to z ∼ 6. Bouwens et al. (2007) showed that this decline was largely caused by a decrease in the characteristic luminosity with redshift, while the faint end slope remained consistent withα∼ −1.7 between redshifts 3 and 6.
However, as the Hubble Space Telescope can only probe the rest-UV spectrum of these galaxies, it is primarily sensitive to the youngest and hottest stars, which comprise only a small component of a galaxy’s stellar mass for any allowed initial mass function (Salpeter 1955; Kroupa 2001; Chabrier 2003). To effectively measure the stellar mass of these galaxies requires photometry that measures the rest-frame optical or longer wavelengths at which more numerous, low-mass stars output the majority of their light. Despite a primary mirror just 0.85 m in diameter, the Spitzer Space Telescope has excelled in providing these crucial measurements. Spitzer’s Infrared Array Camera (IRAC) has enabled ultradeep exposures centered at 3.6 and 4.5 µm capable of providing stellar masses for individual galaxies out toz∼6, and now even beyond.
Initial measurements showed that even out to z ∼ 6, many UV-luminous galaxies displayed strikingly red UV to optical colors, with observed breaks as great as∼1 mag. This was taken to indicate that these galaxies were both extremely massive, withM∗ ∼1010M
⊙, and had ages≥100 Myr at a time when then universe was less than 1 Gyr old (e.g., Eyles et al. 2005; Labb´e et al. 2006). However, more careful work soon noted that as the observed equivalent width of an emission line increases with redshift, rest frame optical emission lines including Hαand [OIII] could be responsible for a significant fraction of the measured flux in the Spitzer bandpass (Schaerer & de Barros 2009). As we shall show in Chapter 4, however, Spitzer plays a valuable role in constrain the observed strength of these rest-optical emission lines. With the use of a carefully chosen spectroscopic sample, it is capable of both deriving both broadband photometric corrections for emission lines, and an estimate of the stellar mass density at high redshift. We note that even with our derived corrections, the stellar masses of z ∼6 galaxies remain large enough (M∗ ∼4×10⁹M
⊙ at MU V ∼ −21) to imply
significant star formation at earlier times.
Figure 1.2 Left: Star-formation rate density vs. redshift adopted from Bouwens et al. (2011). Black data at z < 2 are from Schiminovich et al. (2005), green at 2 < z < 3 from Reddy & Steidel (2009), with the remaining from Bouwens et al. (2007) and Bouwens et al. (2011). The upper data highlighted by the red curve includes a correction for star-formation obscured by dust, while the lower curve simply uses the star-formation rates derived from the UV continuum. There exists a clear peak in the cosmic star-formation rate density at z ∼2−3, and a gradual drop-off toward higher redshift. Right: SFRD plotted against redshift atz >4 showing the measurements from the UDF12 campaign out toz∼12. Adopted from Ellis et al. (2013).
a similar advance in our knowledge of star-forming galaxies at z > 7 as the ACS provided at 3< z <6. With an increase in survey efficiency of ∼40x compared to the previous HST infrared camera, NICMOS, the field went from a handful of credible z > 7 candidates (Bouwens et al. 2008) to hundreds (e.g., McLure et al. 2010; Bouwens et al. 2011; Yan et al. 2011; Finkelstein et al. 2011). Simultaneously, advances in infrared detectors on the ground and large surveys have begun to provide robust measurements of the abundance of brightz∼7 Lyman break galaxies (e.g., Ouchi et al. 2010; Castellano et al. 2010; Bowler et al. 2012).
With these observations, luminosity functions have been constructed out to z ∼ 8, and even rough measurements of the star-formation rate density out to z ∼ 12. At the bright end, where observations come from wide area, ground-based surveys, it remains unclear whether the abundance follows a double power law form, indicating that feedback may not yet be in place atz∼7 (Bowler et al. 2014), or the characteristic exponential dropoff of the Schechter function (Ouchi et al. 2009; Castellano et al. 2010). At the faint end, where the majority of the UV luminosity density arises, there is no evidence for any departure from a power law slope. Before this thesis, measurements of the faint end slope were very unclear. Although there existed marginal evidence for a steepening of this slope from the−1.7 observed at 3< z <6, Bouwens et al. (2012a) estimated that the measured uncertainty on the z ∼ 7 slope in 2011 resulted in an uncertainty of ∼ 6× in the integrated UV luminosity density. In order to understand the capability of galaxies to reionize the universe, an accurate measurement of this slope is crucial.
molecular associations in local star-forming galaxies (Ono et al. 2013). Much effort has been put in over the last few years to accurately measure the ultraviolet spectral slopes of these galaxies, parameterized as fλ ∝ λβ, by comparing the fluxes measured in different WFC3 filters. Despite
early claims of extremely young, metal-poor populations (Bouwens et al. 2010b), a general consensus has emerged that faint z ∼ 7 galaxies have moderately blue slopes, withβ ∼ −2.0 to −2.3 (e.g., Finkelstein et al. 2012b; Bouwens et al. 2012b). These measurements are consistent with either solar metallicity populations with zero reddening, or moderately sub solar (Z = 0.1−0.2Z⊙) populations with moderate reddening (Dunlop et al. 2012). However, an added uncertainty is the source of this reddening; although dust within the galaxy is a likely origin, the reprocessing of ionizing photons into nebular continuum emission by hydrogen, if strong enough, can have a similar effect (Robertson 2010b).
1.2
Reionization
We now shift our focus from the galaxies to their influence on the surrounding IGM. As we previously noted, in the mid 1960s the near concurrent discoveries of primordial radiation from the cosmic microwave background (Penzias & Wilson 1965) and the first quasars (Schmidt 1965) revolutionized our view of the universe and provided unambiguous evidence in support of the big bang theory. Shortly afterward, Gunn & Peterson (1965) realized that a measurement of the spectrum shortward of the observed wavelength of Lyαcould yield an estimate or upper limit on the neutral hydrogen density, xHI, in the vicinity of the quasars and provide a first glimpse of the ionization history of
the universe. At the time, the authors expected to uncover a large quantity of neutral hydrogen, which would provide the needed cosmic density to decelerate the universe. Instead, they discovered only an upper limit of nHI <6×10⁻¹¹ atoms cm−3, equivalent to 1 part in 105 of the required
critical density. Interestingly, the authors assumed that a majority of the remaining matter was in the form of ionized hydrogen, with free-free emission from the intergalactic medium itself, and not star-forming galaxies, as the most likely source of ionization.
Since this first measurement, quasar spectroscopy has remained one of the most valuable probes for the ionization state of the IGM across its history. Steidel & Sargent (1987) provided an updated measurement of the Gunn-Peterson limit using a statistical study of the Lyαforest in high-resolution spectra of quasars. Because the Lyαforest is composed of many discrete clumps of neutral Hydrogen, it becomes difficult to directly measure the true continuum flux level originating from the quasar. Instead, Steidel & Sargent (1987) obtained spectra of moderate resolution with significant wavelength coverage longward of Lyα, which were then extrapolated to provide an estimate of the intrinsic continuum shortward. This resulted in a limit ofτGP <0.05 atz= 2.64. Converting to a neutral
In the following years, progress pushing out the known boundary of the ionized IGM continued using quasar spectroscopy, but the first evidence for a neutral IGM would not come until much later. Webb et al. (1992) infer a limit ofτGP <0.04 atz= 4.11 through quasar spectroscopy and a similar
extrapolation to that used in Steidel & Sargent (1987). The advent of the Sloan Digital Sky Survey (SDSS) allowed this technique to be pushed out even further. Songaila et al. (1999) and Fan et al. (2000) both report upper limits on the Gunn-Peterson optical depth ofτGP <0.1 and 0.4, atz∼5
and 5.7, respectively, by measuring the continuum level between gaps in the Lyαforest. However, even these results still only traced neutral fractions in the diffuse IGM ofxHI≪10−4.
The first substantial evidence for an uptick in the neutral hydrogen content of the universe came with the discovery of a complete Gunn-Peterson trough in the spectrum of az= 6.28 quasar (Becker et al. 2001; Fan et al. 2001). More convincing evidence came from Fan et al. (2006), who used spectra of 19 quasars from SDSS to measure the evolution of the Gunn-Peterson optical depth, and thus neutral hydrogen fraction between 5.0 < z < 6.2. They found a strong lower limit of xHI >5×10⁻⁴, nearly an order of magnitude greater than the fraction at z ∼5. However, with
such a strong increase in the optical depth, it has become impractical to expose any deeper with current facilities in order to further push up the lower limit of these measurements, thus requiring new techniques to continue to use this spectroscopy to probe IGM ionization.
One such promising measurement recently arose through the first discovery of az >7 quasar by Mortlock et al. (2011). As the Gunn-Peterson optical depth has already saturated at these redshifts, Bolton et al. (2011) used measurements of the Lyαdamping wing and radiative transfer simulations to infer a neutral fraction ofxHI>0.1. However, there are numerous drawbacks. The measurement
only takes place along a single sightline, and could also be due to a damped Lyαsystem in close proximity to the quasar, which would obviate the need for such a large neutral fraction. To make further progress, a much larger sample ofz >7 quasars is needed.
1.2.1
Cosmic Microwave Background
In the era of precision cosmology, observations of the cosmic microwave background are also able to give us details about the epoch of reionization, as a small fraction of these photons are scattered between their emission atz≃1100 and their observation. As charged free electrons are much more readily able to interact with microwave photons than neutral hydrogen through Thomson scattering, their presence is able to imprint a distinct signature on the CMB.
Most prominently, this scattering imparts a large-scale linear polarization signal through trans-forming the CMB temperature spectrum’s quadrupole anisotropy, as first noticed by Rees (1968). To obtain a measurement of the Thomson optical depth,τe, and thus a measurement of the integrated
WMAP has provided measurements of this polarization signal, which can then be translated to an estimate for the redshift of reionization if it proceeded instantaneously, with the 9-year results indicating a redshift ofzreion = 10.5±1.1 (Hinshaw et al. 2013). However, since τe represents an
integral measurement, if early star-formation maintains a low level of ionization, the 50% reion-ization redshift will be pushed further toward the present day (Fukugita & Kawasaki 2003). To disentangle this, there remain higher order statistics available in the large-scale polarization data, and Kaplinghat et al. (2003) showed that Planck measurements of the complete power spectrum may be able to discriminate between different reionization histories with the same optical depth.
In addition to polarization on large scales, temperature anisotropy measurements on small scales will also provide some insight into reionization. During reionization, the kinetic Sunyaev-Zel’dovich effect, or scattering of photons off of large-scale coherent velocity flows, can impart an imprint on the observed CMB. Although scatterings from gas falling into one side of a potential well are generally offset by scatterings from the opposite side, a patchy ionization structure in a partially neutral IGM will modulate this (Gruzinov & Hu 1998). McQuinn et al. (2005) show that the amplitude of these features in the CMB power spectrum is strongly dependent upon the duration of the patchy phase of reionization, providing a complementary measurement to the Thomson optical depth. Recent measurements from the SPT have claimed an upper limit of ∆zreion < 7.2 from searches for this
effect on small scales (Zahn et al. 2012).
1.3
Goals of the thesis
Having outlined the territory, I now provide a brief introduction to the two main objectives of this thesis. Firstly, I have sought to provide a more comprehensive picture of the latter stages of reionization. Quasar spectroscopy has shown that the neutral fraction of the IGM increases sharply atz >6.0, but these spectra are insensitive toxHI&10−3. To this end, we undertook a Keck survey
the number of detections we expect at z ≥ 6.5. This method has the advantage of being more physically based, as the UV slope represents a combination of the stellar population, age, and dust content, each of which are directly related to Lyαproduction and/or escape. This new methodology is presented in conjunction with a new MOSFIRE survey targeting Lyαemission atz∼8. Together with data from the literature, we update our earlier measurement atz ∼7, and provide evidence for further evolution atz∼8.
The second component of this thesis seeks to determine whether star-forming galaxies themselves are able to drive the reionization process. As mentioned previously, a key quantity for answering this question is the faint end slope of thez≥7 Schechter UV luminosity function, as we are now confident that the necessary photons cannot arrive from the luminous (L≃L∗) galaxies alone (Bouwens et al. 2012a; Finkelstein et al. 2012a). Chapter 3 presents one of the key results from the UDF12 HST project (GO: 12498, PI: R. Ellis), which approximately doubled the near-infrared exposure time in the Hubble Ultra Deep Field and significantly expanded our view ofz≥7 star-forming galaxies. I detail here the deepest measurement to date of thez∼7 and 8 UV luminosity functions, extending
∼0.65(0.15) mag deeper atz∼7(8) than previous estimates, and providing evidence for evolution in the faint end slope.
Chapter 2
A first measurement of
X
HI
using
Abstract
2.1
Introduction
Determining when neutral hydrogen in the intergalactic medium (IGM) was reionized is an impor-tant question in observational cosmology and a precursor to understanding whether star forming galaxies provided the necessary UV photons (Robertson 2010b). One of the most practical probes of reionization with current facilities utilizes the frequency of occurrence of Lyα emission in star forming galaxies. As Lyαphotons are resonantly scattered by neutral hydrogen, the abundance of Lyα emitters should decrease as observations probe into the era where there is neutral gas (e.g., Malhotra & Rhoads 2004; Ouchi et al. 2010; Kashikawa et al. 2011). The recent discovery of large numbers of candidate galaxies beyond z ≃7 through multi-color imaging undertaken with the in-frared Wide Field Camera (WFC3/IR) onboard Hubble Space Telescope (HST) (e.g., Bouwens et al. 2010a; Bunker et al. 2010; Finkelstein et al. 2010; McLure et al. 2010) now makes it feasible to track the occurrence of Lyαline emission to interesting redshifts where neutral hydrogen may be present. Of course, astrophysical factors other than a neutral IGM can also affect the presence of Lyα emission. Because of this, an alternative approach for gauging when reionization occurred, intro-duced by Stark et al. (2010) (hereafter Paper I), is to spectroscopically measure the fraction of Lyαemission within color-selected Lyman Break Galaxy (LBG) populations. Tracking the redshift-dependent fraction in a well-defined population avoids consideration of absolute changes in the host galaxy number density, such as has been the case in studies based on the luminosity function of narrow-band selected Lymanαemitters (LAEs). Furthermore, evolution in dust obscuration can be independently tracked via correlations seen with the colors of the rest-frame UV continuum. Paper I presented a comprehensive survey of over 600 LBGs with deep spectra, mostly undertaken with the DEIMOS instrument on Keck, but including published samples from the Very Large Telescope (VLT, Vanzella et al. (2009) and references therein). In that paper we demonstrated the utility of the method and discussed the paucity of line emission in gravitationally-lensed z > 7 candidates from the sample of Richard et al. (2008).
In Stark et al. (2011) (hereafter Paper II), through ultra-deep exposures with DEIMOS we significantly improved the line emission statistics atz≃6, providing a robust measure of the rest-frame EW distribution of Lyαemission at the highest redshift when the Universe is believed to be fully ionized (Fan et al. 2006, c.f. Mesinger 2010). This provides a sound basis for predicting the likelihood of emission at higher redshift and thereby enabling a test of whether there is absorption by neutral gas. Significantly, we found that over 50% of moderately-faint (−20.25<MUV<−18.75)
studies of Fontana et al. (2010) and Vanzella et al. (2011).
The present paper is concerned with an initial application of this test to the newly-available sample of WFC3/IR candidates with photometric redshifts in the redshift range 6.3< z <8.8. Two important factors have motivated and shaped our program. Firstly, it is important to note that Lyαemission is the only spectroscopic redshift indicator for galaxies beyondz≃6. Since it is the absence of strong Lyαemission that provides the basis for considering an increased neutral fraction, it is important to be sure that the targets are truly at the expected redshifts. Many early candidate LBGs believed to lie beyondz≃6−7 remained controversial because of their limited or marginal photometry. The improved filter set and superior performance of WFC3/IR has given us confidence that the current list of z ≃7−8 candidates is more robust than those based on earlier NICMOS data (Robertson 2010b). Secondly, to match the lower redshift data, sampling from a similarly wide range of LBG luminosities, as we do here, will be advantageous. As shown in Papers I and II, the fraction of line emission increases in intrinsically fainter sources and so by comparing fractions with respect to their LBG luminosities, we may gain additional evidence for the onset of the neutral era. Throughout the paper, we adopt a Λ-dominated, flat universe with ΩΛ = 0.7, ΩM = 0.3, and
H0= 70 h70km s−1Mpc−1. All magnitudes in this paper are quoted in the AB system (Oke & Gunn
1983).
2.2
Observations
In compiling a target list for this program, we are guided by the need for a robust photometric redshift for each galaxy based on improved photometry from WFC3/IR and a range of rest-frame UV luminosities (MUV1). Our primary source of targets for the wide-field multi-slit capabilities of
the Low Resolution Imaging Spectrometer (LRIS) on the Keck I telescope (Oke et al. 1995) equipped with a new red-sensitive CCD was i′ and z′-drop candidates whose photometric redshiftsz > 6.3 from the HST Early Release Science (ERS) field (Hathi et al. 2010; McLure et al. 2011). The grating for these observations was blazed at 600 lines mm−1. On January 7 and February 4 2011 we secured 7 hours of on-source integration for 8 suitable targets on a single mask using slit widths of 1′′, observed through a median seeing of 0.98′′.
In a more ambitious campaign probing to higher redshift we also targeted 3 z′-drop sources from the Hubble Ultradeep Field (HUDF) P34 field (GO 11563, PI: Illingworth) and an additional gravitationally-lensed source in the cluster MS0451-03 (GO 11591, PI: Kneib) using the near-infrared spectrograph NIRSPEC (McLean et al. 1998) during November 14-17 2010 and Jan 14-15 2011. This extends our search for Lyαemission up to a redshiftz≃8.2. Although we undertook extended integrations on all 4 sources with a 0.76′′ slit, tracking difficulties affected some exposures. To
determine the effective on-source integration time, we secured our astrometric position for each exposure by locating objects visible in the slit viewing camera to a precision of∼0.2′′. We continued this campaign over May 15-18 2011. During these 4 nights, we did not encounter any tracking difficulties and, in excellent conditions, successfully used NIRSPEC to study an additional 7 WFC3-IR dropouts drawn from numerous surveys: the BoRG pure parallel survey (Trenti et al. 2011) (also independently discovered by Yan et al. 2011), the EGS region in CANDELS (Grogin et al. 2011; Koekemoer et al. 2011), and the lensing clusters Abell 1703 (GO 10325, PI: Ford, Bradley et al. 2012b), and Abell 2261 (CLASH survey, Postman et al. 2012).
We reduce the LRIS data following standard procedures, with bias subtraction and flat-fielding using dome exposures. We used the Kelson (2003) code to remove spatial and spectral distor-tion and to model and subtract the sky emission. Wavelength calibradistor-tion was determined directly from sky lines. A final two-dimensional spectrum was extracted for each object with pixels binned logarithmically by ∆log(λ) = 4.02×10⁻⁵. As in Papers I and II, we search through the
two-dimensional spectrum visually to identify emission lines, and confirm these with a boxcar extracted one-dimensional spectrum.
Figure 2.1 Distribution of rest-frame UV absolute magnitudes,MU V, fori′-drop sources discussed in
Paper II with z∼5.5-6.3 (top panel) compared with those for the present survey ofi′ andz′-drops at z≥6.3 (lower panel). There is an additional dropout, A2261 1, not shown on this histogram at MU V ≃ −16. Dark shading in the lower panel refers to sources selected on the basis of WFC3/IR
imaging in the Keck campaign (Table 2.1); light shading refers to additional data drawn from the VLT campaign of Fontana et al. (2010).
In total, this paper therefore presents the results of Keck spectroscopy for 19 WFC3-IR selected sources whose photometric redshifts lie in the range 6.3< z <8.8. A summary of the new observa-tions is given in Table 2.1. To this sample, we add a further 7z >6.3 sources discussed by Fontana et al. (2010). Figure 2.1 compares the UV absolute magnitude distribution of the combined sample with that presented for the redshift rangez≃5−6 in Paper II; clearly the samples span a similar luminosity range. This luminosity range is broader than the recent work of Ono et al. (2012) and Pentericci et al. (2011). In similar spectroscopic follow-up campaigns, they target brighter dropouts, primarily with MU V <−21.4, and−21.75<MU V <−20.0, respectively.
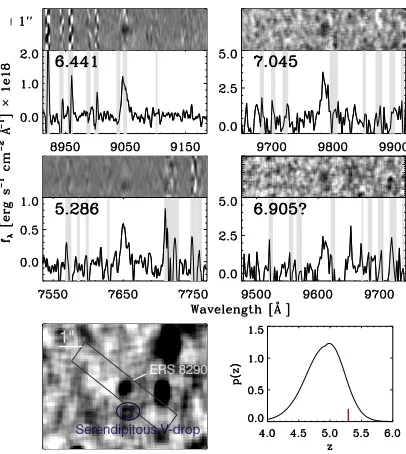
Remarkably, from the new Keck exposures, we find very few convincing detections of line emis-sion. Figure 2.2 (bottom panel) shows a 2-D spectroscopic montage of 4 sources for which line emission may be present, of which one case (HUDF09 1596) is marginal (2σ) and the other (ERS 8290) lies outside the expected redshift range if it is Lyα.
The emission line apparently seen in ERS 8290 (a z′-band dropout) is detected at>5σ with a flux of 6.7 ± 0.8 × 10⁻¹⁸ erg cm−2 s−1 at λ7644 ± 2 ˚A. It also exhibits the asymmetric profile
increase the photometric redshift estimate. The resolution of the confusion arising from these two proximate sources emphasizes again the prominence of Lyαemission in low luminosity z ≃ 5−6 sources (Papers I and II).
The two satisfactory detections refer to emission atλ9045±2 ˚A for ERS 8496 in the LRIS mask and emission atλ9780±4 ˚A in the NIRSPEC exposure of the lensed source Abell 1703 zD6. Both objects are detected at≥5σin our final exposures. In our 1D extraction of ERS 8496, the emission line has a FWHM of 9 ±1 ˚A, and displays an asymmetric profile with a steeply rising blue edge and slowly decaying red tail, characteristic features of Lyαat high redshift. Because our spectral resolution is significantly lower (6.5 ˚A for NIRSPEC versus 4.1 ˚A for LRIS) in our spectrum of A1703 zD6, so we are unable to determine any line profile information. The emission feature is seen independently in coadditions on two separate nights, indicating its reality.
If both lines are Lyα, the implied spectroscopic redshifts for ERS 8496 and Abell 1703 zD6 are z = 6.441±0.002 and 7.045±0.004, respectively, in excellent agreement with our photometric predictions of 6.52 and that of 7.0 derived by Bradley et al. (2012b). The measured line fluxes for the two objects are 9.1±1.4 and 28.4±5.3×10⁻¹⁸erg cm−2s−1. We then assume a spectral slope
ofβ = -2, which is characteristic of galaxies at this redshift (Dunlop et al. 2012), though there may be evidence for steeper slopes at sub-L⋆luminosities (Bouwens et al. 2010b). Under this assumption,
taking the magnitude from the first filter in which the object is detected (Y098M for ERS 8496, and
J125 for 1703 zD6), we calculate EWs of 69±10 and 65 ±12 ˚A, respectively. Because our objects
have additional coverage longward of the detection filter, we can also compute a value forβ, and extrapolate to find the continuum flux atλrest= 1216 ˚A. Using the formulae of Dunlop et al. (2012),
we findβ = -2.39±0.55, and -2.44±0.64. When computing EWs using this method, we obtain 67
±11 and 59±12 ˚A, respectively.
2.3
Analysis
Our approach in this paper is to compare the rate of occurrence of Lyαin our new 6.3 < z <8.8 sample with that expected from our reference sample of i′-drops with 5.5 < z < 6.3 drawn from Paper II (Figure 2.1). In both Papers I and II we showed that the rest-frame EW distribution is a function of rest-frame UV absolute magnitude, MUV, and thus we additionally take this luminosity
dependence into account. We estimate the luminosities of all our sources in Table 2.1 from their photometric redshift and incorporate the lensing magnificationµfor our lensed sources from Bradley et al. (2012b) for Abell 1703 and from the mass model of Richard et al. (2010) for MS0451-03 and Abell 2261. For our baseline Lyα EW distribution, we use the data from of Paper II at z ≃ 6, separated into high and low luminosity regimes.
II. We set the slope of the distribution within an EW bin equal to the slope between the two lowest bins in Paper II, 25 ˚A<EW<55 ˚A, and 55 ˚A<EW<85 ˚A. This slope is equal todp(EW)/dEW =−0.0030 for the lower luminosity sample (−20.25<MU V <−18.75), and −0.0017 for the higher
luminosity sample (−21.75 <MU V < −20.25). To create the probability distribution for galaxies
with EW less than 25 ˚A, we extrapolate to EW = 0 ˚A using this slope, and assign the remaining fraction of galaxies as non-emitters. In Papers I and II we also showed the fraction of emitters is a function of redshift, rising significantly for lower luminosity sources over 4< z < 6, most likely as a result of reduced dust extinction in the early Lyman break population. Therefore, as discussed in Paper II, we have also used a projected rest-frame EW distribution at z ≃ 7, assuming this evolutionary trend continues beyondz≃6.
Two key factors enter into the calculation of the visibility of line emission in a ground-based survey. Firstly, for any target with a particular photometric redshift likelihood functionp(z), it may be that the spectral region surveyed by LRIS or NIRSPEC does not completely cover the expected wavelength range where Lyαmight be present. Secondly, the EW limit for Lyαemission will be a highly non-uniform function of wavelength due to the mitigating effect of night sky emission. Provided the photometric redshift solution we derive is robust, we can estimate both factors and hence derive the likelihood of seeing Lyαfor each of our 26 sources, assuming the relevant wavelength range studied and the exposure time secured, if the particular source of a given MU V has a EW
distribution drawn from the sample with 5.5< z <6.3.
In the case of those sources for which the wavelength range searched does not fully sample the extended p(z), we reduce the detection likelihood by the fraction of the integrated p(z) that lies outside our search range. For each target, we determine its redshift probability functionp(z) using the photometric redshift code EAZY (Brammer et al. 2008). To determine the varying visibility function within our search range, we first estimate the the noise within an aperture encompassing the expected profile of the line, assuming an emission line width of 10 ˚A FWHM, which is typical of those detected in Paper II. Figure 2.3 illustrates the 5σ EW limit as a function of wavelength (and Lyα redshift) for most sources in our 12 hour LRIS exposure (6.3 < z < 7.2) and a typical source studied with NIRSPEC (6.8< z <8.2) during a 5 hour exposure. We note that although our survey spans a large range in redshift (6.3< z <8.8), thep(z) distributions for individual galaxies typically span a much smaller range. The average 1σredshift confidence interval for sources in our sample is only ∆z = 0.43.
Figure 2.3 Sensitivity limits to Lyαemission in our new Keck spectroscopic campaign: The panels show the 5σ limiting EW calculated for a typical source studied in our 12 hour multi-slit LRIS exposure (top) and an example 5 hour long slit NIRSPEC observation (bottom). The limits vary from source to source depending on the continuum brightness and the exposure times. An additional completeness correction is taken into account by adding and attempting to recover fake emission lines with fluxes equal to the 5σflux limit at the wavelength of insertion. See text and Paper II for more detailed discussion.
line emission in our actual spectra, again assuming a FWHM of 10 ˚A. As the absolute limits vary from source to source our Keck survey is not complete to a fixed EW limit but, provided the limits are well-understood for each source, we can readily estimate the probability of seeing Lyα in our exposures. In the case of the Fontana et al. (2010) FORS2 survey we estimated the night sky emission from our own LRIS exposures normalizing the limits from numerical data supplied in that paper.
The above simulations can be used to verify that our Keck survey is well-placed to search for Lyα emission. Out of the combined 26 targets from our survey and that of Fontana et al. (2010), 24 are covered spectroscopically over more than half the integrated probability of their photometric redshift distribution, and 17 are covered over 95% of the range. Additionally, we are able to determine the fraction of our spectra occulted by OH sky emission. For example, for a J=27 galaxy in one of our LRIS exposures, we are sensitive to lines with EW ≥30 ˚A over 70% of our usable spectral range (see Figure 2.3). Similarly, for a 5 hr NIRSPEC exposure of a J= 27 galaxy, we are sensitive to lines with EW>55 ˚A over 49% our spectral range.
Figure 2.4 The expected number of detected Lyα emission lines with greater than or equal to 5σ significance in the combined Keck and VLT survey of 26 sources. The blue histogram shows the likelihood function for 10,000 Monte Carlo realizations assuming the intrinsic line emission properties follow the luminosity dependence seen in our 5.5< z <6.3 i′-drop sample (Figure 2.1 (top)). The open histogram shows the expectation if the fraction of line emitters continues to increase with redshift at the rate described in Paper II. Vertical lines show the recovered number of emitters (robust and maximal including marginal detections in both the Keck and VLT surveys).
results reject the input EW distributions at the 99.3% level of significance (91.4% if the two marginal detections are included).
We can display the significance of this downturn with increasing redshift in the terms of the fraction of Lyαemission seen in Lyman break galaxies, X(Lyα), as in Paper I. The difficulty we face in creating such a figure is the non-uniform EW limit across the various targets in the Keck and VLT campaigns, in contrast to the more straightforward uniform search we undertook with DEIMOS at 4< z <6. To account for this, we assume a simple model in which Lyαemission is transmitted without IGM absorption for a fraction f of galaxies, while it is fully extinguished by the IGM for a fraction of galaxies (1-f). We assume that f = 1 at redshifts below 6, where the universe is believed to be highly ionized (Fan et al. 2006), and thatf is independent of the intrinsic EW of a Lyα emission line. We caution that an interpretation in terms of absolute values off is premature, as there is still some debate on whether the IGM is fully ionized at z ∼ 6 (Mesinger 2010), but emphasize that our value of f at z ∼ 7 is computed relative to the value assumed at z∼6. Additionally, with the increased fraction of emitters in ourz ∼6 sample from Paper II, we do not see any evidence for a decrease inf prior toz∼6, though we cannot rule it out.
It is important to note that ourf is differs fromfescLyα, commonly defined in the literature as the total escape fraction of Lyαphotons (e.g., Hayes et al. 2011). fescLyαrepresents the total transmission
downturn in the fraction of LBGs which show observable Lyαemission from the z = 6 (orz = 7) extrapolated EW distributions from Paper II, and represents an IGM extinction averaged over the entire population.
To compute the most likely value off, we undertake Monte Carlo simulations using the previously described EW distributions, but with f now added as a free parameter. We varyf from 0 to 1 in steps of 0.01, and compute N=1000 simulations for each step. We can then calculate the probability distribution forf given our Nobs=2 confirmed sources using Bayes’ theorem:
p(f|Nobs= 2) =
p(Nobs= 2|f)p(f)
∫1
0 p(Nobs= 2|f)df
(2.1)
Here, p(f) is the prior probability for f, which we take to be uniform for 0 ≤ f ≤ 1, and p(Nobs = 2|f) is the probability, drawn from our Monte Carlo simulations, that we would find
Nobs = 2 sources for a given value of f. Assuming that the intrinsic EW distribution for our
observed sources is that of Paper II at z = 6, we find f = 0.45±0.20, while using the z = 7 extrapolated distribution yieldsf = 0.34+0−0..2415. In the Figure 2.5, we plot the value of X(Lyα) in the same luminosity bins of Paper II, as predicted by our best fit values off.
We stress that this figure is intended to serve as a continuation of the visualization provided in Papers I and II, rather than a statistiscal result of our study. Due to our strongly varying limiting EW sensitivity (as a function of both wavelength and object magnitude), choosing a fixed EW limit will exclude a non-negligible fraction of useful data from our analysis. Our Monte Carlo simulations are able to utilize the full data set, simulating whether we would have likely seen a line even when our EW limits are above the fixed thresholds used in Figure 2.4, and thus represent the major statistical result of this study.
Using the models of McQuinn et al. (2007) to predict what global neutral hydrogen fraction, XHI
would be required to account for this decline, we find XHI≃0.44, and XHI≃0.51, respectively. The
models of Dijkstra et al. (2011), which provide a more comprehensive treatment of Lyα radiative transfer through outflows, result in an increased value for XHI in both cases.
2.4
Discussion
Figure 2.5 The redshift-dependent fraction of color-selected Lyman break galaxies that reveal Lyαin emission,X(Lyα), adjusted as discussed in the text to approximate one within a similar luminosity range with a rest-frame EW in excess of 25 ˚A. Data points for the galaxies with−21.75<MUV<
−20.25 are displaced by +0.1 in redshift for clarity. Data over 4< z <6 is from Paper I and Paper II, and new estimates beyondz >6.3 are derived from the present paper, including sources discussed by Fontana et al. (2010). The curves shown represent the aggregate redshift probability distributions for our sources in the z ≃ 6 bin (black), and the z ≃ 7 bin (blue); probability distributions for individual sources are typically much sharper.
EW distribution for 6.3< z <8.2. Although the uncertainties here are not as great, we plan further studies with DEIMOS to increase the statistical sample of 5.5< z < 6.3 LBGs.
Of course our observed decrease in the Lyα fraction could also be attributed to an increased opacity arising from dust within the LBGs. However, given the blue UV continuum slopes observed for galaxies withz >6.3 (Bouwens et al. 2010b; Dunlop et al. 2012), we consider this explanation unlikely.
Our diagnosis of a possible increase in the neutral hydrogen fraction beyondz≃6.3 is supported by the earlier study by Fontana et al. (2010). They found 1 marginal candidate out of 7 targets whereas we found 2 robust and 1 marginal cases out of our 19 targets spanning a larger luminosity and redshift range. Our conclusion is also supported by LAEs studies at z = 5.7 and 6.5 by Ouchi et al. (2010) and Kashikawa et al. (2011). Compared to z = 5.7, their LAE sample at z = 6.5 displays systematically lower EWs for Lyα. They also derive little evolution in the rest UV luminosity function for LAEs, but a decrease in the LyαLF, which could be explained by an increase in XHI. Our derived values of XHI are slightly higher than that of Kashikawa et al. (2011),
perhaps consistent with our survey probing to higher redshifts than theirz= 6.5 LAEs. Hayes et al. (2011) have recently compiled results from numerous Lyαand UV luminosity function studies to derive a volumetrically averaged Lyα escape fraction, and find very similar results. Their derived Lyαescape fraction steadily increases with redshift belowz= 6, then tentatively drops off at higher redshifts.
fraction (3/11) of LBGs that, by virtue of their selection using Subaru imaging, are more luminous (MUV<−21) than most of the objects considered here. Such a complementary campaign targeting
luminous LBGs selected from larger volumes will provide further insight into whether reionization is responsible for the declining fraction of line emission.
We note that our measured decrease in the fraction of LBGs with strong Lyαpotentially agrees with the result of Cowie et al. (2011). Although they argue against any evidence for reionization at z= 6.5, they find that∼24% of galaxies at this redshift show strong Lyαemission, comparable to the fraction we detect in this work, spread across a larger redshift range.
Chapter 3
The UV Luminosity Function of
Star-Forming Galaxies via Dropout
Selection at Redshifts z
∼
7 and 8
Abstract
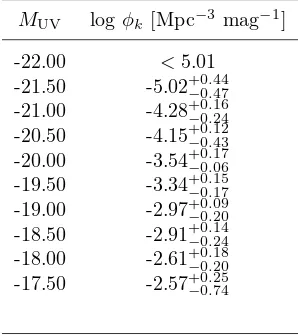
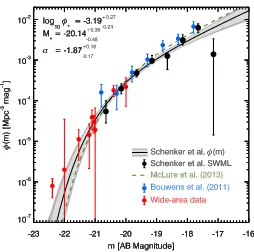
We present a catalog of high redshift star-forming galaxies selected to lie within the redshift range z ≃ 7-8 using the Ultra Deep Field 2012 (UDF12), the deepest near-infrared (near-IR) exposures yet taken with the Hubble Space Telescope. As a result of the increased near-infrared exposure time compared to previous HST imaging in this field, we probe ∼ 0.65 (0.25) mag fainter in absolute UV magnitude, at z ∼ 7 (8), which increases confidence in a measurement of the faint end slope of the galaxy luminosity function. Through a 0.7 mag deeper limit in the key F105W filter that encompasses or lies just longward of the Lyman break, we also achieve a much-refined color-color selection that balances high redshift completeness and a low expected contamination fraction. We improve the number of drop-out selected UDF sources to 47 atz∼7 and 27 atz∼8. Incorporating brighter archival and ground-based samples, we measure the z ≃ 7 UV luminosity function to an absolute magnitude limit of MUV =−17 and find a faint end Schechter slope of α=−1.87+0−0..1817.
3.1
Introduction
Great progress has been made in recent years in studies of the population of star-forming galaxies at redshifts z ≃ 7−8. Following installation of the infrared Wide Field Camera 3 (WFC3) on the Hubble Space Telescope (HST), the number of candidates has risen from a few (Bouwens et al. 2008) to ≃ 100 (McLure et al. 2010; Bouwens et al. 2010a; Oesch et al. 2010; Yan et al. 2010). In addition to providing hints of the early galaxy population to z ≃ 8, previous data sensitive to z∼7 galaxies have provided initial determinations of their rest-frame UV colors, stellar populations (McLure et al. 2011; Bouwens et al. 2012b; Dunlop et al. 2012), stellar masses and likely ages (Labb´e et al. 2010; Gonz´alez et al. 2010; McLure et al. 2011; Finkelstein et al. 2012b), and nebular emission line strengths (Labb´e et al. 2013). Our work builds upon these previous efforts to present the first drop-out selected samples and luminosity function determinations for redshift z ∼ 7 and z ∼ 8 sources from the 2012 Hubble Ultra Deep Field project (hereafter UDF12; GO 12498, PI: R. Ellis). Before UDF12, progress has naturally been greatest at redshift z ≃7 where synergy between ground- and space-based surveys has effectively exploited the full dynamic range of accessible galaxy luminosities. Early surveys from Subaru (Ouchi et al. 2009) and the ESO Very Large Telescope (Castellano et al. 2010) have probed the luminous component of the star-forming population over an area >1000 arcmin2. More recently, the UltraVISTA survey has covered 3600 arcmin2 in the
COSMOS field, locatingz≃7 galaxies toMUV=−22.7 (Bowler et al. 2012).
However, only HST can probe the important faint end of the galaxy luminosity function at these redshifts. An early result from the 2009 Hubble Ultra Deep Field campaign (GO 11563, PI: Illingworth, hereafter UDF09) was the discovery of an abundant population of sub-luminous galaxies at z ≃ 7 (Oesch et al. 2010; Bunker et al. 2010; McLure et al. 2010) corresponding to a Schechter faint end slopeαbetween -1.7 to -2.0. In such a distribution, the bulk of the integrated luminosity density arises from low luminosity galaxies that may be responsible to maintaining cosmic reionization (Robertson 2010b).
Clearly the luminosity function of star-forming galaxies at redshiftsz≃7-8 is of great importance. However, given the large range in luminosity that must be sampled, wider-field HST surveys have proved an important complement to panoramic ground-based surveys. WFC3 data from the GOODS Early Release Science (ERS) (Windhorst et al. 2011), and CANDELS fields (Grogin et al. 2011; Koekemoer et al. 2011) have sampled intermediate luminosities−21.MUV.−19. The HIPPIES
and BoRG pure parallel surveys have provided additional candidates at z ∼ 8 (Yan et al. 2011; Trenti et al. 2011; Bradley et al. 2012a).
αz∼7=−2.01±0.21 (Bouwens et al. 2011) incorporating the UDF, parallel fields, and the ERS data,
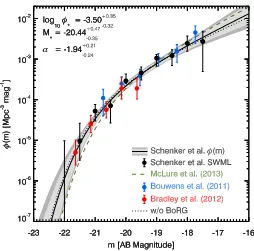
a competing determination utilizing the size-luminosity relation measured from the UDF09 data and the CANDELS Deep+Wide surveys in three fields finds a shallower faint-end slope of αz∼7=
−1.7±0.1 (Grazian et al. 2012). The luminosity function at z ≃8 is even more uncertain, both because of the limited depth of the necessary photometry (Dunlop et al. 2012) and the possibility of co