On the Structuring of Discussion Transcripts
Based on Utterances Automatically
Classified
A.T. Verbree
Master of Science Thesis
Computer Science
Research Group Human Media Interaction
Faculty of Computer Science
University of Twente
Enschede, The Netherlands
Graduation committee
Dr. ir. H.J.A. op den Akker
Dr. D.K.J. Heylen
Ir. R.J. Rienks (first supervisor)
Summary
This report describes the development of a method of creating argument diagrams of discussions. An argument structure called the Twente Argumenta Schema (TAS) is described together with a corpus of argument diagrams of discussions. Methods are presented to extract values out of several characteristics of utterances in discussions, most of them concerning combinations of words and part of speech tags. Using these values experiments are performed on the classification of utterances in discussions ac-cording to TAS. We present several classification results, using as well different values for parameters as different features. Our best performance of 78.52% is a nice im-provement over the baseline of classifying utterances according to TAS. Still many improvements can be made, especially in the selection of the right word combinations as characteristics of a class of arguments.
Our work has its focus on the classification of utterances in discussions according to TAS, but we also present an approach on the identification and classification of the relations between utterances.
Samenvatting (Summary in
Dutch)
Dit verslag beschrijft de ontwikkeling van een methode om vanuit discussies argu-mentatie diagrammen te cre¨eeren. Een arguargu-mentatie structuur genaamd het Twente Argumentatie Schema (TAS) is beschreven tezamen met een corpus van argumentatie diagrammen van discussies. Methodes om waarden te verkrijgen uit de verschillende karakteristieken van een uiting in discussies, waarvan de meeste aangaande combi-naties van woorden van woordsoorten, worden gepresenteerd. Gebruik maken van deze eigenschap-waarden zijn experimenten uitgevoerd om uitingen in discussies te kunnen classificeren naar TAS. We presenteren classificatieresultaten door verschillende waar-den te geven aan parameters alsmede door gebruik te maken van verschillende eigen-schappen van uitingen. Ons beste resultaat van 78.52% is een aardige verbetering over de‘baseline’van het classificeren van uitingen op basis van TAS. Desalniettemin kun-nen er nog veel verbeteringen aangebracht worden, met name betreffende de selectie van de juist woord combinaties als karakteristieken voor een klasse van argumenten.
Ons werk heeft zich gefocused op de classificatie van uitingen in discussies gebruik makend van TAS, maar we presetenreren ook reeds een benadering om relaties tussen uitingen te identificeren en te classificeren.
Preface
(Dutch:)
’Ik heb een uitnodiging gehad voor een congres,’ vertelde hij toen ze aan tafel zaten. ’Alweer?’ vroeg ze
’Alweer?’ - haar reactie irriteerde hem. ’Ik krijg bijna nooit een uitnodiging.’
’En je bent net naar een congres geweest!’ - haar stem was verontwaardigd. ’Je doet niet anders meer als naar congressen gaan! Je lijkt Beerta wel.’
Hij dwong zichzelf tot kalmte. ’Dat was drie jaar geleden.’ ’Twee jaar!’
’Drie jaar!’ ’Twee jaar!’
In ieder geval heeft dat er niets mee te maken. Dit is een heel ander congres.’ ’Wat is het dan voor congres?’
’Dit is een feestcongres.’
’Een feestcongres?’ - haar stem ging omhoog van verontwaardiging, ’Maar daar hoef je toch zeker niet naar toe? Wat is dat, een feestcongres?’
’De Belgische Commissie bestaat vijfentwintig jaar.’
’En moet jij daar naar toe? Daar heb je toch zeker niets mee te maken? Je lacht toch zeker om zulke onzin? Toen jullie vijfentwintig jaar bestonden hebben jullie toch ook geen feestcongres gegeven?’
’Nee,’ gaf hij toe.
(English:)
’I’ve had an invitation for a congress,’ he told when they sat at the table. ’Again?’ she asked
’Again?’ - her reaction irritated him. ’I hardly ever get an invitation.’
’And you’ve just been to a congress!’ - her voice was incensed. ’All you do is going to congresses! You seem like Beerta.’
He forced himself to stay calm.’That was three years ago.’ ’Two years!’
’Three years!’ ’Two years!’
’Anyway it doesn’t have anything to do with this. This is a complete different congress.’ ’So, what kind of congress is it then?’
’It is a celebration-congress.’
’A celebration-congress?’ - her voice rose of incense, ’but you don’t have to go there do you? What is it, a celebration-congress?’
’The Belgium committee exists for twenty five years.’
you didn’t organize a celebration-congress, did you?’ ’No,’ he admitted.
‘Het bureau’ (The Bureau), by J.J. Voskuil.
By finishing my master of science thesis I can look back on seven years of study in computer science. Although there almost always seemed to be even more interesting things than computer science I now have to admit that I enjoyed studying it, especially the last years of it.
At first, when I started my project on discovering meeting structures I had big ideas like implementing and using it in meetings of the VGST, the christian student association I’m involved in. I hoped to make each meeting a meeting of celebration, a party by it self. But the further I came in the project and the more time I spend I discovered that once again I was a little naive. Not only does science invent the future, but also does it need the future to keep inventing things: good research takes a lot of time.
Having spend 12 months on this project I am thankful to a lot of people who kept me motivated by asking the right questions or by refraining from asking questions at the right time. Just as explaining my project to others kept me motivated getting better performances and thus developing a better classifying system, not talking about my project but turning my mind to other things helped me to start (almost) each day with a happy feeling: so much to discover and do today!
Thanks to Rutger, my first supervisor who checked on me regularly and who showed himself to be very involved in my work. Thanks as well to my other two supervisors: Rieks and Dirk who helped me with their comments and gave me interesting insights and tips. But not only my supervisors need to be thanked, a lot of other people who were interested in my project as well, such as my parents, other family and friends. Special thanks to my (former) flatmates: Rudolf, Werner, Jan-Maarten and Niek always were great motivators, although sometimes the evenings were too much fun, so I had to start later the day after.
Having thanked so many people I want to thank Ellis in special. Every time when I spoke about my project she listened, whether I was positive or not, she always was willing to help me. By giving me feedback and support but even more important the right distraction she kept me motivated for finishing my masters.
Contents
1 Introduction 2
1.1 Introduction . . . 2
2 TAS 4 2.1 Introduction . . . 4
2.2 Annotation . . . 4
2.2.1 The Node Labels . . . 5
2.2.2 The Relation Labels . . . 6
2.2.3 The Structure . . . 7
2.3 Agreement . . . 9
2.3.1 Reproducibility . . . 9
2.3.2 Internal Consistency . . . 10
2.3.3 Learnability . . . 10
2.3.4 Agreement in Segments, Nodes and Relations . . . 10
2.3.5 κ-measure . . . 13
3 Features 16 3.1 Sentence Length . . . 17
3.2 ? and ‘OR’ . . . 17
3.3 Last Label . . . 18
3.4 Ngram Points . . . 20
3.5 POS Ngram Points . . . 21
4 Classification 24 4.1 Balanced and Unbalanced . . . 24
4.2 Ngram Selection Methods . . . 25
4.2.1 Normalizing Ngram-Values . . . 25
4.2.2 Select1/3Normalized . . . 26
4.2.3 DROPn . . . 27
4.2.4 TOPx . . . 27
4.3 Compressed or Individual . . . 28
4.4 The Order of Ngrams . . . 28
5 Classifiers 29 5.1 J48 . . . 29
5.2 DecisionTable . . . 30
5.3 MultilayerPerceptron . . . 32
6 Results 35
6.1 Baseline . . . 35
6.2 Unbalanced-Unbalanced . . . 36
6.2.1 Ngrams of Words vs. Ngrams of POS-tags . . . 38
6.2.2 Combinations of Ngrams of Words and POS-tags . . . 38
6.2.3 Ngram Based Features vs. Non-Ngram Based Features . . . . 38
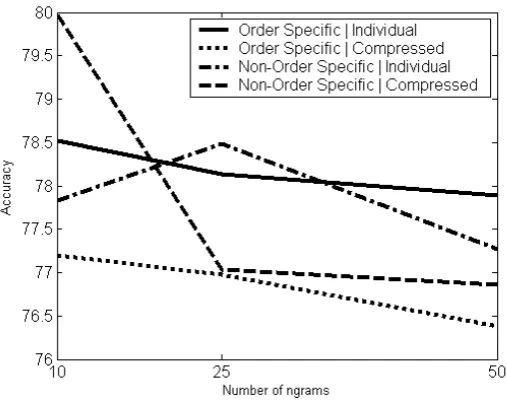
6.2.4 Summed vs. Individual . . . 39
6.2.5 Order-specific of Ngrams vs. Non-Order Specific Ngrams . . 39
6.2.6 Number of Ngrams to Select . . . 39
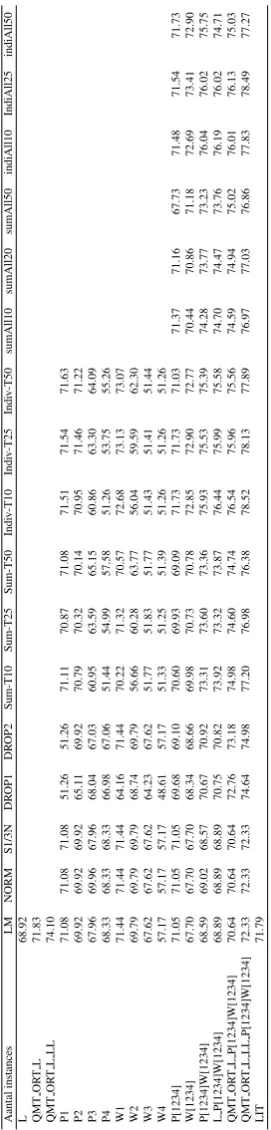
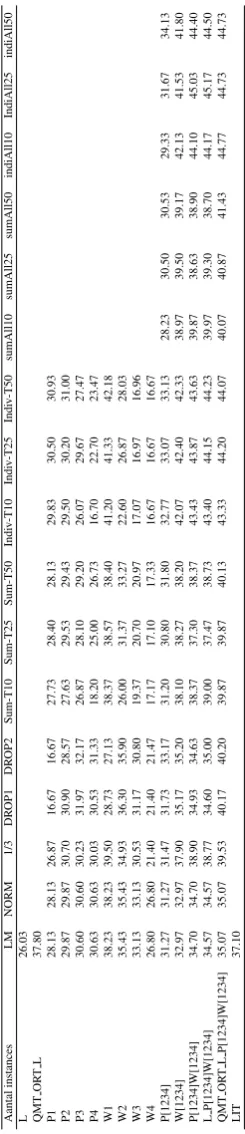
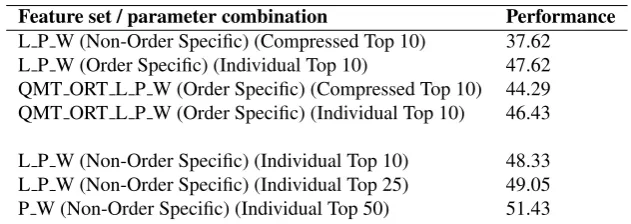
6.2.7 Most Interesting Results . . . 40
6.3 Unbalanced Training - Balanced Testing . . . 41
6.3.1 TheLengthFeature . . . 43
6.3.2 Number of Ngrams to Select . . . 43
6.4 Balanced Training - Balanced Testing . . . 43
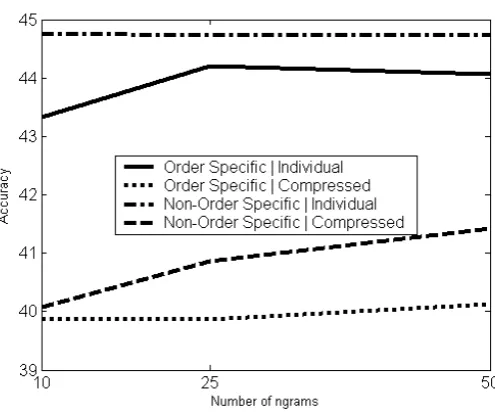
6.4.1 Balanced vs. Unbalanced Training . . . 44
6.5 Virtualκ-measure . . . 47
7 Identification and Classification of Relations 49 7.1 Our Approach . . . 49
7.2 Identifying Relations . . . 49
7.2.1 Non-Conditional Chance . . . 50
7.2.2 Conditional Chance . . . 50
7.2.3 Starttime Difference . . . 50
7.2.4 Speaker . . . 51
7.2.5 Ngram Combinations . . . 51
7.2.6 POS Ngram Combinations . . . 52
7.3 Classifying Relations . . . 52
8 Dialogue Act Tagging 53 8.1 Introduction . . . 53
8.2 Features Used in Previous Work . . . 54
8.3 ICSI Meeting Corpus . . . 56
8.4 Switchboard Corpus . . . 57
8.5 AMI Corpus . . . 62
8.5.1 Automatic Speech Recognition . . . 63
9 Conclusion and Recommendations 66 9.1 Conclusion . . . 66
9.1.1 Automatically Acquisition of Cues . . . 66
9.1.2 Compact Feature Set . . . 67
9.1.3 Dialog Act Tagging . . . 67
9.2 Recommendations . . . 67
9.2.1 Revision of the Corpus . . . 68
9.2.2 Classifying Nodes and Relations at the Same Time . . . 68
9.2.3 Other Classifiers . . . 68
9.2.4 Assess Other Ngram-Selecting Methods . . . 68
9.2.5 Ngram Points to Attribute . . . 69
9.2.6 Selecting Cue Ngrams Regardless of Their Type . . . 70
9.2.7 Punctuation Features . . . 70
9.3 Final Thoughts . . . 70
A 71
A.1 Unit Labels . . . 71
A.2 Relation Labels . . . 72
Chapter 1
Introduction
1.1
Introduction
Nowadays having a job almost means having to do with a lot of meetings. In all these meetings about everything can be discussed: From how much cups of coffee should be compensated for by the employer to the introduction of a new coffee machine. But meeting time is not only spend during the meeting, it is spend between meetings as well: Minutes have to be made and read and action items have to be distilled from them.
These ongoing meetings have been a point of interest to many researchers. Psy-chologists like to know what people experience in meetings and why they act like they do, physiotherapists might be interested in the posture of persons attending a meeting and computer scientists are interested in the way they might aid a meeting to improve efficacy. An example of the last is in the work of Ellis et al. [2001] which researches the possibilities of the use of computer agents in meetings. Three different sorts of agents are presented: information, social and organizational agents. Information agents might help in gathering and presenting information to all the participants, social agents might keep track of the time a meeting takes and propose coffee breaks at the right time and finally organizational agents could remind all participants of approaching deadlines, summing up all action items and making the minutes instantly available.
Another example of ongoing research in meetings is a European project called Aug-mented Multi-party Interaction (AMI) which has started a few years ago, researching new technologies to support human interaction, in the context of smart meeting rooms and remote meeting assistants. Just as in Ellis’ work these remote meeting assistants could assist in taking meeting minutes or signal the chairman when a participant tends to get too dominant.
Both of these project realize that perhaps one of the most time consuming activities involving meetings is (except from the meeting it self) taking minutes and analyzing them for action points and other points of (personal) interest.
than other participants and therefore a virtual chairman as described by Rienks et al. [2005b] could be an interesting meeting assistant.
To construct a virtual chairman which is able to lead a meeting all by itself, giving turns, keeping track of a time-line and most important: keeping the meeting as effective and efficient as possible a lot of research is needed. A virtual chairman should not only
be aware of thestateof the participants as their dominance level, which is researched
in [Rienks et al., 2005a, Rienks and Heylen, 2006], but a trustworthy representation of the meeting might even be more important.
The point where this trustworthy representation of a meeting meets the minute making
and analyzing as described above is in our project. Our work concerns theautomatic
constructing of argument diagrams of discussions. Not only can these diagrams be used to represent meetings in a computational way, but arguments diagrams themselves also represent a discussion in such a way that it leads to quicker cognitive comprehension, deeper understanding and enhanced detection of weaknesses [Schum and Martin, 1982, Kanselaar et al., 2003]. Furthermore they are said to aid the decision making process, and can be used as an interface for communication to maintain focus, prevent redundant information and to save time [Yoshimi, 2004, Veerman, 2000].
In our work we have focused on the research and development of models of ut-terances in order to classify utut-terances according to the models developed. A model of such an utterance is a list of its’ features and the values for these features. An example a model of an utterance is the length, measured in the number of words
Length(U tterance) = 7. The models and methods developed have been applied in the classification of utterances in AMI discussions, classified according to the Twente Argument Schema (TAS). But not only have these methods been applied to classify ut-terances according to TAS, they have also been evaluated on other annotated corpora, such as the ICSI meeting corpus, thus being able to compare our models and methods to earlier performances in the accuracy of the classification as described in the litera-ture. Not only is TAS used to classify utterances, but as well binary relations between nodes. We present an approach to this identification and classification
Chapter 2
TAS
2.1
Introduction
Our work concerns automatic creating of argument diagrams of discussions or to phras-ing it a bit different: The learnability of structurphras-ing discussions accordphras-ing to the Twente Argument Schema (TAS), which has been developed at the University of Twente [Wei-jden, 2005]. TAS has been developed while working on the creation of a new corpus, called the AMI Hub Corpus. The AMI Hub Corpus contains a total of 80 meetings into 20 series of 4 meetings. These meetings have been recorded at the University of Edinburgh (United Kingdom), the IDIAP research Institute (Switzerland) and at TNO (the Netherlands) [Carletta et al., 2005]. For these meetings video, sound and transcrip-tions are available. The corpus is still under development and several annotation layers as Dialog Acts, gestures, focus of attention and topic information are being created. Transcriptions were created for all the meetings in the AMI corpus, following strict annotation guidelines [Moore et al., 2005]. For our research we will only make use of these transcriptions of the HUB corpus. This chapter will give a short introduction to TAS, annotating using TAS and agreement amongst annotators.
2.2
Annotation
TAS is not the only scheme available for structuring argumentative texts, several other argument structure methods have been developed before. Weijden [2005] reports on a research of argument structure methods as Rhetorical Structure Theory (RST), Toulmin and Issue-Based Information Systems (IBIS). Although each of the structure methods has there own advantages, none of them seems to be fit to structure the discussions and argumentation found in a meeting. This analysis resulted in the development of the Twente Argument Schema, which is partly based on other argument structures.
can be found in A. An example of a generated scheme by applying TAS is presented in figure 2.1.
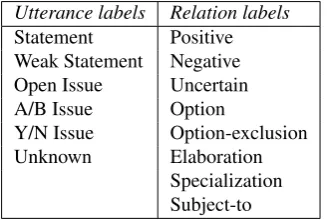
Utterance labels Relation labels
Statement Positive
Weak Statement Negative
Open Issue Uncertain
A/B Issue Option
Y/N Issue Option-exclusion
Unknown Elaboration
Specialization Subject-to
Table 2.1: Labels for utterances and relations in TAS
Figure 2.1: TAS diagram example
2.2.1
The Node Labels
In line with Galley et al. [2004] backchannel utterances such as “uhhuh” and “okay” are filtered out and to be neglected, since they are generally used by listeners to indicate they are following along, and not necessarily indicating (dis)agreement. These
utter-ances are classified asunknownbut are not shown in diagrams since they do not add
any information. The nodes in our argument diagrams consist of issues and statements. In the Twente Argument Schema three different labels for nodes to represent issues
have been defined: Theopen issue, thea/b issueand theyes/no issue. Theopen issue
contrast with thea/b issue, that allows participants to take a position for a countable number of positions which should be known from the context (c.f. “Would you say
ants, cats or cows?”). Theyes/no issue, in line with the yes-no question in IBIS [Kunz
and Rittel, 1970] directly requests whether the participants positions agree or disagree with the issue (c.f.“Do we need an LCD display ?”).
Participants’ positions are generally conveyed through the assertion of astatement.
The content of astatementalways contains a proposition in which a certain property or
quality is ascribed to a person or thing. A proposition can be a description of facts or events, a prediction, a judgement, or an advice [Van Eemeren et al., 2002] (c.f. “Okay , so fifteen to thirty five , look fairly young . You know , they have bit of expendable income to spend on this sort of thing .”) . Statements can vary in the degree of force and scope. It can happen that meeting participants make remarks that indicate that they are not sure if what they say is actually true. Toulmin [1958] uses a qualifier in his model to say something about the force of what he calls ‘claim’. When this qualifier is introduced, it is possible that the assertion is made with less force. As Eemeren [2003] points out that the force of an argument can also be derived from lexical cues such as by expressing the words ‘likely’ and ‘probably’. To be able to represent this we introduce
the label‘weak statement’(c.f. “Um I guess that’s up to us , I mean you probably want
some kind of unique selling point of it , so um , you know”).
2.2.2
The Relation Labels
Relations can only exist between nodes. For this we have defined a number of relations that can exist between the labelled nodes. When engaged in a discussion or debate, the elimination of misunderstandings is a prerequisite in order to understand each other and hence to proceed [Neass, 1966]. Participants in a discussion, according to Neass, eliminate misunderstandings by clarifying, or specifying their statements. These moves can e.g. be observed in the criteria definition phase, of the decision making process.
For ayes/no-issuethe contributions that can be made are not related to enlarge or
to reduce the solution space, but to reveal one’s opinion to the particular solution or option at hand. In a conversation people can have a positive, negative or neutral stance
regarding statements or Y/N-issues. For this purpose the labels‘Positive’,‘Negative’
and‘Uncertain’are introduced. With the aim to reveal whether contributions from
participants are either supportive, objective, or unclear. Thepositiverelation can exist
for example between ayes/no issueand astatementthat is a positive response to the
is-sue or between twostatementsagreeing with each other. When one speaker states that
cows can be eliminated as being the most intelligent animals and the response from another participant is that cows don’t look very intelligent, then the relation between
thesestatementsispositive. Thenegativerelation is logically the opposite of the
pos-itiverelation. It is to be applied in situations where speakers disagree with each other
or when they provide a conflictingstatementas a response to a previousstatementor a
negativeresponse to ayes/no issue. In a case where it is not clear whether a contribu-tion is positive or negative, but that there exists some doubt on the truth value of what
the first speaker said, one should use theuncertainrelation. From experience with the
annotations it appears that in most cases it can easily be seen by the annotator whether the remark is mostly agreeing or mostly showing doubt.
ant or a cow the most intelligent animal?’ which again can be specialized if one for instance asks ’Are ants the most intelligent animal?’. For these occasions we introduce
the label‘Specialization’. Thespecializationlabel can for instance be applied when
a particular issue generalizes or specializes another issue. It could on the other hand also very well happen that a person is not yet satisfied with the information or the argument explained. This person can explicitly invite the previous speaker to elaborate
on his earlierstatements. For these situations we define the relations‘Request’in case
someone asks for more information and the relation‘Elaboration’if a person continues
his previous line of thought and adds new information to it.
Whenever the issue is defined, an exchange of ideas about the possible answers or
possible solution naturally occurs in the decision making process. Whenever a
state-mentis made as a response to anopen-issueor ana/b-issueit might reveal something
about the position of a participant in the solution space. In general he provides an
‘Op-tion’to settle the issue at hand. For example when a speaker asks ‘Which animal is the
most intelligent?’ and the response from someone else is ‘I think it’s an ant’ theoption
relation is to be applied. The opposite of theoptionrelation is the‘Option-exclusion’
relation, and it is to be used whenever a contribution excludes a single option from the solution space.
The final relation of our set is to be applied when the content of a particular con-tribution is required to be able to figure out whether another concon-tribution can be true
or not. We named this theSubject torelation, which is somehow related to the
con-cession relation in Toulmin’s model. It is to be applied for example in the situation where someone states that ‘If you leave something in the kitchen, you’re less likely to find a cow’ and the response is ‘That depends if the cow is very hungry’. So the second contribution creates a prerequisite that has to be known before the first contribution can
be evaluated. If the cow is very hungry the support could be eitherpositiveornegative.
Theuncertainlabel is not to be applied it this case, as the stance of the person in
ques-tion is clear once the prerequisite is filled in. Theuncertainlabel is merely to be used
when an issue is preceded by a request or a specialization.
2.2.3
The Structure
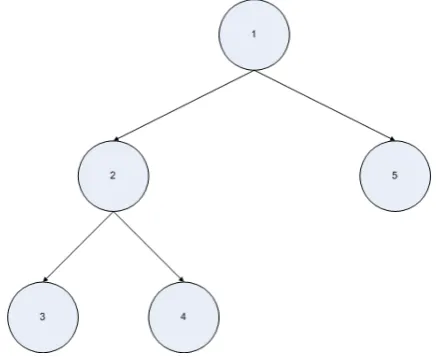
TAS was constructed in a way that it preserves the conversational flow. TAS aims to keep as much chronology information of a discussion available in the argument diagram. By applying a left-to-right, depth first search, walk through on the resulting trees, the reader is able to read the resulting trees as if reading transcripts [Rienks and Verbree, 2006]. This is realized by assuring that in principle every contribution of a participant becomes a child of the previous contribution, unless the current contribution relates more strongly to an ancestor of the previous contribution. If a contribution is more strongly related to an ancestor of the previous contribution then it is to the previous contribution it self, the branch containing the previous contribution is ‘closed’ and contributions that follow can not be ‘added’ to it anymore.
relation between node 1 and 5, thus closing the branch containing node 2, 3 and 4. If we would encounter a new node, node 6, we would only be allowed to relate it to node 5 or 1.In this way the reader still is able to read the tree as if reading a transcript.
An example of such a situation in which we deviate from the principle of relating an utterance to the previous one we find in figure 2.1. The utterance of P3: “And solar cells , I dunno about that .” is uttered right after the phrase “Yeah , I don’t think it would” as well by P3. Still they are not related because the first utterance relates much stronger to the issue which started the discussion: “three different types of batteries . Um can either use a hand dynamo , or the kinetic type ones , you know that they use in watches , or else uh a solar powered one .” P3 makes it clear that he now focuses his opinion on solar cells instead of the “kinetic type” mentioned before.
Figure 2.2: Example of a diagram with closed branches
To annotate the HUB corpus we have manually selected all discussions out of each meeting, thus creating a corpus of 241 discussions. Three annotators annotated this corpus of discussions resulting in a total of 8281 nodes and 4889 relations. The outline of the nodes in our corpus is shown in table 2.2, where the outline of the relations is shown in table2.4. Furthermore table 2.3 shows the differentiation of the relations over the source and target nodes.
Number of utterances Label
4245 Statement
199 Weak Statement
244 Open Issue
72 A/B Issue
460 Yes/No Issue
3061 Unknown
8281 Total
Source / Target Open Issue A/B Issue Yes/No Issue Statement Weak Statement Total
Open Issue 29 12 41 305 26 413
A/B Issue 2 0 10 86 6 104
Yes/No Issue 24 5 54 600 46 729
Statement 86 28 201 2347 77 2739
Weak Statement 4 2 12 180 19 217
Total 145 47 318 3518 174 4202
Table 2.3: An overview of the relations between different types of nodes identified in the HUB Corpus
Number of relations Label
2028 Positive
408 Negative
218 Uncertain
490 Option
14 Option Exclusion
580 Elaboration
111 Specialization
183 Request
170 Subject To
4202 Total
Table 2.4: An overview of the relations identified in the HUB Corpus
2.3
Agreement
Most annotated corpora are (like the HUB corpus) annotated by several annotators. To measure the agreement amongst annotators mostly a few annotators the same part of the corpus. Measuring the agreement in annotations can be done because of three
reasons: Measuring 1) reproducibility, 2) internal consistencyor3) learnability.
2.3.1
Reproducibility
Almost every annotation scheme is designed to be applicable to several corpora and to be used by different annotators. In these cases an annotation manual is developed to guarantee that annotators who have not been involved in the developing of the anno-tation scheme still would be able to apply the annoanno-tations correctly. Measuring agree-ment in cases as these gives insight in the interpretation of the annotation rules in prac-tice. A high agreement signals that in when annotating other corpora the annotation will not highly depend on the choice of annotators.
2.3.2
Internal Consistency
The reproducibility of an annotation scheme might be a step beyond internal consis-tency. An internal consistent annotation of a corpus claims that an annotation is not influenced by an annotator, its mood or the amount of sleep he had the night before, but only by the data he/she has to annotate. A scheme is internal consistent if different annotators produce the same annotation of a discussion, regardless the condition they are in.
The internal consistency of the annotations have been important to us, because a high agreement would tell us that all annotations have been made ‘the same’, indepen-dent of the annotator. A low internal consistency could indicate a difference of opinion in the use of the annotation scheme and would in any case indicate that the lesser value of our annotations.
2.3.3
Learnability
A third concern involving agreement is the learnability of an annotation scheme. An-notating corpora is a time-expensive job and therefore computer annotators are highly
welcome. Learnability is about the possibility of a system tolearnto annotate using the
specific scheme. As mentioned before a low agreement indicates a low internal con-sistency: annotators’ interpretations of the rules described in the annotation scheme differ or other non-relevant circumstances (e.g. the personal situation of the annotator) have influenced the annotations resulting in inferior annotations. With such a possible low agreement between annotators or inferior annotations we can not expect a system, which is trained using the annotations made, to score a high performance on annotat-ing. Measuring agreement can thus show what could be expected from a computer annotator at most, just as a baseline is used to define what performance at least could be expected.
Since our work concerns the learnability of classification of nodes in order to struc-ture discussions the learnability of TAS is of great importance. This has been our biggest concern in measuring agreement.
2.3.4
Agreement in Segments, Nodes and Relations
The annotation of the HUB corpus have been done by three annotators. To measure the agreement amongst the annotators a subset of 12 discussions was chosen to be annotated by two annotators. The annotations of these discussions were used to give an estimate of the measure of agreement over all annotations.
There are several methods, with different goals for measuring agreement between
annotators as theκ-measure by Cohen [Cohen, 1960]. Thisκ-measure can be used to
measure the agreement when classifying distinct occurrences in distinct classes. The
κ-measure and its results for TAS are described in section 2.3.5. Since our annotations
concerned not only identifying the type of an utterance, but the utterance it self as well
we have used a long side theκ-measure a different measure as well. This will be
dis-cussed in this section.
Our annotations concern“the identification of a segment, labeling it with a type to
• A segment is a part of the discussion which is labeled as a coherent set of words. So each discussion consists of a few to a lot segments.
• A node is a segment with a label (statement, weak statement, etc.).
• A relation is a ’line’ which can be drawn between two nodes. Each relation has
a label (positive, negative, etc.) as well.
The HUB corpus as we have annotated it consists of literal transcriptions of the dis-cussions which are being represented chronologically. Because we are dealing with discussion selected from multiparty meetings this means that occasionally two or even more people speak at the same time. This means that (because of the chronological or-dering of the transcription) one speaker turn (in the transcription) is being interrupted by someone else’s speaker turn. This makes it hard to always stick to our terminology,
therefore in this report report the wordssegment,nodeandutterancewill all be used
and will mean more or less the same, unless the context makes it clear that there is a
difference in the meaning. Most of the times anutteranceis the same as asegmentboth
identifying the text available in aspeaker turn. The main difference between asegment
orutteranceand anodeis the label which is included in anodeand not in the other two.
In figure 2.3 three different segments structures are displayed. The upper structure displays just one segment. The middle structure displays three different segments. The lower structure displays a segment which is being interrupted by another segment. An example of a transcription having such a structure can be found in table 2.5.
Figure 2.3: Three different segment structures
Because of the possible interruption of segments which can be at many places we
have decided not to calculate theκ-measure over segments, but to calculate the
agree-ment in‘segment starts’, which is based on the NIST-SU Metric [Ang et al., 2005]. To
achieve this we have listed all the starttimes of the segments and compared these two lists (for each annotator one). In figure 2.4 two annotations are visualized. The first annotator annotated three segments, where the second annotator annotated two. This results in the equal number of starttimes for each annotator. The agreement is then calculated by computing the percentage of agreed segments on all identified segments.
In this example the agreement would be 1+12+1 ×100% = 66.6%In the same way the
agreement in nodes and relations is computed. The tables 2.6, 2.7, 2.8 and 2.9 show
these agreements in segments, nodes and relations. These tables show us that the
P1: there’s there’s a em emerging market for sort of touch screen L C D remotes that can be uh programmed in m much more sophisticated ways than sort of conventional models , so you get the sort of you get um you [other] you can redesign the interface to your own needs , you can programme in macros , and you get a much greater degree um um I mean you get in these sort of [other] three in one , five in one , whatevers , but you can get integration between the different uh the the the diff the different things that it’s designed to control , to a much greater extent , and you can have one uh you know one macro to turn the uh you know turn the T V to the right channel , get the uh re uh rewind the tape in the V C R and get it to play once it’s rewound , for instance
P0: Okay .
P1: . Um b it occurs to me there might be a niche for uh for a remote that aimed towards some of that sort of functionality but using a just conventional push button design . And therefore putting it into a um well much lower price bracket .
Table 2.5: Example of interrupted segment
Figure 2.4: Two segment annotations
problem. If we for instance would find the utterances‘So, that’s my idea.’and‘I truly
think that the idea is pretty bad, just look at the colors. And apart from that, I believe we should come up with a better shape than a banana.’, we might identify the first
utterance asstatement. The second utterance seems to be multi-interpretable, it might
be classified as onestatementhaving anegativerelation to the first utterances, or as
twostatementsboth having anegativerelation to the first utterance. In both cases TAS would be applied correctly, although the second approach would be preferable. But this example does show that the number of segments identified does not significantly have to influence the representation. Still one should note that it is very well possible to end up with several diagrams from one discussion as there are likely to be more than one possible interpretation. Walton [1996] for instance showed that various different argu-ment diagrams can be instantiated by one single text. Moreover, in Rhetorical Structure Theory (RST) [Mann and Thompson, 1987], which is perhaps one of the theories clos-est to TAS, suggclos-est that the analyst should make plausibility judgements rather than absolute analytical decisions, implicating more than one reasonable analysis.
Furthermore we can conclude that the agreement in the assigned types is over 70%, which seems to be a reasonable score. A further analysis of the difference of opinions on the resulting nodes is discussed in section 2.3.5.
Annotator 1 531 segments
Annotator 2 622 segments
Agreement in starts of segments 71.47% (412 starts)
Agreement in start en ends of segments 56.46% (315 segments)
Table 2.6: Agreement in segments
Annotator 1 531 nodes
Annotator 2 622 nodes
Agreement 38.68% (223 nodes)
Table 2.7: Agreement in nodes (same segment, same label) - comparison 1
2.3.5
κ
-measure
As mentioned before, theκ-measure can be used when one wants to measure the
agree-ment in classifications of distinct occurrences in distinct classes.κsimply is“the
pro-portion of agreement corrected for chance”[Cohen, 1960].
Cohen has not only introduced theκ-measure, but the weightedκ-measure as well.
This weightedκ-measure can be used when the classes aren’t ordinal. This means that
class A looks more alikeclass B than it looks alikeclass C. Though this is this the
case in our project (aweak statementis more like astatementthen anopen issue) we
didn’t compute this weightedκ-measure, since we are not in any way able to define
or compute the distance between two classes. Still we are able to use theunweighted
κ-measure over the classification of nodes. To do this we first generated a
diffusion-matrix out of the discussions which were annotated by different annotators to measure the agreement. A diffusion-matrix as we use it shows the classification of the same segment by two different annotators. We do not speak of a confusion-matrix because we can not take one annotators work as a standard. In this diffusion-matrix depicted in table 2.10 all the segments that were recognized by both the annotators were used. This means that some piece of text was recognized as a segment, still the annotators could disagree on the label of the segment (which makes it a node).
This diffusion-matrix shows us that there is a large disagreement in classifying
nodes which could be of the typeunknownas well as the typestatement. This mostly
is caused by phrases which can be interpreted as backchannels or as an agreement,
such as‘Yeah’. Because of the fact that our annotations were done on the transcripts a
lot of additional information, particularly phonetic cues as prosody are left out. Theκ
-measure for the annotations according to this diffusion-matrix is 0.4977, which is pretty
bad. Therefore we have calculated theκ-measure for three other diffusion-matrices as
well. Since the most disagreement was found in labeling phrases which could be inter-preted as well as backchannels as agreements, and this had a great influence because
of our small data set we decided to calculate alternateκ-values as well. This was not
just done because it would benefit our results, but because of the fact that this
disagree-ment shows us that our rules on how to annotate phrases as‘Yeah’were not sufficient:
New agreements need to be made on the classification of such ambiguous utterances. Therefore we could eliminate this problem in three ways:
Annotator 1 531 segments
Annotator 2 622 segments
Matching segments 315
Matching nodes 70,79%
Table 2.8: Agreement in nodes (same segment, same label) - comparison 2 - (223 out of 315 identified segments with the same start- and endtime are labeled the same)
Annotator 1 203 relations
Annotator 2 313 relations
Agreement in start and end nodes 8,91% (23 relations)
Agreement in start and end nodes and label 2,52% (13 relations)
Agreement in labelifagreement on start and end nodes 56.52%
Table 2.9: Agreement in relations
should have been made.
2. Classify the label according to the judgement of Annotator 2: Let’s say that Annotator 2 his opinion about this phrases is according to the agreements that should have been made.
3. Delete all the segments which were labeled as Statement by Annotator 1 and as Unknown by Annotator 2: Because of the disagreement on how to label such phrases (not the actual labeling it self) it is better just to eliminate them from our matrix.
The three diffusion-matrices which are the outcome of these elimination-solutions are
shown in tables 2.11, 2.12 and 2.13. The (unweighted)κ-measures which correspond
to these matrices are 0.8789, 0.9054 and 0.8686. These κ-measures show that the
agreement is above 0.87 which is a better result than the mentioned 0.50 before and even is a satisfactory indication that our corpus can be labeled with high reliability us-ing TAS [Carletta, 1996]. This high agreement amongst human annotators encourages us in the research for a method of automatically classifying these utterances.
Although we were not able to calculate the relation between the different classes
and thus weren’t able to calculate the weightedκ-measure we can conclude that that
the actual (weighted)κ-measure would even be better than the calculatedκ-measure
presented here. This because of the fact that a class asweak statementis closer to the
classstatementthan it is toopen issue.
To conclude this section about the HUB-corpus and its annotations is is good to
mention that the calculatedκ-measures are not really representative for the annotation
of the corpus. Since we only have compared the annotations of 2 annotators for an amount of 12 discussions, which is about 5% of the corpus. Furthermore it is the case
that in none of the compared discussions the labela/b issuewas used. To overcome
this problem we also have computedκ-measures overvirtual annotators. This will be
addressed in chapter 6, although it must be said that thesevirtual annotatorscan not
Annotator 1 / Annotator 2 Statement Weak statement Open issue A/B issue Yes/No issue Unknown
Statement 75 6 0 0 4 4
Weak statement 0 0 0 0 0 0
Open issue 0 0 4 0 2 0
A/B issue 0 0 0 0 0 0
Yes/No issue 0 0 0 0 0 0
Unknown 70 0 0 0 1 172
Table 2.10: Original diffusion-matrix
Annotator 1 / Annotator 2 Statement Weak statement Open issue A/B issue Yes/No issue Unknown
Statement 75 6 0 0 4 4
Weak statement 0 0 0 0 0 0
Open issue 0 0 4 0 2 0
A/B issue 0 0 0 0 0 0
Yes/No issue 0 0 0 0 0 0
Unknown 0 0 0 0 1 242
Table 2.11: A diffusion-matrix in which annotator 1 ’wins’
Annotator 1 / Annotator 2 Statement Weak statement Open issue A/B issue Yes/No issue Unknown
Statement 145 6 0 0 4 4
Weak statement 0 0 0 0 0 0
Open issue 0 0 4 0 2 0
A/B issue 0 0 0 0 0 0
Yes/No issue 0 0 0 0 0 0
Unknown 0 0 0 0 1 172
Table 2.12: A diffusion-matrix in which annotator 2 ’wins’
Annotator 1 / Annotator 2 Statement Weak statement Open issue A/B issue Yes/No issue Unknown
Statement 75 6 0 0 4 4
Weak statement 0 0 0 0 0 0
Open issue 0 0 4 0 2 0
A/B issue 0 0 0 0 0 0
Yes/No issue 0 0 0 0 0 0
Unknown 0 0 0 0 1 172
Chapter 3
Features
In the previous chapters we have made clear what the title of this report:On the
Struc-turing of Discussion Transcripts Based on Utterances Automatically Classified actu-ally means. We have presented a corpus of discussions as well as TAS, the annotation scheme we have applied to this corpus. Furthermore we have shown some figures about the agreement amongst annotators using TAS on the HUB corpus, which have given a satisfactory indication that our corpus can be labeled with sufficient reliability, if better
agreements on the classification of words‘Yeah’would be made. Having described our
task, our corpus and the annotation scheme it is now time to explain how we would want to achieve this.
TAS, being an argument representation scheme for discussions is based on the un-derlying semantics of a discussion. For human annotators understanding the meaning of an utterance most of the times is a piece of cake, even understanding expressions as the one just used. Computers on the other hand are symbol-machines, they can do
about anything with the syntax, but will neverunderstandan utterance like humans do.
But although classifying an utterance according to TAS is a semantic-based task it does not mean it has nothing to do with syntax. If we for example look at the utterance
’Would you like some coffee?’ then we are dealing with a question. We do not only know this is a question because on some meta-level we can conclude this, but also
be-cause of the words’Would you’. We have learned that an utterance which starts with a
verb followed by personal pronoun usually is a question. So the syntax (’Would you)
cues us for the semantics. We could say that the semantics of an utterance are somehow expressed in the syntax of the utterance and therefore the syntax can work as a cue for the semantics. This preassumption is the basis for feature extraction. Still we need to understand that classification of utterances is a context related task. One of the best
examples might be in the classification of utterances asweak statements. It might be
that in some cultures it is thought of as having good manners when one uses words as ‘probably’ or ‘perhaps’ in expressing one’s opinion. In such cases it would not be good
to use these words as cue words for aweak statement, since in this case these words do
not cue for a specific type, but are present because of the cultural context. Thus it is not the case that each utterance will or should always be classified the same.
In feature extraction we are concerned with finding syntactic cues for classification.
An ideal feature would only be available for utterances of typeX, this would be an
cues could be words as in the example above, but a pitch rate or the number of words in an utterance as well. For all utterances we can extract the same features and these feature sets combined with the labels assigned to the utterances are then used to train a classifier. In chapter 5 we will write more about classifiers, for now the most important is that we are using syntactic information to get to the semantics of an utterance.
To extract our features from the TAS annotated HUB-corpus we made use of several Perl scripts which were able to handle the HUB XML-format and gather the right statistics from it.
In the remainder of this chapter we will describe the features extracted from our
corpus, namelySentence Length,? and OR,Last Label,Ngram PointsandPOS Ngram
Points.
3.1
Sentence Length
Even a shallow study of our corpus, such as in table 3.1 shows us that most utterances
which are labeled with the typeunknownhave very few words. This specific
charac-teristic of utterances of the typeunknown(which mostly are backchannels) makes it
attractive to have asentence lengthfeature. Thesentence lengthfeature is defined by
the number of tokens in the utterance and a low score on this feature could be a nice
cue for utterances of the typeunknown.
Tokens are constructed in a tokenization process. In this process a text is split up into tokens. A token is defined as an accepted character string. In most cases this will be a word. Tokenizers can have several additional options and features like a list of non-tokens: tokens which according to the given pattern would be recognized, but by declaring them as non-tokens automatically are discerned.
The tokenization used in this project is quite simple, by declaring each word as a
token, where whitespace is used to define the border between words. Punctuation as.,
?and!are defined as tokens as well.
Label Average Standard deviation
Statement 21.58 26.58
Weak statement 26.29 24.90
Open issue 23.07 24.68
A/B issue 34.06 35.43
Yes/No issue 22.17 19.30
Unknown 3.51 6.81
Table 3.1: Utterance length statistics (based on number of tokens)
3.2
? and ‘OR’
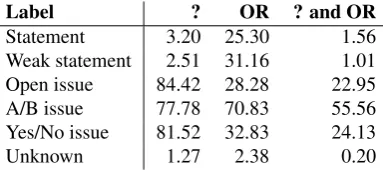
In common language most issues are (presented as) questions. To indicate that people are posing a question they can use their intonation in speech and question marks in written texts. This presence or absence of a question mark could therefore be a good indicator for an issue, as also can be concluded from table 3.2.
TAS makes a distinction between three sorts of issues, namelyOpen issues,A/B
that there is a limitedset of options. A common way of presenting such a limited
set of options is by using the wordor. We have therefore also chosen for a feature
which indicates the presence of the wordorin an utterance. Table 3.2 also shows that
utterances of the typea/b issuemost frequently have as well an ‘?’ as an ‘or’ present.
Label ? OR ? and OR
Statement 3.20 25.30 1.56
Weak statement 2.51 31.16 1.01
Open issue 84.42 28.28 22.95
A/B issue 77.78 70.83 55.56
Yes/No issue 81.52 32.83 24.13
Unknown 1.27 2.38 0.20
Table 3.2: Percentage of utterances containing the token(s) mentioned
3.3
Last Label
In conversations and discussion people do not only try to create syntactically and se-mantically correct utterances, but also try to let their utterances be of an interesting contribution to the conversation. This means that people do not just utter things occa-sionally, but tend to react to one another. This gives us reason to state that the intention or function assigned to an utterance is related to intentions and functions assigned to previous utterances in a conversation. Since a ‘Dialogue Acts’-like scheme like TAS
tries to model the intention which underlies utterances, we cantranslatethis
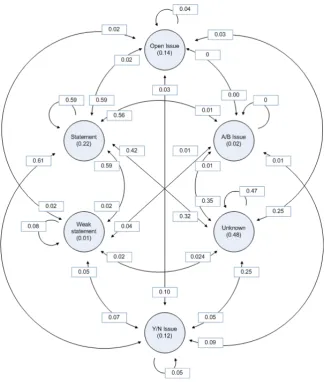
assump-tion in ’the label assigned to an utterances is related to labels earlier assigned’. Table 3.3 shows the coherence of labels assigned to two chronologically successive segments. The same information is graphically shown in figure 3.1. It shows the chance of
seg-mentX being of typeAgiven that the previous segment, segmentY, was of typeB.
We can for example conclude that based on these figures the chance of a segment being
of typeUnknown, given that the previous segment was of typeYes/No issueis 0.2473.
These figures show that our given the label of a node the chance of the
(chronolog-First node/Second node Statement Weak statement Open issue A/B issue Yes/No issue Unknown
Statement 0.5785 0.0212 0.0224 0.0089 0.0534 0.3154
Weak statement 0.5888 0.0761 0.0203 0.0051 0.0660 0.2437
Open issue 0.5926 0.0206 0.0412 0.0041 0.0947 0.2469
A/B issue 0.5556 0.0412 0.0000 0.0000 0.0556 0.3472
Yes/No issue 0.6110 0.0503 0.0306 0.0088 0.0525 0.2473
Unknown 0.4194 0.0216 0.0302 0.0080 0.0495 0.4712
None(start) 0.2241 0.0083 0.1411 0.0249 0.1249 0.4772
Unconditional 0.5126 0.0240 0.0295 0.0087 0.0556 0.3696
Table 3.3: Chronological transformations of nodes
ically) next node of being of some type is not equal to the unconditional chance of a node being of some type. A few interesting things to see are for example that the
chance ofweak statementbeing followed byweak statementis bigger then
‘uncondi-tionally’ would be expected. Perhaps doweak statements‘trigger’ each other. This is
Figure 3.1: Chance of transformations of nodes in time. The chance of a start node being of specific type is in parenthesis
issue is followed by anothera/b issueoropen issue. Finally we see that discussions are
more often started with issues than could be expected from the unconditional chance of an issue appearing, which of course could be expected because something (mostly an issue) needs to be discussed.
We see that the type of a node seems to be related to the type of the previous node. Our assumption still is that not only an utterance in influenced by the previous one, but by its full ‘history’. We have performed experiments of using 1 to 4 previous labels as a basis for classification. Using the two previous labels of utterances mentioned right before the current segment our classifiers performed best. Therefore we introduce the
Last labelfeature as a set of two features describing the two previous labels.
Another reason for having theLast labelfeature is the ‘ambiguity’ of text in the
exactly the same text of an utterance is differently classified. The only feature which
in such cases could make a distinction is theLast Labelfeature. If we would not have
this feature we could only predict the majority class of utterances with the specified text, which would result in 619 incorrect classified utterances. Table 3.4 shows 8 of the most ambiguous phrases.
Let us for example look at the utterance“yeah .”. This specific utterance occurs 479
times labeled asstatement, 354 times labeled asunknownand once labeled as aweak
statement. Without theLast Labelclassifier we would predict the majority class for
this utterance (statement) and would therefore classify this phrase 355 times incorrect.
utterance statement weak statement unknown
yeah . 479 1 354
okay . 119 83
right . 44 27
mm-hmm . 21 3 322
mm . 14 3 256
yeah , yeah . 17 10
yes . 11 36
yep . 10 18
Table 3.4: A few of the most ambiguous utterances
3.4
Ngram Points
Just as question marks have a high chance of indicating questions and issues other keywords and keyphrases might very well indicate types as well. For example it is very likely that words as ‘probably’ and ‘perhaps’ have a high chance of indicating the type
weak statement. In dialogue act classification much research has been done finding words and phrases which can work as an indicator. Hirschberg and Litman [1993] for example present a long list of cue phrases with words as ‘further’ and ‘therefore’. These cue phrases are manually selected after having studied numbers of conversations and are presented as context-free cue phrases.
Another way of finding cue phrases is by automatically selecting them. Reithinger and Klesen [1997] are one of the first who use this approach in dialogue act classifi-cation. Their approach is based on ngrams. An ngram is a subsequence of a sentence consisting of n consecutive tokens. First they created all ngrams for each utterance in the corpus. Then they used the number of occurrences of each ngram in the corpus. The more ngram X occurs in utterances of type A and the less it occurs in utterances of other types then type A, the bigger the chance that X is a cue phrase for A.
Using the Ngram Statistic Package (NSP) by Banerjee and Pedersen [2003] we have constructed all bi- (subsequences of two consecutive tokens), tri- (subsequences of three consecutive tokens) and quadrigrams (subsequences of four consecutive) for each utterance. This package has the possibility of constructing ngrams using several options as a stoplist, non-tokens etc. For each type we count the number of ngram-occurrences. An example of the counts of three trigrams are shown in table 3.5. If
state-ment, 14 times in an utterance of the typeOpen issue, 4 times in an utterance of the typeA/B issueand 2 times in an utterance of the typeYes/No issue.
trigram statement weak statement open issue ab issue yn issue unknown
what do you 3 0 14 4 2 0
do you think 3 1 8 4 24 0
we have to 47 3 3 1 8 4
Table 3.5: Examples of trigram occurrences
Having counted each ngram we want to select only the most predictive ones. Sev-eral experiments have been set up to develop a good method of ‘predictive ngram se-lecting’, they will be discussed in chapter 4. For now we will not concern how we have attributed points to each ngram for each type but will accept these as given. The actual value for the ngram feature is a vector with size 6. For each type we sum all the points for that type for each ngram in the utterance. This we do for uni,- bi-, tri- and quadrigrams.
Let us illustrate this by an example. Suppose we are to classify the utterance“And
what else do you do with the jog-dial ?” (which is of the typeOpen issue. First we create all uni-, bi-, tri- and quadrigrams which gives us the ngrams listed in the first column of table 3.7. Then for each ngram found we look up the points it contributes in the ngrams-table based on our training set. These figures can be found in the other columns in the table. To conclude we compute the total score for each ngram-order and type, which we do by just adding up each individual score. So the actual value of this feature is not just one value, but actually is a combination of 4 times (each order)
6 value (each type), as presented in table 3.6. As we can see the typestatementscores
the best, but this does not directly mean that it will be classified as astatementsince
our classifier will use all features of all training data to classify a new instance. Using this approach of automatically acquiring cue phrases and attributing points to them we are more likely to find context-specific cue phrases which might work as a good indicator for the semantics.
3.5
POS Ngram Points
The use of cue phrases seems to be a good feature for classifying dialogue acts accord-ing to studies as performed by Samuel [2000] and therefore we have used it as one of our features as described. But one of the problems of cue phrases is that they might be too specific and therefore miss the power of generalization. A possible solution for this problem is to make use of the part-of-speech of a word.
Each word belongs to apart-of-speech, like noun, pronoun or adverb. In school
most children learn what tokens belong to what part-of-speech and having some expe-rience part-of-speech tagging seems fairly easy. Still even very simple words as ‘book’, might be ambiguous and therefore harder to tag than might be expected. ‘book’ should be tagged as a noun in an utterance like “I’ve read this book”, but should be tagged as a verb in an utterance like “Are you going to book that flight?”
ngram order statement weak statement open issue ab issue yn issue unknown
unigram 6815 295 876 238 1331 406
bigram 128 4 41 11 59 24
trigram 2 0 0 0 0 0
quadrigram 0 0 0 0 0 0
Table 3.6: The ngram feature values
belonging to lexical classes. Most tag sets are based on the tag set used for part-of-speech tagging the Brown Corpus [Francis, 1980]. The Brown Corpus was the first major corpus of English for computer analysis and consists of 500 samples of randomly chosen publications. One of the tag sets based on this tag set is the Penn Treebank tag set [Marcus et al., 1993]. It consists of 45 tags, where the Brown corpus tag set consisted of 87. Several syntactic distinctions are not marked in the Penn Treebank tag set which made it possible to use fewer tags. In our work we tagged our utterance with the Stanford Log-Linear POS tagger which uses the Penn Treebank tag set.
There are generally three different approaches for automatic POS-tagging: rule-based, stochastic and transformation-based. The Stanford Log-linear part-of-speech tagger is a maximum entropy tagger which is a stochastic tagging variant [Toutanova et al., 2003]. The Stanford Log-linear POS tagger is a state of the art tagger developed in Java with an accuracy of 97.24% on the Penn Treebank WSJ. This good result to-gether with its good performance on unknown words make it a good POS-tagger for our project.
Returning to our first concern: why would we want to use POS-information? To make use of the power of generalization. We could for example have found cue ngrams like in the list below.
• What do (as inWhat do you like?)
• Which would (as inWhich would you choose?)
• Why can (as inWhy can’t I come with you?)
This leaves us with three different cue phrases which all cue for the typeOpen issueor
A/B issue. But by making use of part-of-speech tags we find a more general applica-ble cue phrase, namely WP VBP (a Wh-pronoun followed by a Verb, non-3rd person singular present).
Just as with our feature Ngram Points we have constructed all POS-ngrams for
each utterance and type, and attributed them with points to construct a value for our
ngram statement weak statement open issue a/b issue y/n issue unknown
and 1278 46 61 28 108 64
what 241 7 149 14 57 30
else 15 2 9 3 6 6
do 189 8 62 20 85 19
you 1754 63 116 28 222 91
do 189 8 62 20 85 19
with 354 16 23 9 49 17
the 2667 140 180 62 335 128
jog 1 0 0 0 0 0
dial 2 0 0 0 1 0
? 125 5 214 54 383 32
TOTAL 6815 295 876 238 1331 406
and what 7 0 1 1 2 0
what else 1 0 3 1 0 5
else do 0 0 0 0 0 0
do you 19 0 32 9 41 4
you do 8 0 0 0 2 5
do with 8 0 0 0 0 0
with the 84 4 5 0 14 10
the jog 0 0 0 0 0 0
jog dial 1 0 0 0 0 0
dial ? 0 0 0 0 0 0
TOTAL 128 4 41 11 59 24
and what else 0 0 0 0 0 0
what else do 0 0 0 0 0 0
else do you 0 0 0 0 0 0
do you do 0 0 0 0 0 0
you do with 0 0 0 0 0 0
do with the 2 0 0 0 0 0
with the jog 0 0 0 0 0 0
the jog dial 0 0 0 0 0 0
jog dial ? 0 0 0 0 0 0
TOTAL 2 0 0 0 0 0
and what else do 0 0 0 0 0 0
what else do you 0 0 0 0 0 0
else do you do 0 0 0 0 0 0
do you do with 0 0 0 0 0 0
you do with the 0 0 0 0 0 0
do with the jog 0 0 0 0 0 0
with the jog dial 0 0 0 0 0 0
the jog dial ? 0 0 0 0 0 0
TOTAL 0 0 0 0 0 0
Chapter 4
Classification
In the previous chapters we have described TAS, the HUB Corpus and the features we can extract from each segment. This chapter is about a subtask of applying TAS to a discussion: the classification of utterances. Classifying utterances as TAS nodes is a task very similar to Dialog Act Tagging, therefore we have applied the method presented in this report in Dialog Act Tagging as well. This will be described in chapter 8.
Although human annotators apply TAS by simultaneously classifying nodes as well as relations, our approach is of splitting up these tasks into subtasks, to decrease com-plexity. The advantage of classifying the way human annotators do is that at any stage the context of a node or relation to classify (i.e: the nodes and relations near) is avail-able and can be used as information for classifying. For our automatic classification of nodes we have made a split up of the classification task: first we will classify all the nodes and then the relations. But still to make sure that we do not miss too much
information of the context we have introduced theLast labelfeature. With this feature
we keep track of the last labels assigned to previous utterances.
To classify our nodes we have computed all the features for each node in our corpus.
Several experiments have been done on our createdfeature setsusing different settings
and training and test sets. The remaining of this chapter will concentrate on the setup of the experiments performed.
4.1
Balanced and Unbalanced
In the discussion on the HUB corpus table 2.2 showed us that our corpus is quite
unbalanced. Nodes of the typestatementandunknowntogether populate 88% of the
corpus. This means that obtaining a good results on our corpus would be possible
if a classifier only would be able to find a good distinction between statementsand
unknowns. Perfectly indicating nodes of typeA/B issuein this case is far less important
than classifyingstatements.
In our work we do not only aim for good results on the total corpus but are interested in the results for the different types as well. Therefore we have chosen not only to perform experiments on our original unbalanced corpus, but also on a balanced version.
This we have done in two different set ups: aunbalanced-on-balanced setup and a
of each type, resulting in a test set of 600 nodes. The remainder of the corpus was used as the training set, thus having constructed an unbalanced training set and a balanced test set.
For our balanced-on-balanced setup we first randomly picked 70 lines of each
type out of our corpus, constructing a corpus of 420 lines. Using this subcorpus we constructed a 10-fold train/test split, constraining the test set (and thus the training set as well) to have an equal number of nodes for each type.
Using these two different setups we hope to show the influence of the
‘balanced-ness’of the training set on the classification of the test set.
4.2
Ngram Selection Methods
In the previous chapter on feature extraction table 3.7 presented us an example of how to compute the scores for each ngram-order and type. These score should be analyzed by our classifier to identify the relations between these scores and the actual label of an utterance. Classifying our nodes on basis of these points means that the ngrams identified in our training set and the points attributed to them are crucial to our per-formance. By counting all the ngrams per type in the training set we create what in speech recognition traditionally is called a ‘language model’ (LM) per type. Table 4.1 gives the scores for the different ngram-order/type combinations based on the exam-ple in table 3.7, in which all the ngrams in the training set were used to score points. In this same example we saw that ngrams as ‘jog’ or ‘dial’ though having few occur-rences were considered as cue phrases. Furthermore our training set could incorporate ngrams which might have many occurrences but can hardly be found cue phrases as ‘a’ or ‘this’. Since we enumerate points of all cue ngrams, we can not leave the selection up to the classifier. Our classifier will not be able to determine the influence of each specific cue ngram. Therefore we believe it would be good to perform a selection on the ngrams found in the training set by deleting the ‘non-cue ngrams’ and so hopefully boosting our performance. This assumption is partly based on the work of Webb et al.
[2005] which is to our knowledge the only research usingngram selection methods. In
the remainder of this section we will present several of these ngram selection methods.
Order/Type statement weak statement open issue ab issue yn issue unknown
1 6815 295 876 238 1331 406
2 128 4 41 11 59 24
3 2 0 0 0 0 0
4 0 0 0 0 0 0
Table 4.1: Example of points obtained for each ngram-order and type
4.2.1
Normalizing Ngram-Values
Our first ngrams selection method, normalizing values, actually is not an ngram-selection method, but it does influence the predictivity of an ngram. It strikes us that in
general the occurrences of an ngram found in utterances of the typestatementare much
encountered in a node of typestatementand 2) typicallystatementshave more words
than for example nodes of typeunknown, which as well increases the chance that a
specific ngram will be encountered in a node of typestatement.
To overcome this potential problem one variation on our ngram-points table might be to normalize it over all ngrams for each type. Would we for example have counted
1000 ngrams of the typestatement and 100 ngrams of the typeweak statementthen
theunigram-statement-score for the ngram ’and’ would be 1.28 whereas the unigram-weak statement-score would be 0.46 (see table 3.7). By normalizing our ngram-values
we hope to overcome the problem that utterances of the typestatementcan score more
points on ngram-values for each type, just because of the fact that they in general have more words and therefore a bigger chance of having more cue ngrams, regardless of what type they cue for.
4.2.2
Select1/3Normalized
Commons sense tells us that not every ngram in an utterance will be a cue for the type of the utterance. Words as ‘and’ do not particularly act as a cue as words as ‘which’ or ‘perhaps’ do. To include relevant ngrams will therefore only create noise so non-relevant ngrams should be eliminated from the list of ngram-point-values. By selecting only the ngrams which claim to have a certain predictivity we hope to improvre our classification performances.
An ngram which is a cue for a specific type should relatively have significantly more occurrences in nodes of this type than in those of other types. Or select1/3Normalized (s1/3n) method is based on this preassumption. S1/3n selects only an ngram if
• it occurs at least 3 times in the training set
• after normalizing the occurrences per type for the number of ngrams per type
(just as calculated in section 4.2) it has one or more types with a normalized
occurrence-ratio which is equal or bigger than13 of the total normalized
occur-rences.
Example: Table 4.2 shows three ngrams found in a specific corpus. The total of ngrams found for each type is given. To check which ngrams will be selected we first calculate the total number of occurrences for each ngram. The ngram ‘this’ occurs in total 255 times, ‘the’ 405 times and ‘perhaps’ 46 times, so each ngram meets our first constraint. For our second constraint we first have to normalize our counts for the total of ngrams found for each type, these are shown in table 4.3. We can see that ‘the’ occurs
significantly more in nodes of typeyes/no issue, since 00..197284 > 13 and thus the ngram
‘the’ will be selected. The same goes for the ngram ’perhaps’, which appears 00..0151006 ≈
0.397of the time in nodes of the typeweak statement. Unlike the ngrams ‘the’ and
‘perhaps’, the ngram ‘this’ will not be selected, because even for the class in which it
appears the most,yes/no issueit does not meet our> 1
3treshold.
Order/Type statement weak statement open issue a/b issue y/n issue unknown total
this 100 60 20 3 45 15 243
the 200 100 20 11 59 5 395
perhaps 10 30 5 1 0 0 46
Total ngrams 10,000 5000 1000 250 3000 2000 21,250
Ngram statement weak statement open issue ab issue yn issue unknown total
this 0.01 0.012 0.02 0.012 0.015 0.008 0.077
the 0.02 0.02 0.02 0.044 0.197 0.003 0.284
perhaps 0.0001 0.006 0.005 0.004 0 0 0.0151
Table 4.3: Example of ngrams found in a corpus, normalized for the total number of ngrams found per type
4.2.3
DROP
n
Unlike the Select1/3Normalized method our DROPnmethod does not require an ngram
to ‘occupy’ a certain amount of the total ngram-space, but is requires an ngram to completely ’ignore’ nodes of a certain class. By selecting ngrams which fulfill such a requirement we will have ngrams with more distinctional power, thus having the chance of improving our classification performance.
An ngram will be selected if
• it occurs at least 3 times in the training set
• there arentypes for which the ngram occurrences is 0.
Example: using the DROP1 method only the ngram ‘perhaps’ (table 4.2 will be selected, just as when using the DROP2 method.
We have performed experiments with the DROP1 and DROP2 ngram selection methods. More on this can be found in chapter 6.
4.2.4
TOPx
A third ngram selection method first ranks all ngrams and then selects the top X. By selecting only the most predictive ngrams a lot of ‘noisy’ ngrams (ngrams which only cue a little for a certain type, but cue for another type as well) might be eliminated, which hopefully improves our classification performance.
To rank the ngrams for each ngram a ranking score is computed. This computation of this score is based on the following assumptions:
• Of two ngrams, the ngram which is more biased (after normalization) to a
spe-cific type (i.e. it relatively occurs more in the type in which it occurs the most then the other ngram occurs in the type it occurs the most) has a bigger probabil-ity of being a cue phrase than the other.
• Of two ngrams that are ‘equally biased’ (after normalization) to a specific type
the one which occurs more often in nodes of the specific type has a bigger prob-ability of being a cue phrase than the other.
The ranking-score described is equal to the product of the number of times the ngram
occurs in nodes of typeXandthe part of this ‘ngram-space’ occupied by nodes of type
X.
Example: The score for the ngram ‘this’ (see table 4.2) for type statement is
100
100+60+20+3+45+15×100 = 41.15, for the ngram ‘the’ the score is
200
200+100+20+11+59+5×
200 = 101.27, and the ngram ‘perhaps’ is valued 10+30+5+1+0+010 ×10 = 2.17. So
our ranking of ngrams for the typestatementwould be ‘this’, ‘the’, ‘perhaps’.