5-4-2011 12:00 AM
Experimental and Numerical Development of Anchor-Jointed
Experimental and Numerical Development of Anchor-Jointed
Precast Structural Wall System and Optimum Design of
Precast Structural Wall System and Optimum Design of
Prestressed Slabs
Prestressed Slabs
Mohamed El Semelawy
The University of Western Ontario
Supervisor A. A. El Damatty
The University of Western Ontario
Graduate Program in Civil and Environmental Engineering
A thesis submitted in partial fulfillment of the requirements for the degree in Doctor of Philosophy
© Mohamed El Semelawy 2011
Follow this and additional works at: https://ir.lib.uwo.ca/etd
Part of the Civil Engineering Commons, and the Structural Engineering Commons
Recommended Citation Recommended Citation
El Semelawy, Mohamed, "Experimental and Numerical Development of Anchor-Jointed Precast Structural Wall System and Optimum Design of Prestressed Slabs" (2011). Electronic Thesis and Dissertation Repository. 171.
https://ir.lib.uwo.ca/etd/171
This Dissertation/Thesis is brought to you for free and open access by Scholarship@Western. It has been accepted for inclusion in Electronic Thesis and Dissertation Repository by an authorized administrator of
(Spine title: Anchor-jointed Precast Structural Wall System / Optimum Design of prestressed slabs)
(Thesis Format: Monograph)
By
Mohamed El Semelawy
Graduate Program in Engineering Science Department of Civil and Environmental Engineering
A thesis submitted in partial fulfillment of the requirements for the degree of
Doctor of Philosophy
School of Graduate and Postdoctoral Studies The University of Western Ontario
London, Ontario, Canada June, 2011
ii Supervisors
______________________________ Dr. El Damatty A.A.
______________________________
Supervisory Committee
_____________________________ Dr. Maged A. Youssef
_____________________________
Examiners
______________________________ Dr. F. M. Bartlett
______________________________ Dr. W. W. El Dakhakhni
______________________________ Dr. M. H. El Naggar
______________________________ Dr. R. E. Khayat
The thesis by
Mohamed El Semelawy
entitled:
Experimental and Numerical Development of Anchor-Jointed Precast
Structural Wall System
and
Optimum Design of Prestressed Slabs
is accepted in partial fulfillment of the for the requirements of the degree of
Doctor of Philosophy
Date__________________________ _______________________________
iii
concrete damage possibility and capital loss during an earthquake event. Panels are jointed using
steel anchor bolts, therefore, the system is designated "anchor-jointed precast structural wall
system". In this system, anchors are utilized as a structural fuse. Damaged anchors are easily
replaced after an earthquake, thus minimizing repair costs and serviceability disruptions. In the
first part of this thesis, conceptual development of the system is carried out. A research program
of combined analytical and experimental studies is initiated to characterize the system.
Four specimens are tested under monotonic horizontal load. Each specimen consists of a precast
concrete wall panel and a base jointed through a horizontal joint. Joints tested in the current
program are designed so that different failure modes could be investigated. A non-linear finite
element model is developed. Through a model development process, model parameters are
examined and rationally estimated to accurately replicate the behaviour. The model is then
utilized to study the effect of selected parameters. The study reveals that anchor-jointed precast
structural wall system has shown excellent structural behaviour with regards to their lateral
capacity and ductility and may be used efficiently as a lateral-load-resisting system. However,
further experimental and analytical studies are needed before that system can be adopted by
relevant codes. Based on the analyses presented, it is concluded that applied gravity loads can
greatly enhance the lateral capacity of the system. Also, varying the anchor bar length is an
iv
techniques is developed. Although the objective function, Cost, is simple and monotonic, the
optimization problem is quiet challenging. Direct search methods and heuristic optimization
techniques are considered. Results suggest that search should be conducted along a constraint
boundary using multi-objective evolutionary algorithm.
KEYWORDS: shear walls, nonlinear, finite element, LS-DYNA, anchor bolts, precast concrete,
shear, joints, design, prestressed flat-slab, optimization, heuristic, multi-objective, genetic
v
Ashraf Nassef and Maged Youssef for providing valuable help and insight.
A huge thank-you goes out to Ahmed Soliman, Ph.D. candidate, for his help and technical advice
through the experimental part of this project. My test set-up would not have been possible
without his valuable input. In addition, I would like to thank Mr. Wilbert Logan, UWO
laboratory supervisor, for his enthusiasm and technical support for my experiments. Also, I
would like to thank Dr. Mohamed Attia for his assistance in getting me started with the
LS-DYNA.
Part of the steel anchors used in this testing program was donated by Williams Form Engineering
Corporation, London, Canada. This in-kind support is kindly appreciated. Also financial support
from The University of Western Ontario and NSERC is greatly acknowledged.
Last but not least, I would like to thank my family for their support; to my parents, wife, and son
vi
List of Figures ix
Chapter 1 Introduction 1
1.1 Anchor-jointed precast concrete structural wall system 1
1.1.1 Geometry and joints details of the prototype system 4
1.1.2 Objective and scope 8
1.2 Optimum design of prestressed slabs 9
1.2.1 Introduction 9
1.2.2 Objective 11
1.3 Thesis layout 12
Chapter 2 Lateral Resistance of Anchor-Jointed Precast Structural Wall System: Conceptual Development and Experimental Investigation 14
2.1 Introduction 14
2.2 Test specimen 15
2.2.1 Precast concrete panel 17
2.2.2 Concrete base block 21
2.3 Material properties 23
2.3.1 Concrete 23
2.3.2 Steel anchors 24
2.4 Test set-up 25
2.4.1 Loading and support system 25
2.4.2 Instrumentation 29
2.5 Experimental Results and discussion 32
2.5.1 Test 1 33
2.5.2 Test 2 39
2.5.3 Test 3 48
2.5.4 Test 4 52
2.6 General Discussion of Test Results 58
2.6.1 Failure modes 58
2.6.2 General behaviour of the test specimens 59
2.6.3 Gap/Contact behaviour 61
2.6.4 Shear force transfer across Joint 63
2.6.5 What governs the joint behaviour? 65
2.6.6 Parameters analysis 66
2.6.7 Ductility demand 69
2.7 Basis for development of response prediction model 71
2.8 Summary and Conclusions 76
Chapter 3 Lateral Resistance of Anchor-Jointed Precast Structural Wall System: Nonlinear
Model Development 79
3.1 Introduction 79
3.2 Factors governing the structural behaviour of the precast shear wall systems 80 3.3 Structural behaviour and Model development 81
vii
3.5.1 Concrete cone breakout failure mode 98
3.5.2 Rupture of steel anchor failure mode 111
3.6 Structural behaviour and failure modes under shearing load 116
3.6.1 Experimental study by Foerster et al. (1989) 117
3.7 Modeling pretension forces in anchors due to nut tightening 131
3.8 Conclusions 133
Chapter 4 Lateral Resistance of Anchor-Jointed Precast Structural Wall System: Nonlinear
Model and Parametric study 136
4.1 Introduction 136
4.2 Finite Element Model 137
4.3 Parametric study 155
4.3.1 Effects of varying gravity loads 155
4.3.2 Effect of varying anchor bar length/anchor block size 158
4.3.3 Effects of varying anchor pretension load 161
4.4 Summary and conclusion 163
Chapter 5 Design of Prestressed Concrete Flat Slab Using Modern Heuristic Optimization
Techniques 165
5.1 Introduction 165
5.2 Formulation of the Optimization Problem 167
5.3 Structural Analysis 171
5.4 Structural Design 173
5.5 Integration of Analysis, Design, and Optimization 175
5.6 Optimization Procedure 175
5.7 Summary and Conclusion 187
Chapter 6 Conclusions and Recommendations 190
6.1 Introduction 190
6.2 Summary and Conclusion 190
6.2.1 Anchor-jointed precast structural wall system 190
6.2.2 Design optimization 197
Chapter 7 References 200
Appendix I 210
Appendix II 223
Appendix III 224
Appendix IV 227
Appendix V 228
Appendix VI 231
viii
Table 3.1: material properties used for modeling Primavera et. al. (1997) 99
Table 3.2: Model parameters 102
Table 3.3: Effect of concrete tensile strength on model behaviour 107 Table 3.4: Effect of concrete fracture energy on model behaviour 109 Table 3.5: steel material properties for continuity bars (Specimen SP12C) 121 Table 4.1: Contact definition for the preliminary model 142
Table 4.2: Summary of the models results 148
Table 4.3: Effect of gravity loads 158
Table 4.4: Effect of varying anchor length 161
Table 4.5: Effect of pretensioning load on the numerical response of the system 163
Table 5.1: Design variables 168
Table 5.2: Constraints specified by the Canadian code (CSA A23.3) 168
Table 5.3: Structural materials cost 169
ix
Figure 1.3: anchor-jointed precast structural wall system assembly 8
Figure 2.1: Specimen configuration 16
Figure 2.2: Generic dimensions of the precast concrete panel 19 Figure 2.3: Reinforcement details of the precast concrete panels 20
Figure 2.4: Details of base block 22
Figure 2.5: Stress-strain curve for tested anchor bolts 25
Figure 2.6: Schematic of test set-up 27
Figure 2.7: Test set-up 28
Figure 2.8: Test set-up (concrete base block) 29
Figure 2.9: Layout and designations for LVDT’s 30
Figure 2.10: Strain gauge 31
Figure 2.11: Definition of wall drift 33
Figure 2.12: Base shear-drift response of Test 1 35
Figure 2.13: Anchor load variation during Test 1 36
Figure 2.14: First visible crack 36
Figure 2.15: Damage at maximum load 37
Figure 2.16: Extensive damage in the concrete surrounding the tension anchor (post-peak) 37 Figure 2.17: Crack developed at the back face on the tension side of the joint 38 Figure 2.18: Minor cover spalling at the compression side of the joint 38 Figure 2.19: Tension anchor side of the joint at the end of the test: front face (left) back face (right) 39 Figure 2.20: strengthening of concrete panel against concrete breakout 40 Figure 2.21: force transfer to the web and stiffeners reinforcement 41 Figure 2.22: Strengthening of the tension side anchor block (a) Reinforcement (b) after casting 42
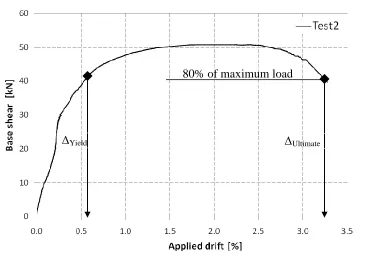
Figure 2.23: Base shear-drift response of Test 2 44
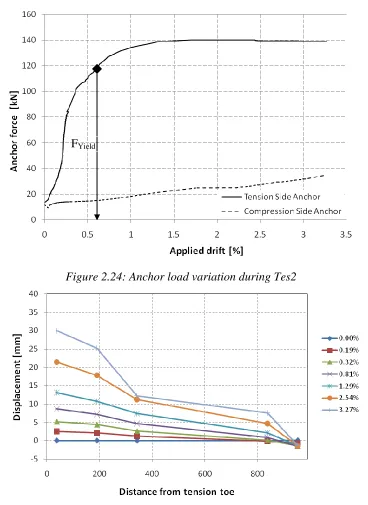
Figure 2.24: Anchor load variation during Tes2 45
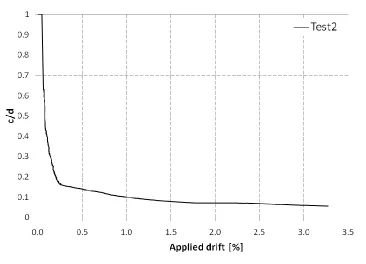
Figure 2.25: X-Sectional deformation at joint interface (Test 2) 45 Figure 2.26: contact length versus wall drift (Test 2) 46 Figure 2.27: (a) Cracks initiated at the tension side stiffener just above the anchor block (b) cracks spreads upwards and new cracks are formed in the second and third stiffeners 47 Figure 2.28: Cracking and spalling of concrete at the compression toe 48
Figure 2.29: Base shear-drift response of Test 3 50
Figure 2.30: Anchor load variation during Test 3 50
Figure 2.31: X-Sectional deformation at joint interface (Test 3) 51 Figure 2.32: contact length versus wall drift (Test 3) 51 Figure 2.33: Cracking and spalling of concrete at the compression toe (Test 3) 52 Figure 2.34: Deformation at gap opening ~30.0 mm measured at the outermost stiffener on the tension side (a) Gap opening at the tension side toe (b) contact between panel and base block at the compression side toe 52
Figure 2.35: Base shear-drift response of Test 4 54
Figure 2.36: Anchor load variation during Test 4 54
Figure 2.37: X-Sectional deformation at joint interface (Test 4) 55 Figure 2.38: contact length versus wall drift (Test 4) 55
Figure 2.39: Cracks formed in the concrete panel 56
Figure 2.40: Cracks in the anchor block area 57
Figure 2.41: Concrete compression failure 57
Figure 2.42: Observed modes of failure 59
x
Figure 2.50: Analysis of the joint behaviour 72
Figure 2.51: illustration of the tri-linear idealization of the neutral axis depth versus base rotation (after Aaleti and
Sritharan 2009) 74
Figure 2.52: prediction of base shear-drift response of Test2 75 Figure 2.53: prediction of base shear-drift response of Test3 76
Figure 3.1: force transfer across joint 81
Figure 3.2: (a) fracture process zone (b) representative volume (c) post-cracking softening response for concrete (d) tensile stress across a developing crack (after Bažant and Oh 1983) 87 Figure 3.3: General shape of shear failure and cap hardening surface in two dimensions (Murry 2004) 91
Figure 3.4: Contact forces 94
Figure 3.5: Static equilibrium under bending moments 97
Figure 3.6: Expected failure modes 97
Figure 3.7: Group-H specimens tested by Primavera et al. (1997) 99 Figure 3.8: One-quarter model for Group-H specimens 100
Figure 3.9: Finite element meshes 100
Figure 3.10: Single element tensile stress-strain curve for different element sizes (MAT_072R3) 103 Figure 3.11: Model versus Tests load-Displacement response (MAT_072R3) 104
Figure 3.12: Crack pattern (MAT_072R3) 105
Figure 3.13: Internal energy of the model (MAT_072R3) 105 Figure 3.14: Single element stress-strain curves for different assigned tensile strength (MAT_072R3) 107 Figure 3.15: Effect of assigned tensile strength on model load-deflection response (MAT_072R3) 108 Figure 3.16: Single element stress-strain curves for different assigned fracture energy (MAT_072R3) 109 Figure 3.17: Effect of fracture energy on model load-deflection response (MAT_072R3) 110 Figure 3.18: Model versus Tests load-Displacement response (MAT_159) 111 Figure 3.19: Necking, and fracture of a 1″ threaded bar under direct tension test 113 Figure 3.20: Finite element modeling of 1″threaded bar subjected to tensile load (a) mesh and loading (b) deformed
shape at imminent failure (c) failure 115
Figure 3.21: Stress-strain relationship 115
Figure 3.22: Experimental vs. model load-displacement curve for anchor bolt under direct tension 116 Figure 3.23: Dowel action mechanisms (after Paulay et al. 1974) 117 Figure 3.24: Observed Shear load-slip curve (after Foerster et al. 1989) 119 Figure 3.25: Specimen SP12 and SP12C (after Foerster et al. 1989) 120 Figure 3.26: boundary conditions and applied loads on the FE model (Specimen SP12C) 121 Figure 3.27: Snagging of edge node (after Reid and Hiser 2004) (a) applied load (b) sliding block locks due to
snagging of edge point 122
Figure 3.28: Finite element model for SP12C 123
Figure 3.29: Finite element mesh of concrete panels and continuity reinforcement 124
Figure 3.30: sequential load application 125
Figure 3.31: Model versus experimental shear load-slip response of specimen SP12C 127
Figure 3.32: Vertical forces transfer 127
Figure 3.33: deformed shape of the connecting rods at maximum slip 128
Figure 3.34: Components of horizontal force 128
xi
Figure 4.4: Horizontal-force equilibrium of the preliminary model 143 Figure 4.5: Vertical-force equilibrium of the preliminary model 144 Figure 4.6: Kinetic, internal, total energy of the preliminary model 144 Figure 4.7: Couple forces resisting bending moment at the joint level 145
Figure 4.8: Horizontal force transfer at the joint 145
Figure 4.9: Load-drift response of Test1 149
Figure 4.10: Load-drift response of Test2 149
Figure 4.11: Load-drift response of Test3 150
Figure 4.12: Load-drift response of Test4 150
Figure 4.13: Damage pattern for Test1 (concrete breakout failure mode) (a) Model (b) Test 151 Figure 4.14: Damage pattern for Test2 (steel rupture failure mode) (a) Model (b) Test 152 Figure 4.15: Correlation between tension side anchor forces for Test2 153 Figure 4.16: Correlation between tension side anchor forces for Test3 153 Figure 4.17: Forces in the panel reinforcement (Test3 model) 154 Figure 4.18: Applied pressure to the Anchor-jointed precast structural wall system model 156 Figure 4.19: Effect of gravity load on the numerical response of the system 157 Figure 4.20: Effect of gravity loads on tension side anchor forces 157
Figure 4.21: Models of varying anchor block size 159
Figure 4.22: Effect of varying anchor length on the numerical response of the system 160 Figure 4.23: Effect of varying anchor length on tension side anchor force 160 Figure 4.24: Effect of pretensioning load on the numerical response of the system 162 Figure 4.25: effect of pretensioning force on tension side anchor force 162 Figure 5.1: Cross-section showing variables defining tendon profile 171 Figure 5.2: Cross-section showing the Max/Min eccentricity at a certain location 171 Figure 5.3: Coordinates and degrees of freedom of the elements used (a) consistent shell element (b) tendon element (c) tendon element included in a shell element 173 Figure 5.4: Procedure for evaluation of optimum design of prestressed concrete slab system 175 Figure 5.5: (a) convex search space (b) non-convex search space 176 Figure 5.6: Objective function vs. generation (iteration) for the Genetic Algorithm – Run1 179 Figure 5.7: Searching for the optima along a constraint boundary 182 Figure 5.8: (a) Pareto-optimal solutions of the multi-objective optimization (Run1) (b) Zooming at the boundary line
1
Introduction
The work presented in this thesis attempts to develop an economic system to be used for
concrete buildings. First, a new innovative system for precast concrete shear walls is introduced.
Precast shear walls are mainly used to resist lateral loads. The new system is titled as
"Anchor-jointed precast structural wall system". Secondly, in Chapter 5, a robust numerical tool to aid in
designing prestressed flat slabs under gravity loads for minimum cost.
1.1
Anchor-jointed precast concrete structural wall system
Shear walls are often used to resist earthquake and wind loads. They also can be utilized to
transmit gravity loads. Their inherently high strength and stiffness offer a great advantage in
resisting lateral loads. Precast shear walls consist of reinforced concrete panels that are cast in a
concrete plant, transported, and erected and connected together onsite. Precast construction is
getting more and more popular among construction methods implemented in North America.
The system advantage lies in its rapid cost-effective construction and durability due to greater
quality control over the material and workmanship of the plant-produced panels. Precast
construction is quick, efficient, and economic. Moreover, precast concrete walls can be
The performance of precast concrete shear walls serving as the main lateral force resisting
system during the 1988 Armenia earthquake was superior to all other structural systems (Wylie
and Filson 1989). For buildings with such a system, only minor cracking at some panels and
joints was observed. On the other hand, buildings with other systems suffered severe damages
and partial to complete collapses. Generally, precast concrete shear wall behaviour is highly
dependent on the response of the base panel-to-foundation joint. Precast structural shear wall
systems will be more accepted as a primary lateral-load-resisting system for low-to-medium rise
buildings if they are efficiently jointed. Properly connected precast elements will survive a
seismic event and would experience less damage compared to cast-in-place construction (Soudki
et al. 1995, Schultz and Magana 1996, and Priestley et al. 1999).
In general, precast shear wall can be categorized according to their design philosophy into two
main categories: either emulative or nonemulative (jointed) detailing. Emulative detailing
involves designing a connection that is intended to respond to lateral displacement in the same
manner as cast-in-place monolithic wall. On the other hand, for nonemulative (jointed) detailing,
the connection is expected to be weaker than the adjacent precast panels and a gap opening at the
panel-to-panel interface is anticipated. Structural behaviour of the two categories is different in
stiffness, strength, energy-absorption, and ductility characteristics. The non-emulative joints are
included in the ACI-318-08 code, whereas it was not permitted by previous versions.
For the jointed detailing, the panel-to-panel and base panel-to-foundation joints are considered
deformations occur in the base panel-to-foundation joint region due to rocking and sliding of the
joint, and thus, the overall behaviour of the wall is governed by the response at this joint.
Different typologies of jointing techniques were studied. In general, tested joints utilized ductile
vertical continuity reinforcement (bonded or unbonded). Continuity across the joints was
achieved through grouting sleeves, welding or bolting to a steel section, or using prestressing
tendons (Soudki et al., 1995 and Schultz and Magana 1996, Holden et al. 2003, Kurama et al.
1999 and Hutchinson 1991). A slotted-bolted friction joint was utilized by Bora et al. (2007) to
avoid brittle wall or anchorage failure in thin hollow-core precast panels.
In this study, a new innovative jointing technique is proposed to accelerate construction process
and to minimize damage and capital loss in the aftermath of a seismic event. Panels are jointed
using steel anchor bolts and nuts. Inspired by the jointing technique, the system is designated
"anchor-jointed precast structural wall system". In this regard, steel anchors can be used as a
structural fuse. The structural fuse concept introduces a sacrificable structural element that
provides adequate structural ductility and strength during an earthquake event. During an
earthquake, energy dissipation is provided by yielding of the steel anchor. Cracking and damage
in concrete panels is significantly minimized. Damaged anchors could be easily replaced, after
an earthquake, minimizing repair costs and serviceability disruptions. In the proposed system,
grouting or welding is not required, thus simplifying the construction process and reducing its
1.1.1 Geometry and joints details of the prototype system
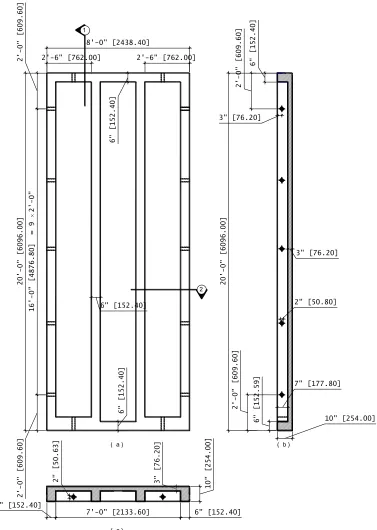
The overall dimensions of the panel are 6,096×2,438 mm. The cross section consists of a 76-mm
thick concrete web; stiffened by four vertical stiffeners (152 × 254 mm). Fifty mm diameter
holes are located every 610 mm to accommodate anchor bolts used to connect a panel to the
adjoining panels. Typical elevation and cross section of prototype panel and the location of the
holes for the anchor bolts are depicted in Figure 1.1. Adjoining panels are connected through
horizontal and/or vertical joints as illustrated in Figure 1.2. The suggested configuration could be
used to construct simple or coupled shear walls. Walls are considered to be coupled if the
vertical joints are designed to transfer the shear flow generated by the coupling action. It should
be noted that vertical and horizontal panel-to-panel joints, in addition to
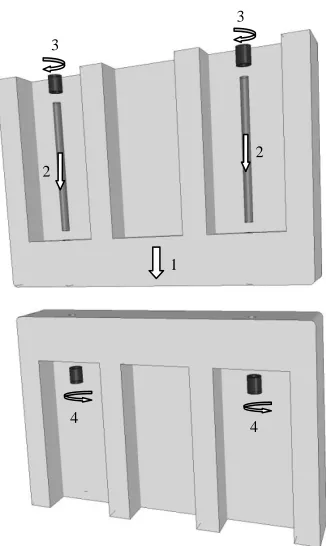
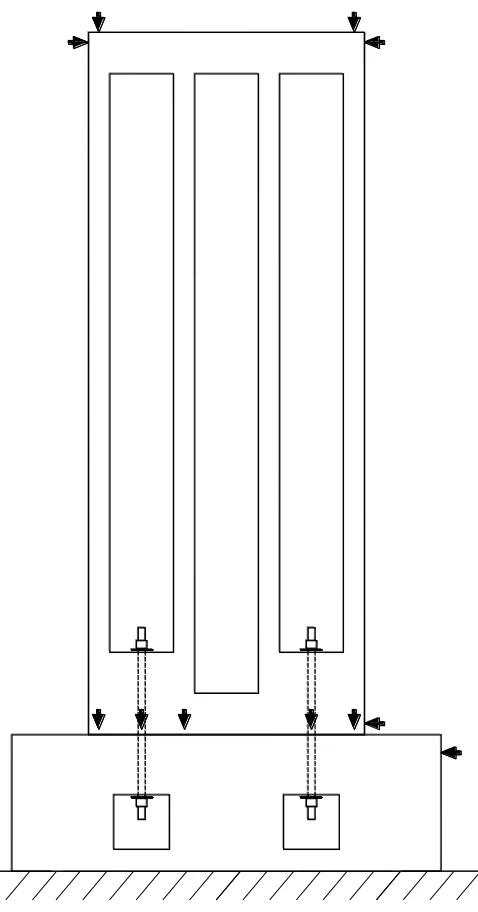
base-panel-to-foundation joints, are fairly identical as shown in Figure 1.2. Figure 1.3 illustrates a possible
practical erectoin sequence for the proposed joint. Erection process involves placing of the
panels in their proper positions within the structure (stabilizing it with temporary bracing),
sliding anchor bolts through the prefabricated holes, and then securing with two nuts. The
behaviour of the proposed joint can be superior to other joints in the aspect of energy dissipation
and damage prevention, as shall be explained in the following sections.
For the proposed joint, the inelastic demand is lumped at the base panel-to-foundation interface
through opening of a single crack. The joint may be designed to soften and undergo large
nonlinear lateral drift with little damage. The anchors do not transfer considerable tensile
stresses into concrete due to lack of bond, and therefore, seismically induced structural damage
panel to remain elastic. Following a damaging earthquake event, only damaged anchor bolts
8'-0" [2438.40]
2'-6" [762.00] 2'-6" [762.00]
1
(a )
2'-0" [609.60]
16'-0" [4876.80] = 9
× 2'-0" 2'-0" [609.60] 20'-0" [6096.00] 6" [152.40] 6" [152.40] 2 6" [152.40] 6" [152.40] 2'-0" [609.60] 2'-0" [609.60] 20'-0" [6096.00] 3" [76.20] 2" [50.80] 3" [76.20] 10" [254.00] 6" [152.59] 7" [177.80] (b ) 10" [254.00] 3" [76.20] 6" [152.40] 2" [50.63] (c ) 6" [152.40] 7'-0" [2133.60]
Figure 1.1: Typical concrete dimension of the prototype panel (a) Elevation (b) Section 1 (c)
Horizontal Joint
Vertical Joint
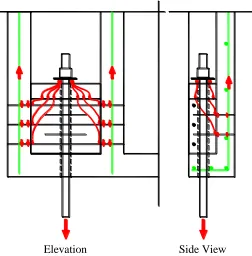
Securing nut
(b) (c)
Threaded anchor bolt
Washer
Horizontal Panel-to-panel
Joint
(a) Foundation
Base panel Upper panel
(d) (e)
Horizontal base panel-to-foundation
Joint Foundation
Vertical Joint
Figure 1.2: Precast shear wall details (a) wall (b)panel-to-panel joint (enlarged) (c) panel-to-panel joint cross-sectional side view
Figure 1.3: anchor-jointed precast structural wall system assembly
1.1.2 Objective and scope
A research program of combined analytical and experimental studies is initiated at the
University of Western Ontario to develop, assess, and validate design procedure for the proposed
jointing technique. An experimental program is designed focusing on conceptual development
and creation of basic information on strength and associated failure modes of the anchor-jointed
precast structural wall system for design purposes. Experimental study is followed by an
analytical investigation to develop and validate a numerical model capable of simulating the
proposed joint response to shear and bending loads.
1 2
2 3
3
4
Both studies are carried out in an effort to allow for code adaption of the anchor-jointed precast
structural wall system. Codification process, as required by ITG-5.1-07 (ACI 2008), involves
three stages: (1) behaviour characterization through experimental and analytical analyses, (2)
developing design/analysis procedures for a generic form of the system, and (3) validation
testing of specimens designed according to the developed design procedures. Other
nonemulative walls, namely the unbonded post-tensioned precast structural wall system, is
already recognized and accepted by the ACI-318-08 code (Refer to clause 21.10.3). The system
design requirements are found in ITG-5.2-09 (ACI 2009).
1.2
Optimum design of prestressed slabs
1.2.1 Introduction
In the first part of the thesis, a system for resisting later load has been developed. To augment
the design of a building, the prestressed flat slab system is chosen as the main flooring system
and its design is optimized. Prestressed concrete flat slab system is widely used for residential
and office buildings, hotels, hospitals and parking garages in North America. The system has
proven its structural efficiency and economy. The use of post-tensioning allows for material
savings due to reduced slab thickness. Post-tensioning also reduces the cracking and deflection
of the slab under service loads. The design process of the post-tensioned flat-slab system to
resist gravity loads is well defined in international codes. Considering the numerous feasible
designs, this study attempts to find the optimum combination of design variables to achieve
Modern heuristic search algorithms are powerful tools used in optimization problems in different
fields. However, structural design is the selection of design variables subject to behavioural and
strength constraints; a process for which heuristic optimization techniques are very much
suitable. Heuristic optimization techniques such as Genetic Algorithm and Simulated Annealing
were successfully used in design optimization of concrete structures (Coello et al. 1997; Payá et
al. 2008; Atabay and Gulay 2009;Martí and González-Vidosa 2010). In spite of the huge
capabilities of modern heuristics, they are rarely utilized by practicing engineers. In the current
engineering practice, choice of an economical design is based on the designer experience
together with a number of rules of thumb. Nevertheless, design optimization is gaining more
significance due to potential savings in cost and fierce international competition.
Structural design optimization has gained more popularity with the rapid development in
optimization techniques together with the availability of powerful computers. In general, more
studies were concerned with optimization of steel rather than concrete structures (Cohn and
Dinovitzer 1994). Numerous studies were published addressing the design optimization of
concrete structures and concrete structural elements (e.g., Templeman 1983; Choi and Kwak
1990; Coello 1997; Balling and Yao 1997; Kousmousis and Arsenis 1998; Sahab et al. 2005
(a&b); Payá et al. 2008; Atabay and Gulay 2009). Nevertheless, few studies were concerned
with the design of prestressed concrete slab. One of the first attempts to consider the optimum
design of prestressed concrete slabs was carried out by Rozvani and Hampson (1963). MacRae
and Cohn (1987) used nonlinear programming for optimization and conjugate direction method
passive steel for a given section and reinforcement arrangement. Kuyucular (1991) considered
several predefined cable profiles for a given section to minimize the prestressing cables weight.
He carried out structural analysis by coupling finite element and equivalent load method. The
method involved a time consuming procedure of calculating several factors for each cable
profile, hampering the automation of optimization process. In both studies, optimization was
carried out for a given slab thickness. Excluding one of the main design variables would weaken
the applicability of the design tool to engineering practice. Lounis and Cohn (1993) considered
minimization of two objective functions (Cost and Initial camber) by using one as the objective
function and the other as a constraint using the ε-constraint approach. They used Projected
Lagrangian algorithm for optimization and sectional stress analysis and force-in-tendon method
for analysis. Although all design variables were considered in optimization, their analysis
method limits the application of their method to simple structures. The current study attempts to
take the optimization of prestressed concrete flat slab a step further by considering all the design
variables in the optimization process. This is possible considering the great advancement in the
modern optimization heuristics.
1.2.2 Objective
The main objective of this part is to utilize the huge capabilities of modern heuristic search
algorithms for structural design optimization of pre-stressed concrete slabs in order to develop a
general, flexible, and relatively easy to use tool for practicing engineers. A robust numerical tool
integrating design, analysis, and optimization techniques is developed for this purpose. The tool
the slab thickness, number and size of tendons, and tendon profile are sought subject to design
constraints imposed by the relevant code of practice. The objective function incorporates the cost
of both concrete and prestressing tendons.
1.3
Thesis layout
In Chapter 2, the conceptual development of the anchor-jointed structural wall system is carried
out. An experimental program is carried out to evaluate the performance of the new jointing
technique. The details of the testing program and results are demonstrated. The tests results are
used to characterize the behaviour of the system; primarily determining lateral strength and
possible associated modes of failure.
In Chapter 3, a non-linear finite element numerical model is developed to capture the effects of
the new joining technique on precast concrete shear walls behaviour and possible associated
failure modes. Through a model development process, material properties, material model
parameters, element size, mesh layout, and contact definitions are examined and fine-tuned to
accurately capture the behaviour. Structural response and associated failure modes of the system
to bending and shearing loads are studied thoroughly, including breakout of concrete cone,
rupture of steel anchor, dowel action and shear friction. Sub-assemblies and similar tested joints
available in the literature are modeled. Correlative studies between analytical model and
In Chapter 4, information and insight gained from conducted simulations are utilized to develop
a reliable model for the anchor-jointed precast structural wall system. The model is then verified
against the tests presented in Chapter 3. The developed model is extended beyond the test data to
study the effect of selected parameters on the structural response of the tested specimens. These
parameters are: (1) gravity loads, (2) anchor length, and (3) anchor pretension force.
In Chapter 5, a numerical tool capable of finding the optimum design of a prestressed concrete
flat slab system using modern heuristic search algorithms is developed. The introduced tool
employs finite element analysis for structural analysis with prestressing modelled explicitly
using tendon elements. As a demonstration problem, the optimum design of a square prestressed
flat slab supported on four columns at the corners and spanning 5.0 m is investigated. The
Canadian code CSA A23.3 is chosen as the design code. Direct search methods, heuristic
optimization techniques such as Genetic Algorithms, and multi-objective optimization
techniques are considered. Results of different optimization procedures are presented and
2
Lateral Resistance of Anchor-Jointed Precast Structural Wall
System: Conceptual Development and Experimental
Investigation
2.1
Introduction
A new innovative jointing technique is proposed to connect precast concrete panels forming a
structural shear wall. The basic concept of the system and main practical consideration is
developed herein. In this system, panels are connected using steel anchor bolts. That can be
utilised as structural fuses. The structural fuse concept introduces a sacrificable structural
element that provides adequate structural ductility and strength during an earthquake event. This
element, during an earthquake, will be damaged (sacrificed) while preserving all other structural
elements. However, the integrity of the gravity load path is maintained. Only the structural fuse
is replaced in the aftermath of an event and thus minimizing capital loss and service disruption.
Another advantage of the newly proposed system is that it is easier to construct. Connection is
established just by tightening the nuts. Grouting or welding is not needed.
Structural shear walls are massive. Due to their inherently high lateral strength, high levels of
lateral forces are needed to perform testing. A full size test may be infeasible with respect to cost
considering the amount and size of equipment necessary for testing. A total of four reduced scale
applied at the top. The monotonic response is construed as a practical tool for evaluation of the
seismic response as it approximates the experimental resistance envelope under cyclic or
dynamic action. Each specimen has been studied thoroughly before conducting the next test.
Utilizing information and insight gained from each test, modifications were suggested and
implemented in the next test to further improve the structural behaviour.
Details of the conducted experimental program are presented. First a description of the test
specimens and material properties are given, followed by a description of the test set-up and
procedure. Then, experimental observations and discussion of each test are presented. After that,
the overall behaviour including failure modes, gap/contact behaviour, force transfer mechanism,
and the effect of studied parameters are discussed. Finally, the basis of developing analytical
procedures for system response prediction is explained.
2.2
Test specimen
Test specimens are sized to simulate the behaviour of a horizontal connection near the base of a
typical pre-cast shear wall where the behaviour under bending moments governs. Bearing in
mind the limitation imposed by the testing facility and the complexities associated with the joint
behaviour needed to be captured by the test specimen, a scale of 1:2.5 is chosen. The size of the
reduced scale specimens is the maximum size that could be tested in the testing facility.
However, cross-sectional dimensions are slightly modified due to practical consideration
regarding minimum reinforcement spacing and cover and minimum feasible thickness. These
joint details rather than the panel cross-section. Each specimen consists of two parts; a precast
concrete wall panel and a base block. The two parts are joined by a horizontal joint, as depicted
in Figure 2.1.
base block precast concrete panel load application
Joint
550
2500
2.2.1 Precast concrete panel
The test panels are proportioned to reflect the characteristics of the prototype panel described in
Figure 1.1. The test panels are dimensioned assuming the same material properties and the same
shear-span-to-wall-length ratio of 2.5. A distributed reinforcement layout similar to the prototype
panel is used preserving the reinforcement ratio,ρ = As/Ac, where As is the reinforcement area
and Ac is the cross-sectional area of the concrete section.
To correlate the test results to the expected prototype behaviour, similitude or scaling laws are
applied (ACI Committee 444, 1979). Using theBuckingham’sPitheorem(Murphy,1960),two
independent dimensionless ratios representing the behaviour are set to be equal in both the
reduced scale test and the full scale. Scaling of the base shear is determined by forming the
dimensionless ration P/EL2, where P is the load, E is the modulus of elasticity and L is the length.
r e duced scale full scale
2 2
full scale
reduced scale
2 full scale full scale
reduced scale reduced scale
P P
EL EL
E
On the other hand, the displacement is presented as the ratio of the wall lateral displacement to
the wall height. As such the full scale (i.e. if the prototype panel is tested) is expected to achieve
the same drift angle.
The overall dimensions of the test panel are 2,575×990 mm, corresponding to a height-to-length
ratio (hw/lw) of 2.6, while the shear-span-to-wall-length ratio is 2.5 as mentioned earlier. This
relatively high ratio ensures that the behaviour is governed by flexural (e.g. gap opening) rather
than shear (e.g. sliding). The cross section consists of a 70-mm thick concrete web stiffened by
vertical stiffeners. Vertical stiffeners are 75-mm wide × 70-mm thick. Two holes, 610-mm apart,
located midway between two vertical stiffeners to accommodate anchor bolts are used to connect
a panel to the base block. Resistance to breakout failure is provided by anchor blocks at panel
corners. The generic dimensions and reinforcement details of the precast concrete panel are
depicted in Figure 2.2 and 2.3. All reinforcement has nominal yield strength of 400 MPa. Upper
loading beam dimensions are chosen as 280×150 mm to facilitate loading.
Joints tested in the current program are sized up so that different failure modes could be
investigated. A total of four joints are tested. Variations of the anchor block size and
reinforcement details, in addition to steel anchor type are studied. An overview of the tested
990 1 Elevation 2 Section 1 A n cho r b lo ck siz e 150 2574
Upper loading beam
Anchor block 140 70 280 150 t Upper web Lower web Section 2 230 140 70 75 230 230 990
75 75 75
70
150
Section 1 Reinforcement Details
Lower web
10M
10M
3-10M 10M @ 150 mm 2-10M
Section 2
10M @ 150 mm
3-15M 15M
3-15M 3-15M 3-15M
10M @ 150 mm 10M @ 150 mm
15M 2-10M
Figure 2.3: Reinforcement details of the precast concrete panels
Table 2.1: Overview of the experimental results
Test anchor block size
[mm] steel anchor type
Anchor area [mm2]
ultimate strength [MPa]
Test 1 150 Grade 75 510 742.4
Test 2 330 Threaded anchor – Type I 391 367.6
Test 3 550 Threaded anchor – Type I 391 367.6
2.2.2 Concrete base block
Concrete base block is sized and detailed to sustain maximum anticipated internal forces due to
testing (see Appendix VI). The overall dimensions of the base block are 480×550×1540 mm.
Two 200×200 mm voids are embedded to facilitate tightening of the steel anchors nuts during
specimen erection. A horizontal groove along the top surface is used to pass and protect the
wires of the strain gauges attached to the steel anchors. Details of the base block are depicted in
plan
480
1540
292
188
465 610 465
1
Section 3 - Reinforcement Details 2
10M 4-legs see section 2
for spacing 8- 15M 550 480 8- 15M 8- 15M
Section 2 - Reinforcement Details Section 2 - Concrete Dimensions
550
1540
365 200 410 200 365
1540 200 8- 15M 550 480 200 290
Section 1 - Concrete Dimensions 292 188
1 Horizontal groove
365 200 410 200 365
Horizontal groove Horizontal groove 290 60 10 M 3- 10M 60 3 10 M 3- 10M 3- 10M 10 M
Section 1 - Reinforcement Details
10M 4-legs see section 2
for spacing 8 - 15M
480
8 - 15M 8 - 10M
1540
Section 2 - Stirrups Reinforcement Details 10M - 4 legs
3- 10M 550 200 290 60 550 200 290 60 550 200 290 60 Void Void Void Void Void Void 10 M
2.3
Material properties
2.3.1 Concrete
The concrete for the precast panel and base block is supplied by a ready-mix concrete company.
Self-compacting concrete (SCC) with maximum aggregate size of 10 mm is used to facilitate
concrete placing. Concrete mix design properties are listed in Table 2.2. The
water/binding-material ratio of the mix is 0.354. The workability is measured using slump flow test (ASTM
C1611). SCC flow reaches 500 mm diameter in 1.98 seconds and the slump flow is 640 mm.
Visual inspection of the concrete indicates that concrete segregation resistance is acceptable.
Standard cylinders (4'' in diameter and 8'' in height) are cast. Six cylinders are moist cured and tested for the 28-day compressive (ASTM C39) and splitting (ASTM C496) strength. The 28-day
compressive strength is 70.8 MPa, while splitting strength is 6.0 MPa. The other cylinders are
kept alongside the panels where their curing conditions are kept as close as possible to those of
the panels. For these cylinders the compressive strength is slightly higher, 71.5 MPa. Detailed
cylinder tests results are presented in Appendix III.
Table 2.2: Concrete mix design properties
Dry weight [kg/m3]
Cement 375
Slag 125
Stone 890
Sand 910
Admixtures
mL/m3
High range water reducer 2125
Normal range retarding water reducers 1000
Viscosity modifier 500
2.3.2 Steel anchors
Three types of anchors are utilized. One sample of each type is tested under direct tensile load.
The obtained stress-strain curve is depicted in Figure 2.5. Relevant properties are summarized in
Table 2.3.
Table 2.3: Steel anchor properties
Type Thread Root Diameter [mm] Net area [mm2]
Elastic Modulus [GPa] Ultimate Stress [MPa] Ultimate Strain Proof/yield Stress [MPa]
Grade 75 All-thread rebar 25.48 510 160.9 742.4 0.0696 492.0
1" Threaded Bar – Type I 21.48 391 166.6 367.6 0.0922 308.0
0.0 100.0 200.0 300.0 400.0 500.0 600.0 700.0 800.0
0 20000 40000 60000 80000 100000
Str
es
s
[MP
a]
μStrain
Grade-70-1'' Anchor 1'' threaded Bar - Type I 1'' threaded Bar - Type II
Figure 2.5: Stress-strain curve for tested anchor bolts
2.4
Test set-up
2.4.1 Loading and support system
The base block is fixed to the strong laboratory floor using four strong anchor bolts and four
steel beams as shown in Figures 2.6 through 2.8. Anchors are slid through their designated holes,
protruding out of the concrete base block. Using the laboratory overhead crane, the precast panel
is lowered down to its proper position, and then the anchors are secured by nuts. The precast
concrete panel is supported laterally to ensure out-of-plane stability using a bracing rod. A pin
connection located at the end of the bracing is oriented to allow the wall to move freely in the
of the joint. The loading system consists of a 250-kN loading actuator and a reaction frame. Load
is applied at 2.50 m above the joint level, resulting in a base moment to shear ratio of
Mb/Vb=2.52lw, where lw is the panel width. Prior to loading, the steel anchors are tightened up
and the corresponding strains are recorded. Following that, a small horizontal load is applied to
Elevation
Plan
Side View
Cross Beam
Cross Beam 250 kN
Loading actuator
Cross Beam
Reaction Frame (not shown)
Tension side anchor
Compression side anchor
Laboratory strong floor
Anchored to the laboratory strong floor
Longitudinal Beam Longitudinal
Beam
Longitudinal Beam
(a) (b)
Figure 2.8: Test set-up (concrete base block)
2.4.2 Instrumentation
A computer-controlled data acquisition system is used to record all electronic test data from
LVDTs, strain gauges, and actuator load.
2.4.2.1Linear Variable Differential Transducers (LVDT’s)
Eleven Linear Variable Differential Transducers (LVDTs) are used to record in-plane
displacement of the wall panel and the concrete base block, gap/contact behaviour and sliding at
the joint interface. Layout of the used LVDTs is shown in Figure 2.9. Two LVDTs are mounted
horizontally on the top of the specimen to monitor the horizontal deformation. Five LVDTs are
aligned vertically at the joint to monitor the joint deformation and the gap/contact behavior.
the panel displacements. The last two are installed horizontally just above and below the joint to
record the joint sliding.
LVDT location
2.4.2.2Strain Gauges
Four electrical strain gauges, with ¼−inch gauge lengths, are applied to each anchor bolt to
monitor the anchor strain during testing (see Figure 2.10). The strain measurements are
correlated to the anchor forces using the stress-strain relationship obtained from the sample
testing. Strain gauges readings of the anchor bars are recorded during tightening of anchors prior
to testing and during testing. The strain gauges are installed on opposite surfaces to eliminate any
bending effects that may occur. Four strain gauges are used to reduce the possibility of
measurement errors by averaging the four readings. To provide appropriate contact area between
the bar and the strain, a minimal surface of the threads is smoothed and sanded to a buffed finish
with varying grits of emery sanding paper and cleaned with a solvent to remove any
contaminants.
2.5
Experimental Results and discussion
Results of the experimental program are presented in the following section. The wall drift is
defined as the ratio of the wall lateral displacement to the shear span length, defined as the
distance from the joint level to the load application level (2.5 m). The lateral displacement is
obtained after correcting the displacement readings to account for rigid body displacements, i.e.
slip. The lateral displacement is taken as the average of the readings of the top horizontal
LVDT’sminusthedisplacement at thebaseofthewall(see Figure 2.11). For the gap/contact
behaviour, the last contact point is considered as an equivalent neutral axis, which is the location
where vertical displacements of LVDTs mounted along the joint change sign. The bar forces are
hw
Drift
Figure 2.11: Definition of wall drift
2.5.1 Test 1
Prior to testing, forces of 61.3 and 66.8 kN are recorded at the end of tightening process for the
tension and compression side anchors, respectively. At the beginning of the horizontal
displacement application, these forces are reduced to 57.2 and 58.9 kN due to elastic shortening
of the surrounding concrete.
Figure 2.12 describes the base shear-drift response. As load is applied, bending moment
accumulates at the joint level causing the force in the tension side anchor to increase and the
force in the compression side anchor to be released as shown in Figure 2.13. At a drift of ~0.09
~0.80 kN/m, implying gap initiation as the applied load overcomes the initial compressive
stresses resulting from anchor tightening. Due to gap formation, the contact length decreases and
consequently the developed compressive bearing stresses is expected to increase.
The first visible crack is observed at drift of ~0.43 %, which corresponds to 20.6 kN of base
shear; this crack is located in the anchor blockimmediate to the anchor bolt on the front face of
the specimen and is inclined at ~43 degrees (see Figure 2.14). The sound of the concrete
cracking is clearly heard. This first crack is accompanied by further reduction of the tangent
stiffness to ~0.35 kN/m. As a result, the increasing rate of the tensile force in the tension side
anchor and the reduction rate in the compression force in the compression side anchor is
decreased approximately by 51% and 70%, respectively (see Figure 2.13).
At a drift of ~0.85%, a maximum load of 24.5 kN is attained leading to the formation of a
breakout cone-like failure surface around the tension anchor as depicted in Figure 2.15. As the
test progresses (draft > 0.85 %), no further increase in the load carrying capacity is observed,
however, extensive damage in the concrete around the tensile anchor occurs, as shown in Figure
2.16. As a result, the axial load in the tension side anchor is considerably reduced. At maximum
load, the gap opening measured at the outermost stiffener on the tension side is ~3.71 mm. At
this stage, the joint behaviour is clearly governed by the concrete breakout at the tension side
anchor.
Cracking at the back face of the tension side and minor spalling of the concrete cover at the
the tension side of the panel after removing damaged concrete. There are virtually no other parts
of the panel that are cracked or damaged.
Recognizing the inherent weakness of the original panel to breakout failure, which prevents the
system from resisting higher levels of lateral loads, modification to the panel geometry and
reinforcement detailing to provide an alternative load path is proposed and tested as illustrated in
the next section.
0 5 10 15 20 25 30
0 0.2 0.4 0.6 0.8 1 1.2 1.4 1.6
Ba
se
s
h
ea
r
[
kN]
Applied drift [%]
Test1
Figure 2.12: Base shear-drift response of Test 1
0 20 40 60 80 100 120
0 0.2 0.4 0.6 0.8 1 1.2 1.4 1.6
A
n
ch
o
r
fo
rc
e
[
kN]
Applied drift [%] Tension Side Anchor
Compression Side Anchor
Figure 2.13: Anchor load variation during Test 1
Figure 2.15: Damage at maximum load
Figure 2.17: Crack developed at the back face on the tension side of the joint
Figure 2.19: Tension anchor side of the joint at the end of the test: front face (left) back face (right)
2.5.2 Test 2
2.5.2.1 Strengthening
The concrete panel is strengthened to avoid breakout failure observed in Test1 by providing an
alternative load path. In this modification, the anchor force is intended to be resisted by panel
reinforcement rather than concrete only. Eight 3/8'' threaded bars are arranged to transfer the
anchor load to the adjacent vertical stiffeners and the 70-mm thick concrete web as depicted in
Figure 2.20 and 2.22 (a). The threaded bars are designed to transfer the entire anchor load
through shearing across two planes along the interface between old and new concrete. All other
possible existing transfer mechanisms are ignored for design simplicity. Figure 2.21 illustrates
the proposed new load path through existing reinforcement in the concrete panel. New concrete
is poured to increase the anchor block size to 330 mm to fit the added threaded rebars with
reasonable spacing (~40 mm). The strength of the added concrete is approximately equal to the
distributed over the largest possible area. Since this test applies only a monotonic load, these
modifications are only applied to the tension side anchor block as shown in Figure 2.22.
Plan
3/8'' threaded steel rebar Lower
web
2'' steel plate
New concrete
Elevation Side view
Old concrete
Elevation Side View
(a)
(b)
Figure 2.22: Strengthening of the tension side anchor block (a) Reinforcement (b) after casting
2.5.2.2Test
At the beginning of the test, the forces in the tension and compression anchors are 34.8 and 30.0
kN, respectively. As load is applied, gap opening is initiated at a drift of ~0.07 %, corresponding
to 9.0 kN of base shear. As a result, the initial joint lateral stiffness is reduced from ~4.05 kN/m
LVDT reading monitoring joint deformations. Similar to Test 1, the gap formation results in a
shorter contact length, as seen in Figure 2.26, and consequently higher compressive bearing
stresses. Figure 2.25 shows snap shots of the sectional deformation at different applied drifts.
As horizontal displacement is applied, the anchor forces are increased. The tension steel anchor
reaches its proof stress, 308.0 MPa, at a drift of ~0.62 %, corresponding to 42.8 kN of base shear
as depicted in Figure 2.24. Beyond this point, the base shear is increased until reaching a plateau
at a load of 50.8 kN.
Initially, horizontal cracks are formed in the outermost vertical stiffeners on the tension side
immediately above the anchor block. As load increases, new cracks are formed and spread
upward in the stiffener, and its opposite back face. Thereafter, cracks are formed in the second
and third stiffeners as shown in Figure 2.27. Cracks also initiate at the bottom of the mentioned
stiffeners and spread upward. Vertical stiffeners cracks are more or less evenly spaced.
Moreover, no cracks or any signs of distress are observed within the anchor block area. These
observations confirm that the majority of the anchor load is transferred through the proposed
load path.
At this stage, the joint behaviour is clearly governed by the anchor elongation rather than
concrete breakout as in Test 1 (see Section 2.5.1). Moreover, using the proposed reinforcement
scheme and a longer anchor block shifted the failure mode to yielding and rupture of steel
anchors. As the test progresses, the steel anchor continues to yield and the load dropped
drift, the gap opening measured at the outermost stiffener on the tension side is ~30.0 mm (see
Figure 2.25). Other than the cracks in the vertical stiffeners, the precast panel remains intact. The
panel exhibits minor cracking and spalling of the concrete at the compression side of the joint as
seen in Figure 2.28. All damage and yielding is concentrated in the steel anchor with minimum
damage to the panel, steel anchors can work as a structural fuse.
An unexpected deformation of the base block is observed, accompanied by a formation of a
diagonal crack originating from the corner of the 200×200 mm void on the tension side of the
base block. ThisdeformationwillcauseanerrorinthehorizontalLVDT’sreadingsduetorigid
body rotation of the base. Support conditions of the base are enhanced with additional supporting
members to avoid this source of error in the remaining tests.
Figure 2.23: Base shear-drift response of Test 2
ΔUltimate
80% of maximum load
Figure 2.24: Anchor load variation during Tes2
Figure 2.25: X-Sectional deformation at joint interface (Test 2)
(a)
(b)
Figure 2.27: (a) Cracks initiated at the tension side stiffener just above the anchor block (b)
Figure 2.28: Cracking and spalling of concrete at the compression toe
2.5.3 Test 3
In order to investigate the anchor block size on the joint behaviour, an identical specimen to that
of Test 2 is used but with increased anchor block size (330 mm in Test 2 specimen versus 610
mm in Test 3 specimen). Prior to loading, the forces in the tension and compression anchors are
12.5 and 1.8 kN, respectively. Figure 2.30 depicts the variation of the force in the tension and
compression side anchors versus the applied lateral drift. Unfortunately, all strain gauges of the
tension side anchor have been damaged after the bar has reached its proof stress.
Figure 2.29 describes the base shear-drift response. Similar to previous tests, at a drift of ~0.05
%, corresponding to 8.5 kN of base shear, the initial lateral stiffness of the joint is reduced from
~3.80 kN/m to ~2.50 kN/m due to gap initiation. Cross-sectional deformation at the joint
versus wall drift is depicted in Figure 2.32. Figure 2.34 shows a side view of the tension and
compression toes, showing gap opening at the tension side and complete bearing at the
compression side. The base shear-drift response remains approximately linear up to the steel
anchor reaching its proof stress, 308.0 MPa (as shown in Figure 2.30), at a drift of ~0.69 %,
corresponding to 43.2 kN of base shear. Crack formation is identical to Test 2. Beyond this point,
the base shear is increased until reaching a plateau at a load of 51.5 kN. Cracking and minor
spalling of the concrete cover at the compression side of the joint is observed as seen in Figure
2.33. As the steel anchor continues to yield, the load drops gradually until failure is attained by
rupture of the tension anchor at drift of ~3.50%. Similar to Test 2, the fuse concept is manifested
as no cracks in the panel other than the cracks in the vertical stiffeners; all damage is
concentrated in the yielding and rupture of the anchor. At maximum drift (~3.50%), the gap
opening measured at the outermost stiffener on the tension side is ~36.3 mm (see Figure 2.31).
At this stage, the joint behaviour is clearly governed by the anchor elongation. Comparison
Figure 2.29: Base shear-drift response of Test 3
Figure 2.30: Anchor load variation during Test 3
ΔUltimate
ΔYield
-5 0 5 10 15 20 25 30 35 40
0 100 200 300 400 500 600 700 800 900
D is p la ce m e n t [m m ]
Distance from tension toe
0.00% 0.31% 0.76% 1.18% 1.65% 2.67% 3.50%
Figure 2.31: X-Sectional deformation at joint interface (Test 3)
Figure 2.33: Cracking and spalling of concrete at the compression toe (Test 3)
(a) (b)
Figure 2.34: Deformation at gap opening of ~30.0, measured at the outermost stiffener on the
tension side (a) Gap opening at the tension side toe (b) contact between panel and base block at the compression side toe
2.5.4 Test 4
Aiming to study the compression failure mode, an identical specimen to Test 3 is Specimen used