Clinical Audit
Dovepress
O r i g i n A L r e s e A r C h
open access to scientific and medical research
Open Access Full Text Article
An evaluation of the quality of post-stroke
rehabilitation in Japan
seungwon Jeong Katsunori Kondo nariaki shiraishi Yusuke inoue
nihon Fukushi University, nagoya, Japan
Correspondence: seungwon Jeong nihon Fukushi University, nagoya, Japan, 4600012
email [email protected]
Context and objectives: This study was to assess the differences in rehabilitation outcomes between the different facilities in Japan, and to determine if there was any variation in patients’ functional recovery at hospital discharge across the different facilities.
Methods: This study focused on patients in recovery in the rehabilitation ward using the data of 680 patients from 12 hospitals after adjusting for triage at admission obtained from the Rehabilitation Patient Databank in Japan (issued in September, 2009) and compared the thera-peutic results of each hospital. We estimate the expected value of levels of activities of daily living (ADL) at discharge for rehabilitation patients using regression analysis. Furthermore, we show the distribution of the expected improvement levels in ADL by hospitals.
Findings: At the time of admission, there were no differences among hospitals in their patients’ characters. However, outcomes differed widely among the hospitals. The differences in the par-ticipation of physicians registered as rehabilitation specialists, conference execution rate, amount of exercise per day, self-exercise without a therapist, and exercise in wards, were statistically significant differences between hospitals.
Conclusion: Due to the assessments for health care quality and the publication of results it is expected that health care providers will put in voluntary effort to improve their future health care services. Further studies should analyze the characteristics of high-performing hospitals.
Keywords: rehabilitation, quality of care, post-stroke
Introduction
Recently there have been growing concerns and requirements for health care quality in Japan. The introduction and implementation of pay for performance (P4P) programs for rehabilitation and recovery in 2008 was a significant advancement in the area of health care services. However, there still remains a gap involving a need for close examination of what factors may critically influence the rehabilitation medical service quality and the degree to which hospitals have made, or will make, efforts in achieving best practice in rehabilitation. To begin with, the assessment criteria for P4P set forth by the Japanese government are summarized as follows.
In Japan, P4P inpatient rehabilitation among stroke survivors began in 2008 with a primary objective to provide the services needed and improve post stroke patient functional recovery. Despite concerns over the effectiveness and quality of P4P by some stakeholders of the program in Japan,1 three standards were developed for the
P4P inpatient rehabilitation program. They included: 1) .60% of participating stroke survivors should be discharged to the community; 2) .15% of severe stroke patients
Clinical Audit downloaded from https://www.dovepress.com/ by 118.70.13.36 on 20-Aug-2020
For personal use only.
Number of times this article has been viewed
This article was published in the following Dove Press journal: Clinical Audit
Dovepress Jeong et al
should be hospitalized; and 3) .30% of patients under the P4P program should demonstrate an improvement in their daily living functions or functional recovery at the time of hospital discharge.
P4P is considered to be a tool that can enhance health care quality and improvement. Reports show that P4P has been increasingly used in developed countries such the United States1 and the United Kingdom.2 Nevertheless, there
is a lack of reports on formal evaluation of hospital P4P in the literature. Systematic evaluation of hospital P4P is needed to understand the effect and benefits of investing in P4P.3
Reacting to these developments, our research team, under government sponsorship, embarked on the development of a benchmarking database for rehabilitation medicine in 2007, and successfully built up a large clinical dataset of approxi-mately 4,000 patients from hospitals across the nation.
To facilitate the evaluation, the Rehabilitation Patient Databank was developed with financial support from the Ministry of Health, Labor and Welfare of Japan. As of May 2009, 30 hospitals had contributed structured data from 3,949 patients to the databank. It should be noted that not all the hospitals have a rehabilitation unit.
This database, brought about by the intensive efforts of volunteer doctors who consented to the need for the presence of a central database for medical advancements in rehabilita-tion, has been attested for its usefulness and validity through doctor reviews conducted on a quartely basis. As a result, the upgraded software, Rihab DB version 3.3 was released in 2009, and this will surely be followed by further developed versions from 2010, under the support of the Japan Rehabili-tation Medical Association. Using the information from the Rehabilitation Patient databank, this study was to assess the differences in rehabilitation outcomes between the different facilities in Japan, and to determine if there was any variation in patients’ functional recovery at hospital discharge across the different facilities.
This study is hopefully expected to provide fundamental ideas for government policy makers as well as the medical profession to meet the growing needs for enhanced medical service quality.
Methods
This study consists of two parts. In part 1, we estimate the expected value of levels of activities of daily living (ADL) at discharge for rehabilitation patients using regression analysis. In part 2, we show the distribution of the expected improvement levels in ADL by hospital from the estimation results in part 1.
Material and population
In this retrospective study, patient level data were obtained from the Rehabilitation Patients Databank in Japan.
Hospitals contracted with the databank collected patient data twice per year, the first between January and February and the second between July and August, from April 2005 to March 2009. The patients who discharge from the hospital during the survey period are registered with the databank (consecutive data).
To ensure our outcomes of interest were comparable across the different facilities, we used the following inclusion and exclusion criteria to select our study cohort:
1. Drawing from the literature that acute patients and chronic patients (both of whom are included in the Rehabilita-tion Patients Databank) have different attributes, this study covered only one type of patients: chronic patients (21 hospitals, N = 1,519).
2. The effectiveness of chronic rehabilitation is affected by compound factors including the patient’s environment and treatment by medical practitioners, and thus this study attempted to use patient data with as similar conditions as possible in comparing different hospitals. To minimize the difference due to age in improvement rate in ADL, the study was conducted among patients aged 55 to 84 (N = 1,212). 3. By drawing on the literature that early onset was important
for more effective rehabilitation for stroke patients, the interval between the stroke and the admission was confined to over 1 week and below 8 weeks (N = 1,201). The specific reason for choosing that interval was that patients treated within a week of the stroke were highly likely to be acute patients, who are more easily subject to compound factors that affect rehabilitation effects, and patients admitted after over 2 months were likely to have lost the opportunity of timely treatment, which could prevent accurate assessment of treatment effects albeit they were properly treated. 4. Similarly, the length of inpatient stay for this study were
also confined to between over 1 week and below 8 weeks (N = 969) because patients who were discharged within a week were assumed to have stop being treated, and for patients who stayed in hospital over 2 months, there was a possibility that their length of stay increased for other reasons such as a complication.
5. Lastly, this study conducted a comparative analysis of patient-level treatment achievement in rehabilitation among hospitals. For fair comparison, hospitals whose submitted samples were too small were excluded and the cut-off was set as 15 cases available (12 hospitals, N = 680).
Clinical Audit downloaded from https://www.dovepress.com/ by 118.70.13.36 on 20-Aug-2020
Dovepress Quality of stroke rehabilitation in Japan
Variables of interest
The Functional Independence Measure (FIM™) is the most widely used functional assessment measure in the rehabilitation community,4,5 and it is regarded as most
useful in assessing the patient progress during inpatient rehabilitation. The FIM is an 18-item, seven level ordinal scale. It is the product of an effort to resolve the long standing problem of lack of uniform measurement and data on disability and rehabilitation outcomes.6 The 18-item
ordinal scale can be calculated into a summary score and two subscale scores of motor and cognitive function; the higher the score, the more independent a patient’s func-tion.7 In this study, total FIM score was used to assess the
patients’ functional recovery or as a proxy for patients’ daily living functions. Patient motor scale and cognitive scale were collected and analyzed at inpatient admission and discharge dates, respectively.
Prediction of Functional independence
Measure score at the time of discharge
There are two methods for calculating the improvement rate in FIM. The first is a method where the rate is cal-culated by taking the difference between the admission and discharge score and dividing that by the length of stay. This only provides a general sketch of how much improvement took place for any patients without consid-erations of individual patient characteristics. The second method involves taking the difference between the esti-mated scores based on individual patient characteristics obtained at admission, and the actual scores shown at discharge. This enables difference in treatment outcomes among hospitals to be compared on the same case mix basis, that is, between patients with the same conditions at the start, and this method was adopted for this study. The following is the applied calculation method for FIM scores at discharge.
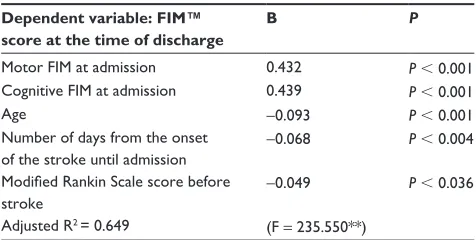
Motor FIM scores and cognitive FIM scores at admission were respectively computed, controlling for variables affect-ing the outcomes regardless of rehabilitation care quality experienced by stroke patients, such as age, number of days from the stroke until admission, and modified Rankin Scale score before the stroke. Estimated scores were obtained from regression analysis with FIM score at discharge as a depen-dent variable and motor FIM score, cognitive FIM score at admission, age, number of days from the stroke until admis-sion, and modified Rankin Scale8,9,10 score before stroke as
independent variables (Table 1).
It was found that those variables used in the estimating equation had an accountability of about 60% with the coef-ficient of determination (R2) being 0.649. This suggested that
the rest (35%) was accounted for by certain processes and practices involved in rehabilitation care service, which was the concerned area of this study in comparing differences in performance of different hospitals.
Therapeutic achievement
The therapeutic achievement in this study was defined as the difference between the predicted-discharge FIM score and the actual FIM score measured. We analyzed this difference with a 95% confidence interval (CI).
statistical analysis
evaluation of therapeutic achievement for each patient using estimated values from regression analysis
To evaluate the therapeutic achievement for each patient, the calculation of FIM gain was made by taking the difference between the actual FIM score and the estimated FIM score obtained from the equation in Table 1. The whole distribution of scores was divided into thirds to classify subject patients into three groups.
The range of therapeutic achievement for each patient was divided into three groups: good (a group whose prediction value was higher than its measurement value: over 6); fair (a group whose prediction value was supposed to be equal to its measurement value: from -4 up to 5); and poor (a group whose measurement value is below its prediction value: over 5). Each group’s distribution was examined.
Table 1 The prediction equation for Functional independence Measurement™ score at the time of discharge
Dependent variable: FIM™ score at the time of discharge
B P
Motor FiM at admission 0.432 P , 0.001 Cognitive FiM at admission 0.439 P , 0.001
Age -0.093 P , 0.001
number of days from the onset of the stroke until admission
-0.068 P , 0.004
Modified Rankin Scale score before
stroke
-0.049 P , 0.036
Adjusted r2 = 0.649 (F = 235.550**)
Notes: estimated scores were obtained from regression analysis with FiM score at discharge as a dependent variable and motor FiM score, cognitive FiM score at admission, age, number of days from the stroke until admission, and modified Rankin scale score before stroke, and diagnosis as independent variables. Diagnosis was excluded by regression model.
Abbreviations:P, probability; r2, coefficient of determination; FIM, Functional
independence Measurement.
Clinical Audit downloaded from https://www.dovepress.com/ by 118.70.13.36 on 20-Aug-2020
Dovepress Jeong et al
Comparison between hospitals using cluster analysis
After confirming if there is any difference in the shape of distribution for FIM Gain Group 3 (good, fair, poor) between hospitals, high performing hospitals and low performing hospitals were respectively identified and accordingly assigned to each cluster in order to test what factors influence the difference. The group rated as “poor” in terms of FIM gain was used as a criterion for cluster analysis.
By carrying out cluster analysis with the characters of patient distribution in each hospital, this research classified hospitals according to performance into a high performance group or low performance group.
Results
Distribution of therapeutic achievements
in each hospital
While focusing on the databank data (issued in September, 2009) in patients in recovery in the rehabilitation ward, this study adjusted for triage at admission and compared the therapeutic results of each hospital by using the data of 680 patients from 12 hospitals as described above.
By considering each patient’s conditions at admission, their FIM score would be likely to judge the improvement of ADL predicted at the time of discharge then compared against the measurement value at discharge. As a result, the FIM score showed a distribution range of 24.4 at a 95% CI of -21.2, with -0.28 on average (standard devia-tion [SD]: 12.88). On the basis of the results, the patients were divided into three different groups: “good”, “fair”, and “poor”. Each hospital’s distribution was examined. As a result, it was found that there were statistically
Table 2 Distribution of quality of health care in each hospital
Hospital N Good
N (%)
Fair N (%)
Poor N (%)
A 13 6 (46.2) 6 (46.2) 1 (7.7)
B 32 10 (31.3) 16 (50.0) 6 (18.8)
C 21 6 (28.6) 11 (52.4) 4 (19.0)
D 30 12 (40.0) 11 (36.7) 7 (23.3)
e 8 2 (25.0) 4 (50.0) 2 (25.0)
F 68 22 (32.4) 28 (41.2) 18 (26.5)
g 52 24 (46.2) 13 (25.0) 15 (28.8)
h 256 105 (41.0) 71 (27.7) 80 (31.3)
i 13 2 (15.4) 6 (46.2) 5 (38.5)
J 13 2 (15.4) 5 (38.5) 6 (46.2)
K 22 3 (13.6) 7 (31.8) 12 (54.5)
L 76 7 (9.2) 23 (30.3) 46 (60.5)
Notes: “good” (a group whose prediction value was higher than its measurement value: over 6); “Fair” (a group whose prediction value was supposed to be equal to its measurement value: from -4 up to 5); “Poor” (a group whose measurement value is below its prediction value: over 5).
significant differences in the ratio of distribution of “poor” among the hospitals (Table 2). Notably, while the group for the poor levels of the FIM score accounted for only 7.7% of patients in Hospital A, the ratio of the group for the poor levels in Hospital L was up to 60.5% of patients.
Analysis of factors affecting
the difference in therapeutic
achievements at each hospital
Although the FIM score was predicted at the time of discharge in the same conditions by adjusting the triage at admission, each hospital showed a variety of differences in distribution from the measurement value. Therefore, by using cluster analysis to analyze factors leading to the different distribu-tion of therapeutic achievements in each hospital, the study divided all the hospitals into two different groups according to therapeutic achievement while retaining the actual condi-tion of health care services provided by each hospital group (Figure 1).
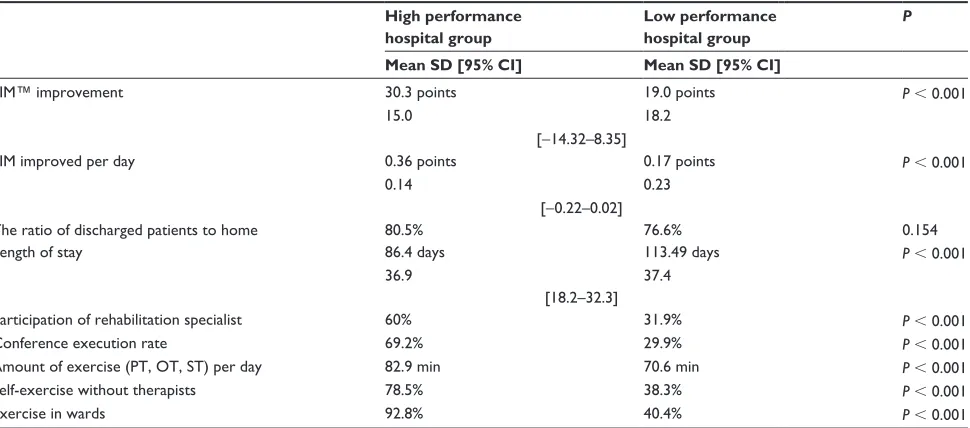
Group one was a hospital group with superior quality of health care (high performance group) and the other group was a hospital group with lower quality of health care (low performance group). The following elements were all analyzed: differences in the FIM improvement score, FIM improvement rate per day, the ratio of dis-charged patients to home, length of stay, participation of physician registered as a rehabilitation specialist to JARM (Japanese Association of Rehabilitation Medicine), conference execution rate, amount of exercise (physical therapist [PT], occupational therapist [OT], and speech
C 10 B 11
F 7
E 8 H 5
G 6
D 9 A 12
L 1 K 2
J 3 I 4
0 5 10 15 20 25
Figure 1 results of cluster analysis.
Notes: highperforming hospitals and low performing hospitals were respectively identified and accordingly assigned to each cluster in order to test what factors influence the difference. The group rated as “poor” in terms of Functional independence Measure gain was used as a criterion for cluster analysis.
Clinical Audit downloaded from https://www.dovepress.com/ by 118.70.13.36 on 20-Aug-2020
Dovepress Quality of stroke rehabilitation in Japan
therapist [ST], in total) per day, self-exercise without a therapist, and exercise in wards. In all the items, except the ratio of discharged patients to home, there were statistically significant differences between those two groups (Table 3).
improvement in Functional independence Measure score
In the FIM score, widely used as criteria for ADL, the high performance hospital group improved by 30.3% on average at the time of discharge than at admission, while the low performance hospital group improved by 19.0% on average. In the FIM improvement rate per day, the high performance hospitals group improved by 0.36%, while the low performance hospitals group improved by 0.17%.
ratio of discharged patients
The high performance hospital group was 80.5% while the low performance hospital group was 76.6%, which shows there was no statistically significant difference between those two groups.
Average length of stay
The average length of stay for the high performance hospital group was 113.5 days, which was surprisingly longer compared with 86.4 days in the low performance hospital group.
Participation of physicians registered as rehabilitation specialists to the Japanese Association of rehabilitation Medicine
Sixty percent of rehabilitation specialists in the high perfor-mance hospital group participated compared with 31.9% in the low performance hospital group. The conference execution rate (more than once a week and by more than three types of specialists) showed 69.2% in the high performance hospital group carried out such an execution, while 29.9% in the low performance hospital group carried out such an execution.
Total daily exercise
Measuring the total amount of exercise with the PT, OP, and ST per day showed that the high performance hospital group spent 82.9 minutes on average per day while the low performance hospital group spent 70.6 minutes on average per day exercising.
In investigating the frequency of self-exercise without therapists, we found that 78.5% of the high performance hospital group carried out self-exercises without therapists compared with 38.3% of the low performance hospital group.
Measurement of exercise in the wards (compared to exercise in the rehabilitation care room), showed that 92.8% of the high performance hospital group carried out such exercises compared with 40.4% of the low performance hospital group.
Table 3 results of analyzing the differences between the high performance hospital group and the low performance hospital group High performance
hospital group
Low performance hospital group
P
Mean SD [95% CI] Mean SD [95% CI]
FiM™ improvement 30.3 points 19.0 points P , 0.001
15.0 18.2
[-14.32–8.35]
FiM improved per day 0.36 points 0.17 points P , 0.001
0.14 0.23
[-0.22–0.02]
The ratio of discharged patients to home 80.5% 76.6% 0.154
Length of stay 86.4 days 113.49 days P , 0.001
36.9 37.4
[18.2–32.3]
Participation of rehabilitation specialist 60% 31.9% P , 0.001
Conference execution rate 69.2% 29.9% P , 0.001
Amount of exercise (PT, OT, sT) per day 82.9 min 70.6 min P , 0.001
self-exercise without therapists 78.5% 38.3% P , 0.001
exercise in wards 92.8% 40.4% P , 0.001
Notes: The conference execution rate is based on the fact that people with more than three types of occupation took part in the conference more than once a week. However, the definition of the conference execution rate was not clear in the data provided before 2008.
Abbreviations: SD, standard deviation; CI, confidence interval, P, probability; FiM, Functional independence Measure; OT, occupational therapist; PT, physical therapist; sT, speech therapist.
Clinical Audit downloaded from https://www.dovepress.com/ by 118.70.13.36 on 20-Aug-2020
Dovepress Jeong et al
Discussion
In previous research on the effects of rehabilitation inter-ventions, increased functional skills on admission to rehabilitation, early initiation of rehabilitation services, and rehabilitation in an interdisciplinary versus multi-disciplinary setting have been shown to improve ADL.11
In this study we examined whether such factors differed between hospitals. In particular, we looked for factors that are important in Japan. We used a two-step method to find out whether there were differences between hospitals in the distributions of improvements in ADL. First, we used patients’ data to predict what FIM score would be at the time of discharge. Then, as the index of ADL improve-ment, we used the difference between the predicted and the actual FIM at the time of discharge. Next, we looked for differences between those hospitals with relatively greater ADL improvement and those with relatively less ADL improvement.
Although FIM score was predicted at the time of dis-charge in the same case mix conditions by adjusting for triage at admission, each hospital showed a variety of differences from the measurement value. As a result of analyzing which factors produced the differences among the hospitals, it was found that there was a difference in the pattern that each hospital provides health care services.
We examined each hospital’s structure and process of providing health care services represented by the participa-tion of physicians registered as a rehabilitaparticipa-tion specialists to JARM and the execution of conferences, and found that the hospital group with high performance showed partici-pation and execution rates over two times more than in the hospitals group with low performance. This result confirms prior research, and emphasizes the importance of providing rehabilitative health care services by PT, OT, ST, nurses, and ward staff in addition to rehabilitation specialists (Stroke Unit).12–19
In the amount of exercise per day, self-exercise rates, and ward-exercise execution rates, it was found that the hospital group with high performance had more patients exercising than the other hospital group with low performance.
In Japan, all residents are provided with social insurance for medical expenses. For treatments including rehabilitation, PT, OT, and ST, the amount of time given to each treatment must be reported, and reimbursement is limited to the cost of 180 minutes per day. However, that limit was not set on the basis of any evidence. This study provides evidence of the effects of PT, OT, ST, exercise in wards, and self-exercise without therapists.
Patients exercised for about 12 to 13 minutes more per day in the hospital group with high performance than in the hospital group with low performance. This is a relatively large difference even when allowing that the criterion for health care treatment puts a limit on exercise per day at 180 minutes in Japan. While this data is not explored in this study, if the results of cluster analysis as shown in Figure 1 were divided into three groups, Hospital A would be in a class of its own. Hospital A was a medical organization that showed far superior therapeutic achievements to all the other hospitals. We asked Hospital A for an interview and found that since the hospital had not been open to the public for a long time, there were more health care staff than patients. Our interview found that regardless of the actual time period prescribed by health care criterion, the health care staff actively encouraged patients to take more exercise.
Considering that the limitation of exercise to 180 minutes per day in Japan is far from the standards introduced by the US stroke rehabilitation guidelines,19 we anticipate that
improvements in results will be seen if hospitals increase the amount and frequency of exercise beyond the maximum limit required in Japan.
In the same context, the increases in self-exercise execution rates and ward-exercise execution rates are due to escalating therapeutic achievements that are possible. In addition, therapeutic achievements show the importance of daily exercise for patients rather than by separating the wards from physical therapy rooms and exercising only for rehabili-tation. In order to promote and increase the total amount of patient exercise and so on in wards, the health care patterns in hospital teams needs to be systematized more concretely and realistically.
The present finding that more intense training was associ-ated with greater improvement in ADL is consistent with the results previously reported.20–23
Meanwhile, there was no significant difference in the ratio of discharged patients to home between the hospital group with superior therapeutic achievements and the hospital group with inferior therapeutic achievements. A re-examination of the appropriateness of the ratio of discharged patients to home, one of the P4P assessment criteria applied to recovery rehabilitation wards presently in Japan, may show whether it is an appropriate criterion.
There is a high possibility that there may exist a number of confounding factors in addition to the endeavor of medi-cal teams and the hospital system likely to affect patient decision-making in discharging from hospital to home. For
Clinical Audit downloaded from https://www.dovepress.com/ by 118.70.13.36 on 20-Aug-2020
Dovepress Quality of stroke rehabilitation in Japan
instance, when the conditions of patients were the same at the time of discharge, there was a 20.2% difference in the ratio of discharge to patients’ homes, depending on their different environments, such as patients’ domestic circumstance, and whether or not they could be nursed.
Limitations of the findings
The Rehabilitation Patient Databank used in this study went through seven updates over 3 years, with measures taken to ensure its reliability. Although there was a manual of data-entry procedures, we can not be absolutely sure that all of the physicians and therapists who entered data into the system used the same criteria in their evaluations. In addi-tion, we studied variables related to rehabilitation therapy and ADL, but we were not able to control for medical find-ings other than those related to post-stroke rehabilitation. However, all of the hospitals that participated in this study actively cooperated with efforts to improve the quality of rehabilitation treatment in Japan. We divided the hospitals into high-performing and low-performing groups, and there may be some limit to the generalizability of these findings to all rehabilitation hospitals in Japan.
Conclusion
This study focused on patients in recovery in the reha-bilitation ward using the data of 680 patients from 12 hospitals after adjusting for triage at admission obtained from the databank (issued in September, 2009) in Japan and compared the therapeutic results of each hospital. The comparison found that there were statistically significant differences in the results of therapeutic achievement in each hospital. In the hospital group with superior therapeu-tic achievements, there were greater amounts of exercise and a higher participation rate of rehabilitation specialists compared with the other hospital groups with inferior therapeutic achievements, which suggests the importance of frequent health care treatments and exercise.
Due to the assessments for health care quality and the publication of results conducted in a number of first world countries such as the US and the UK, it is expected that health care providers will put in voluntary effort to improve their future health care services. Nevertheless, prior to such effort of medical providers, the development of criteria to assess health care quality and to verify their validity is required.
Acknowledgments
This study was funded by Pfizer Health Research Foundation Japan (2008). The Rehabilitation Patients Data Bank of Japan
was developed with financial support from the Health Labour Sciences Research Grant of Japan (2007–2009).
Disclosure
The authors report no conflicts of interest in this work.
References
1. Jeong S, Kondo K, Inoue Y. Pay for performance in USA and suggestion
to Japan. Shakai Hoken Jyunpo. 2009;2397:20–25.
2. Doran T, Fullwood C, Gravelle H, et al. Pay-for-performance programs
in family practices in the United Kingdom. N Engl J Med. 2006;
355(4):375–384.
3. Mehrotra A, Damberg CL, Sorbero ME, Teleki SS. Pay for performance
in the hospital setting: what is the state of the evidence? Am J Med Qual.
2009;24(1):19–28.
4. Ottenbacher KJ, Hsu Y, Granger CV, Fiedler RC. The reliability of the
functional independence measure: a quantitative review. Arch Phys Med
Rehabil. 1996;77(12):1226–1232.
5. Hamilton BB, Laughlin JA, Fiedler RC, Granger CV. Interrater reliability
of the 7-level functional independence measure (FIM). Scand J Rehabil
Med. 1994;26(3):115–119.
6. Granger CV, Deutsch A, Linn RT. Rasch analysis of the Functional
Independence Measure (FIM) mastery test. Arch Phys Med Rehabil.
1998;79(1):52–57.
7. Keith RA, Granger CV, Hamilton BB, Sherwin FS. The functional
independence measure: a new tool for rehabilitation. Adv Clin Rehabil.
1987;1:6–18.
8. van Swieten JC, Koudstaal PJ, Visser MC, Schouten HJ, van Gijn J. Interobserver agreement for the assessment of handicap in stroke patients.
Stroke. 1988;19(5):604–607.
9. Banks JL, Marotta CA. Outcomes validity and reliability of the modified Rankin scale: implications for stroke clinical trials: a literature review
and synthesis. Stroke. 2007;38(3):1091–1096.
10. Quinn TJ, Dawson J, Walters MR, Lees KR. Reliability of the modified
Rankin Scale: a systematic review. Stroke. 2009;40(10):3393–3395.
11. Cifu DX, Stewart DG. Factors affecting functional outcome after stroke:
a critical review of rehabilitation interventions. Arch Phys Med Rehabil.
1999;80:S35–S39.
12. Langhorne P, Pollock A. What are the components of effective stroke
unit care? Age Ageing. 2002;31:365–371.
13. Stroke Unit Trialists’ Collaboration: Collaborative systematic review of the randomized trials of organized inpatient (stroke unit) care after stroke.
Stroke Unit Trialists’ Collaboration. BMJ. 1997;314:1151–1159.
14. Stroke Unit Trialists’ Collaboration. Organised inpatient (stroke unit)
care for stroke. Cochrane Database Syst Rev. 2007;(4):CD000197.
15. European Stroke Organisation (ESO) Executive Committee, ESO Writ-ing Committee. Guidelines for management of ischaemic stroke and
transient ischaemic attack. Cerebrovasc Dis. 2008;25(5):457–507.
16. Leys D, Ringelstein EB, Kaste M, Hacke W. The main components of
stroke unit care: results of a European expert survey. Cerebrovasc Dis.
2007;23(5–6):344–352.
17. Govan L, Weir CJ, Langhorne P. Organized Inpatient (Stroke Unit)
Care for Stroke. Stroke. 2008;39:2402–2403.
18. Alberts MJ, Latchaw RE, Selman WR, et al. Recommendations for comprehensive stroke centers: a consensus statement from the Brain
Attack Coalition. Stroke. 2005;36(7):1597–1616.
19. Juby LC, Lincoln NB, Berman P. The effect of a stroke rehabilitation unit on functional and psychological outcome: a randomized controlled
trial. Cerebrovascular Dis. 1996;6:106–110.
20. Agency for Health Care Policy and Research (AHCPR). Post-stroke
rehabilitation: assessment, referral, and patient management. Rockville, MD: AHCPR; 1995.
21. Kwakkel G. Impact of intensity of practice after stroke: issues for
consideration. Disabil Rehabil. 2006;28:823–830.
Clinical Audit downloaded from https://www.dovepress.com/ by 118.70.13.36 on 20-Aug-2020
Clinical Audit
Publish your work in this journal
Submit your manuscript here: http://www.dovepress.com/clinical-audit-journal
Clinical Audit is an international, peer-reviewed, open access journal focusing on the processes and outcomes of clinical audit in any area of healthcare. All aspects of patient care are addressed within the journal and practitioners from all disciplines are invited to submit their work. Areas covered include: Publication of audits; How an audit has changed practice;
Practical tips on how to do audits and to avoid pitfalls; How audits have changed patient care; Calls and justifications for new audits. The manuscript management system is completely online and includes a very quick and fair peer-review system, which is all easy to use. Visit http://www.dovepress. com/testimonials.php to read real quotes from published authors.
Dovepress
Dovepress
Jeong et al
22. Kollen, B, Kwakkel G, Lindeman E. Functional recovery after stroke: a review of current developments in stroke rehabilitation research.
Rev Recent Clin Trials. 2006:1(1):75–80.
23. van Peppen RP, Kwakkel G, Wood-Dauphinee S, Hendriks HJ, van der Wees PJ, Dekker J. The impact of physical therapy on functional
outcomes after stroke: what’s the evidence? Clin Rehabil. 2004;18(8):
833–862.
Clinical Audit downloaded from https://www.dovepress.com/ by 118.70.13.36 on 20-Aug-2020