DEVELOPMENT AND VALIDATION OF RP-HPLC METHOD FOR THE ESTIMATION OF
DOLUTEGRAVIR AND RILPIVIRINE IN BULK AND PHARMACEUTICAL DOSAGE FORM AND ITS
APPLICATION TO RAT PLASMA
VEERASWAMI B*, NAVEEN VMK
Department of Chemistry, GITAM Deemed to be University, Visakhapatnam, India. Email: [email protected]
Received: 10 September 2018, Revised and Accepted: 10 October 2018
ABSTRACT
Objective: The present paper describes a simple, accurate, and precise reversed-phase high-performance liquid chromatography (HPLC) method for rapid and simultaneous quantification of dolutegravir (DTG) and rilpivirine (RPV) in bulk and pharmaceutical dosage form and rat plasma.
Methods: The chromatographic separation was achieved on Phenomenex C18 (150x4.6mm, 5µm). Mobile phase contained a mixture of 0.1% Ortho phosphoric acid and acetonitrile in the rato of 60:40 v/v, flow rate 1.0ml/min and ultraviolet detection at 262nm.
Results: The retention time of DTG and RPV was 4.35 min and 7.73 min, respectively. The proposed method shows a good linearity in the concentration range of 10–150 µg/ml for DTG and 5–75 µg/ml for RPV under optimized conditions. Precision and recovery study results are in between 98 and 102%. In the entire robustness conditions, percentage relative standard deviation is <2.0%. Degradation has minimum effect in stress condition and solutions are stable up to 24 h. DTG and RPV drugs are release 98% at 2 h in rat body.
Conclusion: This method is validated for different analytical performance parameters like linearity. Precision, accuracy, limit of detection, limit of quantification, robustness, and pharmacokinetic study were determined according to the International Conference of Harmonization (ICH) Q2B guidelines. All the parameters of validation were found in the acceptance range of ICH guidelines. The same method is also applied for plasma samples study in bioanalytical work.
Keywords: Reversed-phase high-performance liquid chromatography, Dolutegravir, Rilpivirine and rat plasma.
INTRODUCTION
Dolutegravir (DTG) marketed name as Tivicay is an antiretroviral medication [1] used together with other medication to treat human immunodeficiency virus (HIV)-acquired immune deficiency syndrome [2]. It may also be used, as part of post-exposure prophylaxis [3] to prevent HIV infection following potential exposure [4]. It is taken by mouth. DTG is an HIV integrase strand transfer inhibitor [5] which blocks the functioning of HIC integrase [6] which is needed for viral replication.
RLP is a pharmaceutical drug [7-9] developed by Tibotec for the treatment of HIV infection [10]. It is the second-generation non-nucleoside reverse transcriptase inhibitor (NNRTI) with higher potency, longer half-life [11], and reduced side effect profile [12] compared with older NNRTIs such as efavirenz [13,14].
The literature survey revealed that there are only two methods reported high-performance liquid chromatography (HPLC) [15,16] and in ultraviolet (UV) spectrophotometric methods [17] two reports for only DTG [18,19]. There are no common methods for both quantitative analysis and bioanalytical [20] method.
The objective of the present work was the development and validation of a method for the estimation of DTG and rilpivirine (RPV).
METHODS Instrumentation
The analysis was performed on Water Alliance-e2695 chromatographic system equipped with a quaternary pump and photodiode array
detector-2996. Chromatographic software Empower-2.0 was used for data collection.
Chemicals and reagents
Acetonitrile (HPLC grade), orthophosphoric acid (HPLC grade), and water (HPLC grade) were purchased from Merck (India) Ltd., Worli, Mumbai, India. DTG and RPV reference standards were produced from Glenmark Pharmaceuticals Limited, Mahape, Navi Mumbai, India.
Chromatographic conditions
Chromatographic analysis was done using isocratic elution, mobile phase in the ratio of acetonitrile: buffer (0.1% o-phthaldialdehyde) (60:40 v/v) was filtered through 0.45 µ membrane filter paper. The flow rate of the mobile phase was monitored at 1.0 ml/min and eluents were detected at 262 nm. By injecting the volume 10µl with a run time 10min.
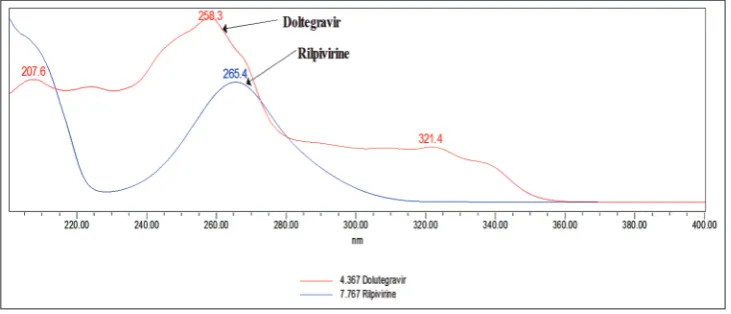
Selection of wavelength
Using photodiode spectrophotometer, the absorption spectra of the solution of two drugs are scanned in the UV region 200–400 nm spectra are shown in Fig. 1. The spectra of the DTG and RPV show at different λmax, namely 258.3 nm and 265.4 nm, respectively. By average, the two wavelengths at 262 nm were selected as detection wavelength for HPLC chromatographic method.
Preparation of standard solution
100 mg of DTG and 50 mg of RPV working standards were weighed accurately and transferred into a 100 ml volumetric flask. Added 70 ml of mobile phase sonicated for 20 min to dissolve the components makeup to the mark with diluent and mixed. After that, 5 ml of above solution diluted to 50 ml with mobile phase.
© 2019 The Authors. Published by Innovare Academic Sciences Pvt Ltd. This is an open access article under the CC BY license (http://creativecommons. org/licenses/by/4. 0/) DOI: http://dx.doi.org/10.22159/ajpcr.2019.v12i2.29669
Preparation of sample solution
Weighed 20 tablets and take the one tablet equivalent weight. Crush the 20 tablets into powder form take 10 tablets equivalent weight of sample into a 100 ml volumetric flask added 70 ml of diluent sonicated for 30 min after that makeup to the volume with diluent. Further diluted 5–50 ml with mobile phase and filtered through 0.45 µ nylon syringe filter.
Preparation of rat plasma sample preparation
The liquid-liquid extraction method was used to isolate DTG and RPV in rat plasma. For this, 100 µl of plasma sample (respective concentration) were added into labeled polypropylene tubes and vortexed briefly after that 2.5 ml of acetonitrile was added and vortexed for approximately 10 min followed by centrifuging at 4000 rpm at 20°C. Supernatant from each sample was transferred to labeled through tube and evaporated at 40°C until dryness. These samples were reconstituted with 500 µl of acetonitrile and vortexed briefly and then transferred the sample into autosampler vials for injection.
Validation System suitability
As per the test method, the standard solutions were prepared and injected into HPLC system from which the evaluated system suitability parameters are found to be within the limit.
Specificity
The specificity defined as the ability of the method to measure the analyte accurately and specifically in the presence of components present in the sample matrix was determined by analysis of chromatograms of drug-free and drug-added placebo formulation.
Linearity
The ability of the method to produce results those are directly or indirectly proportional to the concentration of the analyte in samples within a given range.
Precision
The degree of closeness of the agreement among individual test results when the method is applied to multiple samplings of a homogeneous sample. It is a measure of either the degree of reproducibility (agreement under different conditions) or repeatability (agreement under the same conditions) of the method.
Accuracy
The closeness of results was obtained by a method to the true value. It is a measure of the exactness of the method.
Limit of detection and quantification
The detection of limit and quantification limit for each analyte
concentration at which signal-to-noise ratio between 3 or 2:1 and 10:1, respectively, with defined precision and accuracy under the given experimental conditions.
Stability
Standard and sample solutions were subjected to 24 h stability at RT and 2–8°C. The stability of these solutions was studied and observed for changes in the area and retention time of the peaks which were then compared with the pattern of the chromatogram of the freshly prepared solution.
Robustness
Robustness of the method was studied by slightly changes in experimental conditions such as flow rate and organic composition. This was performed by same analyst with same instrument.
Ruggedness
Ruggedness of the method was studied using different source of analysts, instruments, wavelengths, and columns with same experimental conditions.
RESULTS AND DISCUSSION Method validation
In this method, system suitability, linearity, precision, accuracy, robustness, limit of detection (LOD), limit of quantification (LOQ), forced degradation, and stability are validated for the selected DTG and RPV drugs.
System suitability
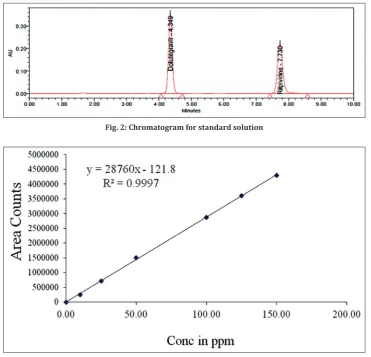
100µg/ml of DTG and 50µg/ml of RPV was prepared and injected into the HPLC system. Resolution of the DTG was 13.21 from the RPV. The number of theoretical plate counts for DTG and RPV was 6261 and 11,234 respectively. Tailing factor for DTG and RPV was 1.06 and 1.14, respectively (Fig 2).
Linearity
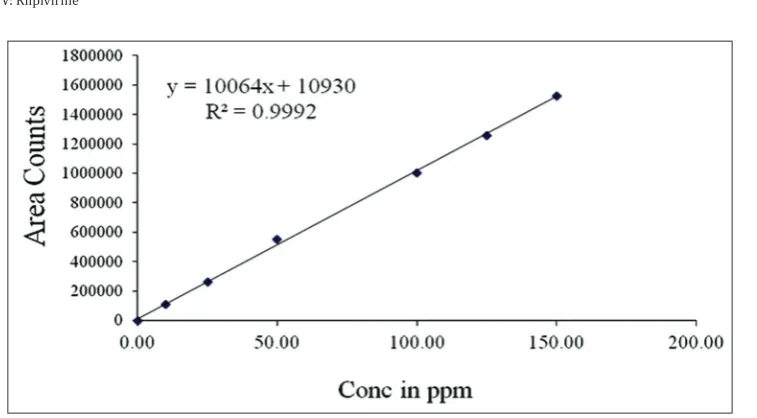
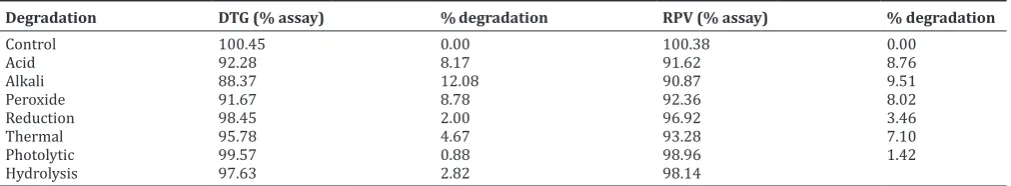
Linearity of the method was evaluated by preparing a standard solution containing 100 µg/ml of DTG and 50 µg/ml of RPV (100% of targeted level of the assay concentration). Sequential dilutions were performed to give solutions at 10, 25, 50, 100, and 150% of the target concentrations. These were injected and peak areas used to plot calibration curves against the concentration. The correlation coefficient values of these three analytes were 0.999. The results are shown in Table 1 and Figs. 3 and 4.
Limit of detection and quantification
their s/n values are 3 and 4, respectively. LOQ values for DTG and RPV were 0.1 µg/ml and 0.05 µg/ml their s/n values are 23 and 26, respectively.
Precision
Method precision was investigated by the analysis of six separately prepared samples of the same batch. From this, six separate sample solutions were injected to obtain their areas. The calculate mean and percentage relative standard deviation (RSD) values. The present method was found to be precise as percentage RSD of <2%, and also, the percentage assay values were close to being 100%. The results are given in Table 2.
Accuracy
Accuracy was determined by recovery studies which were carried out in three different concentrations levels (50, 100, and 150%). APIs with concentration of 50, 100, and 150 µg/ml of DTG; 25, 50, and 75 µg/ml of RPV were prepared. As per the test method, the test solution was injected three preparations each spike level and the assay was performed. The percentage recovery values were found to be in the range of 100.22–100.45% for DTG and 100.37–100.58% for RPV. RSD values were found to be <2%. The results are given in Table 3.
Ruggedness
Ruggedness of the method was studied and showed that chromatographic patterns did not significantly change when different HPLC system, analyst, and column. The value of percentage of RSD was <2% and exhibits the ruggedness of the developed method.
Robustness
Robustness of the method found to be percentage RSD should be <2%. Slightly variations were done in the optimized method parameters such Fig. 2: Chromatogram for standard solution
Fig. 3: Linearity plot for dolutegravir
Table 1: Results for linearity
Analytes Linearity range Equation of
calibration curve Correlation coefficient DTG 10.0–150.0 µg/ml Y=28760x+121.8 0.999
RPV 5.0–75.0 µg/ml Y=10064x+10930 0.999
DTG: Dolutegravir, RPV: Rilpivirine
Table 2: Results for method precision
Analyte Amount
present (mean) % assay (mean) % RSD of assay
DTG 100 mg 100.28 0.15
RPV 50 mg 100.14 0.26
DTG: Dolutegravir, RPV: Rilpivirine, RSD: Relative standard deviation
Table 3: Results for accuracy
% of target
conc. DTG (% recovery) DTG (% RSD) RPV (% recovery) RPV (% RSD)
50 100.22 0.24 100.37 0.58
100 100.38 0.45 100.46 0.67
150 100.45 1.01 100.58 0.64
as flow rate (±0.2%) and organic content in mobile phase (±5%). The results are given in Table 4.
Stability
Stability of standard and sample solutions is studied initial to 24 h in stored at room temperature and 2–8°C. They are injected at different time intervals. The difference between initial to 24 h percentage assay not more than 2.0%. There is no effect in storage conditions for DTG and RPV drugs. The results are shown in Table 5.
Forced degradation
Forced degradation conditions such as acidic, basic, oxidative, reduction, thermal, hydrolysis, and photolytic stresses were attempted as per the International Conference of Harmonization (ICH) guidelines Q1A (R2). There is an effect of assay results. The results are shown in Table 6.
Recovery study for rat plasma
DTG and RPV sample were injected into rat body collected samples at different time intervals such as 0, 0.5, 1.0, 1.5, 2.0, and 2.5 h. After that, sample is prepared as per test method injected into chromatographic system record their values. At 2 h, the sample reaches the maximum result, suddenly down to 2.5 h. Results are shown in Table 7. Moreover, plot is shown in Fig. 5.
CONCLUSION
This method described the quantification of DTG and RPV in bulk and pharmaceutical formulation as per the ICH guidelines. The developed
method was found to be accurate, precise, linear, and reliable. The advantage lies in the simplicity of sample preparation and the cost economic reagents were used. In addition, two compounds are eluted within 10 mins. Moreover, also, same method is used for bioanalytical plasma samples. The proposed HPLC conditions ensure sufficient resolution and the precise quantification of the compounds. Statistical analysis of the experimental result indicates that the precision and Table 4: Results for robustness
Drug
name Flow plus (1.2 ml/min) (% RSD) Flow minus (0.8 ml/min) (% RSD) Org. plus (55+45) (% RSD) Org. minus (65+35) (% RSD)
DTG 0.12 0.51 0.27 0.87
RPV 0.28 0.37 0.41 0.74
DTG: Dolutegravir, RPV: Rilpivirine, RSD: Relative standard deviation
Fig. 4: Linearity plot for rilpivirine
Fig. 5: Recovery plot for rat plasma Table 5: Results for stability
Time
intervals DTG (% assay) % difference RPV (% assay) % difference
Initial 100.58 0.00 100.34 0.00
12 h 100.36 0.22 100.27 0.07
18 h 100.24 0.14 100.15 0.12
24 h 100.13 0.11 100.08
reproducibility data are satisfactory. The developed chromatographic method can be effectively applied for routine analysis in drug research.
AUTHORS’ CONTRIBUTION
Veeraswami B has provided the design, intellectual content, innovations, and protocol for conducting the experiment along with mentorship. Naveen VMK has majorly performed the analysis in laboratory, literature collection, and sincerely authored the article.
CONFLICTS OF INTEREST
The authors declare that there are no conflicts of interest regarding the publication of this article.
REFERENCES
1. Moore RD, Chaisson RE. Natural history of HIV infection in the era of combination antiretroviral therapy. AIDS 1999;13:1933-42.
2. British Medical Association. British National Formulary. 69th ed.
London: BNF; 2015. p. 429.
3. Landovitz RJ, Currier JS. Postexposure prophylaxis for HIV infection. N Engl J Med 2009;361:1768-75.
4. ViiV Healthcare. Juluca (dolutegravir and rilpivirine) tablets prescribing information. The American Society of Health-System pharmacists, Research Triangle Park, NC; Nov 2017.
5. Steigbigel RT, Cooper DA, Kumar PN, Eron JE, Schechter M, Markowitz M, et al. Raltegravir with optimized background therapy for
resistant HIV-1 infection. N Engl J Med 2008;359:339-54.
6. Takao M. Non-enzymatic functions of retroviral integrase: The next target for novel anti-HIV drug development. Virology 2011;2:210. 7. Drug definition US FDA Drug approval process, Phar Pharma J.
Avaliable from: www.pharmacistspharmajournal.org, 2010. 8. US Federal Food, Drug and Cosmetic Act, Sec 210; 2008. 9. Directive of the European Parliament and of the Council; 2004. 10. Stellbrink HJ. Antiviral drug in the treatment of AIDS. Eur J Med Res
2007;12:483-95.
11. Lin VW, Cardenas DD. Spinal Cord Medicine. New York: Demos Medical Publishing, LLC; 2003. p. 251.
12. International Conference on Harmonisation of Technical Requirements For Registration of Pharmaceuticals For Human Use. Guideline for Good Clinical Practice 2014. p. 2.
13. Goebel F, Yakovlev A, Pozniak AL, Vinogradova E, Boogaerts G, Hoetelmans R, et al. Short-term antiviral activity of TMC278-a novel NNRTI-in treatment-naive HIV-1-infected subjects. AIDS 2006;20:1721-6.
14. Poznaik A, Ramirez M, Mohap L. 48-week Primary Analysis of Trail TMC 278-C204: TMC 278 Demonstrate Potent and Sustained Efficacy in ART-Naive Patients. 14th Conference on Retroviruses and
Opportunistic Infections; 2007.
15. Joseph J, Hepsbeah NJ, Deepthi K. Analytical method development and validation for the simultaneous estimation of dolutegravir and rilpivirine using RP-HPLC method in both bulk and pharmaceutical dosage form. Eur J Biomed Pharm Sci 2016;3:237-43.
16. Damel MC, Prdeshi AN. Stability indicating HPLC method for rilpivirine and dolutegravir sodium. Eur J Biomed Pharm Sci 2017;4:454-9.
17. Cozzi V, Charbe N, Baldelli S, Castoldi S, Atzori C, Cattaneo D, et al.
Development and validation of a chromatographic ultraviolet method for the simultaneous quantification of dolutegravir and rilpivirine in human plasma. Ther Drug Monit 2016;38:407-13.
18. Satyadev TN, Ch B, Sundar BS. Development and validation of high performance liquid chromatographic method for the determination of dolutegravir in human plasma. Pharm Sin 2018;6:65-72.
19. Balasaheb BG, Balasaheb AK, Subhash TR, Jijabapu K, Sudhakar PS. Development and validation of UV spectrophotometric method for estimation of dolutegravir sodium in tablet dosage form. Malaysian J Anal Sci 2015;19:1156-63.
20. Brain PB. Welcome to bioanalysis. Bioanalysis 2009;1:1-2. Table 6: Results for forced degradation
Degradation DTG (% assay) % degradation RPV (% assay) % degradation
Control 100.45 0.00 100.38 0.00
Acid 92.28 8.17 91.62 8.76
Alkali 88.37 12.08 90.87 9.51
Peroxide 91.67 8.78 92.36 8.02
Reduction 98.45 2.00 96.92 3.46
Thermal 95.78 4.67 93.28 7.10
Photolytic 99.57 0.88 98.96 1.42
Hydrolysis 97.63 2.82 98.14
DTG: Dolutegravir, RPV: Rilpivirine
Table 7: Recovery study in rat plasma
Time intervals (h) DTG (ng/ml) RPV (ng/ml)