R E S E A R C H
Open Access
Multi-point fairness in resource allocation
for C-RAN downlink CoMP transmission
Anthony Beylerian
1*and Tomoaki Ohtsuki
2Abstract
We investigate the resource allocation dynamics of Coordinated Multi-Point (CoMP) transmissions in a Cloud‘ Radio Access Network (C-RAN) deployment. In this context, we propose a service-aware user-centric scheme that achieves fairness in a multi-point fashion for the downlink. This approach operates in time-frequency and space, assuming a fixed power per transmitter. The scheme adaptively chooses overlapping clusters of serving stations on a per-user basis and effectively schedules the users in their preferred sets. We show how throughput and delay improvements can be achieved fairly for both center and edge users, with QoS considerations in the time domain and a Product of Metrics (POM) in the frequency domain that prunes the user-centric clusters.
Keywords: C-RAN, CoMP, Resource allocation, User-centric, QoS
1 Introduction
It is known that the mobile radio access networks’ (RAN) current capacities will become exhausted due to increases of digital services. Towards the next generation of mobile networks, many concepts have been proposed to improve on the operational performances, on several layers of the network architecture. One emerging concept is Coor-dinated Multi-Point (CoMP), which evolved from dis-tributed antenna systems (DAS), where in the downlink, several serving stations coordinate their transmissions to users.
In general, there are two schools of thought for CoMP systems. The first is based on interference mitigation, meaning that the objective of coordination would be to minimize and ideally nullify the interference between coordinated transmitters. Many approaches fall under this category, mainly so called coordinated scheduling (CS) which is similar to Inter-cell Interference Coordination (ICIC) and coordinated beam-forming (CB). The second approach is based on fusion, in which transmitters simul-taneously transmit to a target user (constructive interfer-ence) where the different streams are fused. In the CoMP literature, these approaches are mainly referred to as joint transmission (JT) or joint processing (JP).
*Correspondence: [email protected]
1Graduate School of Science and Technology, Keio University, 3-14-1 Hiyoshi, Kohoku-ku, 223-8522 Yokohama, Japan
Full list of author information is available at the end of the article
Although its is possible to achieve attractive perfor-mance gains with interference mitigation techniques, these gains remain limited due to the performance degra-dation at cell edges, as well the fact that they do not fully exploit the available diversity. On the other hand, JT/JP approaches have potential for larger performance gains, due to the expected increases in signal strengths at the receivers, since multiple distributed transmitters are uti-lized. Jointly transmitting from multiple stations would also provide enhanced coverage, particularly at the cell edges, smoother handovers, as well as the possibility to coordinate multiple classes of serving stations (Macro, Pico, Femto), making it very flexible from an operational perspective. JT/JP can operate coherently as well as non-coherently, where in the latter, the transmissions to a user carry the same signal but without prior phase-alignment and tight synchronization, making it less of a burden on the back-haul.
Resource allocation is a core task in order to coordinate transmissions. It is widely acknowledged that traditional distributed solutions for resource allocation are in fact sub-optimal, since they only rely on local network infor-mation at each serving station. Sub-optimality is mainly due to the lack of global network information, particularly from the nearby stations. Some proposals tackle the issue through information sharing, as well as self-organized and cognitive approaches. However, in the new Cloud Radio
Access Network (C-RAN) architecture, and its enhanced version Advanced C-RAN [1], the traditional distributed scheme is replaced by a centralized one, in which only the radio units need to be remotely deployed, whereas the rest of the functionality is shifted to regional centralized con-trollers. In such a scheme, many tasks such as resource allocation, which were previously solved sub-optimally by distributed solutions, with local network information, can benefit from the centralized global perspective.
On the other hand, since resource allocation mainly relies on the feedback of the channel state from users, when feedback delay is large, distributed solutions typ-ically perform better than centralized solutions, as for example shown in [2]. However, with recent advances in back-haul design, achieving much lower latencies and larger bandwidths, the centralized approach, which was only feasible in ideal back-haul conditions, is expected to be achievable in regional scenarios, with more relaxed constraints. In fact, some market solutions for both indoor and outdoor scenarios, such as [3] and [4] are starting to emerge following this model and offer promising results.
Naturally, in the actual system, the back-haul is not ideal and tests need to be conducted to determine the smallest achievable resource scheduling period, within budget costs and available equipment, in order to have the best possible adaptability to channel fluctuations. As for indoor scenarios, considering that the central unit could be installed in the same building, the constraints on feedback latency are much less of an issue than with outdoor scenarios. Nevertheless, even when updates on the wireless channel state are not timely (i.e. in outdoor with higher latencies), either stale information could still be used up to a certain extent, but with a penalty on performance, or in case the channel aging is too large, estimation/prediction techniques could be applied.
In any case, since the resource allocation strategies are at the core of the interference issue and since they directly influence the user experience, we believe investigating the scheduling policies in this context is worthwhile. Because of practical limitations concerning complexity, we also argue that lightweight and reactive schemes, relying on statistical channel information need to be considered. Therefore, in this study, we consider the non-coherent JT operation where the coordinated signals are construc-tively fused at reception, with a lighter overhead on the back-haul compared to its coherent counterpart. Our main goal in this context, is to design a resource allo-cation and scheduling approach that takes these consid-erations in mind for a C-RAN based network as well as being user-centric and achieving fairness in a multi-point fashion. Effectively, in the next section we discuss the related work and motivations of our study. Afterwards, we present the study model, followed by our assumptions and details about the proposed strategy. Finally, we analyze the
performances compared to other schemes and conclude on our study.
2 Motivations and related work
There are two main components to achieve downlink JT-CoMP at the level of the MAC-PHY interface, the first is clustering the transmit points and the second is the resource assignment or allocation. To mention, in the C-RAN architecture there are different dynamics to con-sider. This means clustering can be achieved differently and simultaneously on several layers, however for this problem the clusters are a set of coordinating transmit points (TP), which transmissions will be constructively combined.
In fact, recent surveys on CoMP such as [5], echo that although different approaches have been proposed, more research is required for dynamic cell clustering, as well as opportunistic and preferably low complexity scheduling. Effectively, dynamic cell clustering techniques have been previously proposed by different authors, and usually rely on optimizing certain targets such as geometry gain or good-put [6].
However, we argue that finding the best clusters opti-mizing such metrics should not be treated separately from resource scheduling, since for example the lack of resources from a clustered TP would render that TP use-less in the serving CoMP set. Although many researchers treat each problem separately, few others have worked on joint approaches such as [7].
The authors in [7] proposed to maximize the achievable rate by grouping users in three different ways and then scheduling them on a cluster-basis following a propor-tional fairness (PF) rule. Although their approach shows gains over static clustering, it is not fully user-centric since it does not allow for overlapping clusters and does not take into consideration the service type. We therefore, pro-pose to use overlapping clusters per user, multiplexed in both time and frequency domain, as explained in the next section.
Furthermore, if the CoMP sets are not adaptively cho-sen in a user-centric fashion, the scheduled resource blocks (RB) and TP combinations to serve disadvantaged users such as edge users, would not always yield the best results as the probability of outage could still be high. This is previously argued by authors in [6], who show that a UE-centric solution will be optimal in terms of both outage probability as well as throughput (so called good-put), although they only discuss it from a cluster-ing perspective but propose to extend their work with a distributed graph coloring scheme for the resource assignment.
introduce high complexity with a large number of colors [8], unless heuristics are used.
Moreover, in the actual case, user bearers are not homo-geneous, meaning that users have different quality of service (QoS) requirements depending on the higher layer application (i.e. Voice, Web, Video, Gaming). Besides, the scheduling approach should give higher priority to bear-ers with more stringent requirements on higher laybear-ers. For example, bearers carrying HTTP or FTP can allow for more delay by differing their resource reservations in the time domain, in case other bearers are competing for resources. This is because these bearer types do not carry real time traffic.
In addition, some services require a guaranteed bit rate (GBR) to achieve the required QoS for the users. There-fore, the scheduling should also be service-aware as to be able to consider each user bearer’s QoS class. Nat-urally, QoS awareness could be extended to quality of experience (QoE) awareness, depending on the definition of user experience one would like to consider. However, other types of considerations should be taken in the user experience paradigm such as mean opinion score (MOS) modeling [9]. To keep the study on point, we will only discuss the strategy from a QoS perspective.
Amongst other works, authors in [10] use fixed clus-ters and propose a simple PF approach but expand on the power allocation perspective. Also, in [11] authors use a basic PF approach but in a hetnet scenario with coordi-nation areas of up to 105 RRUs. Otherwise, other recent proposals try to model the problem as a cell muting prob-lem. For example, in [2] authors compared distributed and centralized solutions for cell muting, however they consider only static clustering for co-located servers. The problem with cell muting is that some TPs do not use all the available resources efficiently since they are powered off on the muted resources. In addition, authors such as in [12] proposed a proportional fair approach using message passing, however this is not optimal in C-RAN because it does not benefit from all of the available network infor-mation as well as could become more exacerbating, when considering inter-station communication delays, as their communication would be going through the central node. Furthermore, the resource allocation task can be solved following a joint optimization model with a target util-ity such as the sum rate. However, due to the existence of a large solution space when considering all dimensions, simple reactive heuristics yielding sub-optimal, but fea-sible solutions, are required for practicality. One way to reduce the operational complexity and still reach a fea-sible solution is to split the task into different domains (i.e. space, time, frequency, power).
To this end, it would make sense to design a scheduling process based on user-centric clusters and domain separa-tion. The approach would have to take into consideration
both the traffic type and the load at each TP. Because of this, we investigate how such a scheduling scheme can be service-aware as well as introduce a multi-point fair-ness scheme in both frequency and time domains, using a pruning approach by a Product of Metrics (POM) in the frequency domain. It would also be desired to achieve the following merits : a fully UE-centric solution, rely-ing on existrely-ing signalrely-ing mechanisms, followrely-ing fairness rules for both center and edge users, and being service-aware by supporting multiple QoS classes, as well as GBR traffic. Performances are then evaluated in three oper-ational scenarios, which are the traditional isolated cell scenario, static or fixed clustering as well as the proposed strategy.
3 Study model
3.1 Remote radio units
In an actual deployment, TPs are installed at different vantage points. These points are usually chosen after a planning process which relies on many factors, such as the site availability and the cost of site acquisition. Because of this, in an actual deployment, the serving stations are serendipitously distributed and their coverage areas do not usually follow typical hexagonal patterns. Therefore, for simulation, so called random network (RN) models are used to capture the randomness as worst cases of such deployments, where usually a Poisson point process (PPP) is used [13].
Briefly, a PPP is a point process following a Poisson distribution, which can be characterized by its dimension-ality, bounds and density. Point processes are stochastic tools that can be used to model the random distribu-tion of points in an multidimensional space. Due to their elegant properties and their tractability, PPPs have been increasingly used in wireless network analysis, often when simulating node locations in 2D space [13]. However, one shortcoming of PPPs is that they do not account for a min-imum Inter-Site Distance (ISD) between individual nodes, which is of practical importance, related to the techni-cal and economitechni-cal constraints during site planning and actual deployment. Because of this, repulsive or hard-core processes such as the Matérn hard-hard-core point process (M-HCPP) are needed to enforce this distance during sim-ulations. These processes are called hard-core processes, owing to the hard-core distance between the different points.
As for the C-RAN central unit connecting thes RRUs, it would consist of many virtualized base-band units (BBUs) for each remote radio unit, called a BBU pool. Further-more, it is assumed that on top of the BBU pool, there would be the scheduler that will coordinate all allocation decisions and stream them back to the concerned remote radio units.
3.2 Subscribers
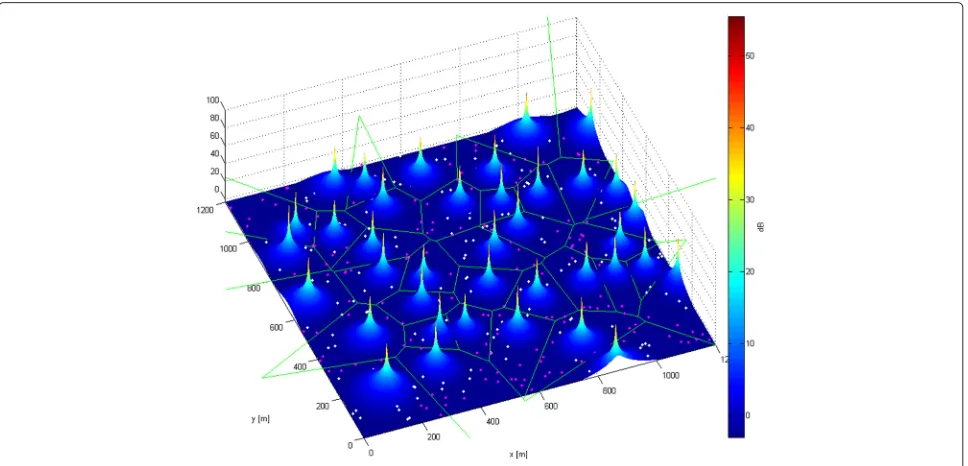
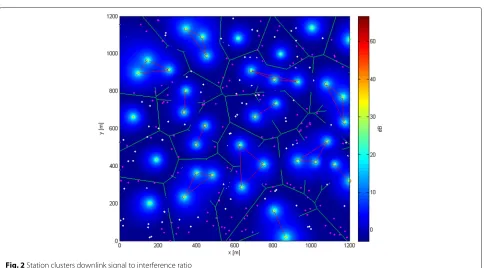
Subscriber user-equipment (UE) locations can be simu-lated using a regular PPP, due to the fact that a minimal distance between users cannot be expected. Therefore, these positions can be assumed as following a 2D-PPP. The subscribers’ and server nodes’ locations as well as the downlink (DL) signal to interference ratio (SIR) of the reference signals (RS) for from each server, can be visual-ized in the simulation space as in Figs. 1 and 2 (cut-off to −3 dB), to validate the coverage and spatial distributions. Edge users (magenta dots) and center users (white dots) are naturally all contained in the simulated coverage area (Voronoi cell) of their respective serving station (cell). Note that the Voronoi tessellation (green edges) overlaid in Fig. 1, delineating the DL coverage borders, is only valid when the same transmit power levels at each server station are used, which fits our assumptions in this inves-tigation. Should different transmit powers be used, the DL coverage areas will not respect the observed Voronoi tes-sellation. As for the coverage in Fig. 2, it does not follow the same tessellation since clustered stations (red edges) will transmit common signals for multi-point operation, however the same tessellation is kept for reference. From
this we can visually observe how the multi-point coverage area being is enhanced on the cell edges, as compared to the isolated scenario.
To note, users are classified as edge users if they are in the SIR hysteresis region, which means that the differ-ence between their maximal experidiffer-enced SIR from their strongest perceived station and the second highest expe-rienced SIR from another station (not belonging to their cluster in clustered scenarios) is less than a hysteresis threshold.
3.3 Antenna and propagation model
For antenna configurations, for the sake of simplicity we consider 2D-omni SISO antennas, as further improve-ments are expected to increase with other configurations when providing the extra diversity. As for the propa-gation model, we used large-scale fading with varying line-of-sight (LOS) and non-line-of-sight (NLOS) path-losses between the TPs and the users [14]. Because of this, some users not on the cell edge are sometimes considered as edge users if their channel conditions are worse, i.e. in NLOS.
3.4 Traffic model
To evaluate under practical traffic conditions, we need to simulate different application traffics. Next Generation Mobile Networks (NGMN) group recommends using a traffic mix [15] where FTP, HTTP, Video streaming, VoIP and Gaming services are simulated for better evaluation. We use this popular model for our simulations with simi-lar proportions. As for packet drops, a packet is dropped
Fig. 2Station clusters downlink signal to interference ratio
from the user’s buffer if its time in the buffer is larger than the maximum timeout value, defined in the standard QoS table [16].
4 Assumptions and proposed scheme
4.1 UE operation and clustering
In the traditional isolated cell scenario, each UE connects to its anchor station and reports its RS measurements fol-lowing the standard signaling mechanisms through Chan-nel Quality Indicator (CQI) values. Effectively, to chose its anchor, each UE averages SIR measurements over a cer-tain time window and then chooses the anchor based on the largest experienced value.
In the static clustering scenario, serving stations are clustered once and those clusters do not change. The clustering rule can vary i.e. from considering co-located stations, using inter-station path-loss, or can be done manually by a network planning team. For the sake of comparison, we consider the popular rule based on cou-pling loss, which represents the experienced path-loss between the stations. This means that stations that expe-rience the largest averaged estimated path-loss between each other that is lower than a threshold, are clustered together. An example of this for a maximum cluster size of three is shown in Fig. 2 where clustered TPs are con-nected with red edges. In this case, when a UE finds its anchor, it joins its fixed cluster, and later reports the SIR measurements of each station in that cluster. These mea-surements can be made on the primary reference signals from each TP. To mention, a dynamic clustering scheme
can also be achieved based on the user statistics, through what are called network-centric scenarios, however they would not be reactive enough to each user’s conditions.
Having static clusters, however, is sub-optimal as fixed clusters create cluster edges, instead of cell edges, in which the degradation could in fact become more pro-nounced. The desired operation would be to have the edge areas dynamically compensated by nearby transmit-ters whenever a user is active in its relative region of interest. This can is achieved with dynamic user-centric clustering, where the cluster is “centered” around each user. Therefore, in the latter case, we would have different overlapping clusters on each time-frequency pair per user. To know the preferred clusters per user, the UEs report SIR measurements, based on a relative SIR threshold rule, meaning only measurements related to stations that are part of the user’s CoMP set are reported to the central control unit (CCU).
to the three highest measurements to compare with the fixed clustering case, and impose a reasonable limit on the control traffic overhead as well as the scheduling complexity.
4.2 Scheduling operation
In the standard scenario, the scheduling is achieved per station. As for the coordinated scenarios, the scheduling is centralized at the CCU, where the UE measurement reports are collected. The proposed scheduler follows the time domain-frequency domain (TD-FD) approach to achieve fairness in both dimensions. The system energy efficiency may also be considered since we are using multiple TPs. However for this investigation we do not focus on energy efficiency and focus more on the other mentioned aspects. Nevertheless, although fixed power is assumed, the modulation and code rates would still adapt to changes in the link quality, depending on the SINR resulting from all joint transmissions.
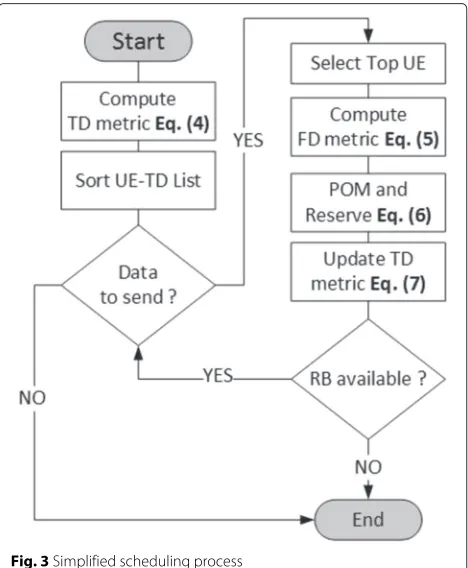
The high-level process is described in the simplified flow chart shown in Fig. 3. The intuition behind the pro-cess is that a user with the worst experience in time, should have priority to reserve a resource in frequency from its preferred serving stations. This is because we would like the allocations to be as user-centric as possible. Moreover, if in the first schedule (in time), the choice in frequency was unfair towards one user, it will be reflected
Fig. 3Simplified scheduling process
in his time metric, and will be optimally readjusted in fre-quency domain in the next schedule. In case we ordered the domains in the flow otherwise (first frequency and then time domain), we would be choosing the best user for each frequency block, which would not necessarily result in the best option for each user at that moment in time. Updates on preferred stations (in space domain) are assumed to be received from a feedback process, from which we use the resulting preferred set for each user. These user-station(s) sets are fixed during each iteration and are later pruned in the frequency domain.
The scheduling process starts by updating the TD met-ric for each active UE bearer (u) at time (t) based on the service type specified by its class weight (QoS). The class weight being the inverse of the service priority in the QoS table [16]. The values from the QoS table mainly reflect the overall desired priority for each type of stream. For example, for real-time services, the QoS weights should be typically higher than non-real time services. Therefore, as long as the values make sense in terms of the service type, different QoS values can also be used. The TD metric also depends on the maximum allowed delay () per ser-vice, the average historical rate (R) and average buffer wait time (δ) :
τ(u,t)= QoS(u) R(u,t) exp
βδ(u,t) (u)
, (1)
where
R(u,t)=(1−α)R(u,t−1)+
αRˆ(u,t−1), if u∈/U(t−1) 0, otherwise.
(2)
With α ∈[0, 1] a smoothing factor,β ∈[0, 1] a weight to determine how strongly the average delay exponentially affects the metric,Uis the set of scheduled user bearers, andRˆ is the user’s estimated instantaneous rate defined by :
ˆ
R(u,t)=K(u,t)×W× K(u,t)
k=1
log2(1+ ˆγk(u,t)), (3)
where K is the number of allocated resource blocks (RB), W the RB bandwidth and γˆ is the SIR estimated per RB with indexk. The estimation is done from channel state information (CSI), fed back from the users. When no previous information exists, the metrics (in both time and frequency) will not use CSI information. In this case, for the time domain, the metric is reduced to only the QoS weight. Otherwise, in a transitioning period, the average rate at the first iteration is only a discounted version of the average rate from the previous slot, because the estimated instant rate is zero.
sorted at each update. As for the reaction to delay fluctu-ations in (1), it is modeled with an exponential, in order to make the metric more reactive and emphasize their effect, since large delays will lead to packet drops. In this case, smaller changes in delay would make larger differences in the TD metric.
Users with GBR bearers need to achieve at least their target bit rate, but also should not be allocated more resources than required since that would over-allocate resources that would better serve other bearers. To provi-sion for this, we add an exponential weight to the metric based on the average rate (R) and guaranteed target rate (RGBR). Also, ifμis a binary variable representing the con-dition thatuhas a GBR bearer, the final metric becomes:
T(u,t)= QoS(u)
whereρis a weight similar toβ but for the rate fluctua-tions.
As for the default state, when there is no previous traf-fic, the TD metric consists of only the QoS weight. Also, sinceβandρcontrol the behavior of the exponent, if set with similar proportions, they will have similar effects on the overall average performance. However, depending on the actual values, the sensitivity to fluctuations will change with the exponent’s steepness.
Since there are different variables involved and several stages in the scheduler, finding an analytical proof for the best parameters to set is non-trivial. In fact, the choice of parameter combinations of β and ρ should be done experimentally, and is discussed in the following section. However, if we look at the expression of the metrics, we can have a better idea about the dynamics involved.
In the TD metric, the first ratio related to delay is an increasing function from 0–1. This is because packets cannot have a delay larger than the maximum allowed delay (they will be dropped). As for the second term related to the GBR rate, it is only included when the bearer is for a GBR service. However, in this case it is first a decreasing function from 1–0, when the average rate is lower than or equal to the GBR rate. For larger values, the term becomes negative since the ratio of GBR to average rate becomes larger than 1. This was designed to decrease the priority of GBR traffic that has already satisfied its target rate. In general, the priority of a GBR bearer is increased more than that of a non-GBR bearer (due to the extra positive term in the exponential) since its target rate needs to be guaranteed. However, when it does achieve it, its priority over non-GBR traffic will decrease in order to give non-GBR traffic the priority to chose its best resource set.
Afterwards, the bearer with the highest priority will be allocated a resource by first updating its FD metric per TP (r) in its CoMP set, per available resource block (k). The FD metric represents the RB preference per TP and is calculated following :
whereUkis the set of users previously served on RBk. The FD metric (5) represents the RB preference per TP (r). A higher value of this metric means that at timet, useruwill prefer resource blockkfrom TP r. The neutral score in this metric is 1 since it will be used in a product in the next step. Otherwise, when the expected rate will not improve nor degrade the average historical rate on that block, the ratio will also tend to become 1. In both cases when no previous information exists or in the transitioning period, the FD metric is set to 1 as following equation (5) in the first case.
Next, for a clusterC = {TP1,TP2,. . .,TPM}, of maxi-mum sizeM, we define a sub-clusterSas any combination of TPs existing inC. For all sub-clusters of useru, we then calculate the product of metrics (POM) on each resource blockkas:
k(u,S,t)= r∈S
φk(u,r,t),∀S⊂C. (6)
For M = 3 we will have in total seven combinations to compute and then choose the combination that maxi-mizes the POM: arg max(k,S)k(u,S,t).
The POM was designed to reduce the overhead as well as to achieve implicit load balancing. In fact, overhead is an issue in CoMP based schemes and is difficult to con-sider during scheduling because it depends on each user’s activity. However, in order to reduce the impact of high overhead, we can limit the cluster size to three TPs.
Also, when a cell is highly loaded, certain users might not be able to be allocated resources in a certain schedul-ing period. In this case, first, this increases their TD metric, since the average rate term will become smaller and the delay term larger. These users will have the pri-ority to select a resource in the frequency domain in the next period, where the candidate set for clustering might be different, depending on the user reports. Second, in the frequency domain, if the FD metric for one TP on a certain frequency block is low, the likelihood that the scheduler will chose another TP sub-cluster/block combination after computing the POM will increase. This is because the val-ues of the FD metric fluctuate around the value of 1 due to the fact that selecting the same block will either contribute to or deteriorate the average rate on that block from that transmitter.
allocations for users that do not really need them. For example, a UE in better conditions (experienced rate) with regard to two out of three of its TPs in the CoMP set on a certain frequency resource, would prefer reserving the FD slot from only the best two TPs, allowing the unreserved resources from the third TP to be reserved by other users. Otherwise, if it has no experience with a specific TP, it is given a neutral score of one in the product and a sub-cluster is chosen accordingly. This formulation allows us to achieve fairness with multiple transmit points per data stream between the users.
By limiting the cluster size and adding our pruning approach using the POM, we reduce both the amount of measurement information to feedback by the users (by the upper limit) as well as the control messages to stream to each station per scheduling interval, since only the use-ful configuration will be sent. Effectively, after a RB is reserved in the schedule of the selected TPs, it is removed from the search space for the following iterations. Subse-quently, we update the TD metric for the chosen user with highest priority and repeat the process until either the resources are depleted or there is no more data to trans-mit. The update used can be linear in its simplest form and is based on the number of allocated resources as follows:
T(u,t)= T(u,t)
K(u,t)+1. (7)
This update is needed to avoid resource starvation in cases where some users would have much larger priority compared to others sharing TPs in their cluster sets, and forces more fairness on the scheduling process.
5 Performance evaluation
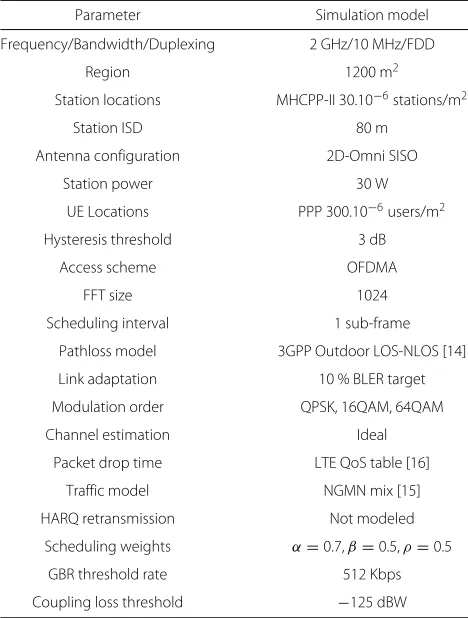
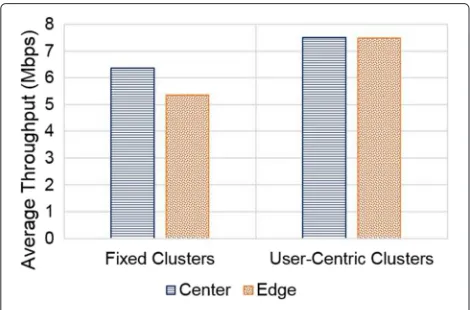
We have simulated different network scenarios using MATLAB 2015a 64-bit running on multiple machines. The implementation was run with the parameters sum-marized in Table 1, leading to the results shown in Figs 4, 5 and 6. In these figures, “PF FD-TD” represents the tra-ditional isolated cell approach using a PF scheduler aug-mented with our modifications for FD and TD metrics. In this case, no coordination is done and the scheduling for each remote radio unit is independent as in a distributed scenario. This means there are no joint transmissions per-formed and each user receives from only one transmitter at a time. In the “Fixed Clusters” scenario, clusters are fixed and are formed based on coupling loss. In “User-Centric Clusters”, clusters are dynamically chosen in a user-centric fashion. We measure the average throughput and packet delay. Packet delay refers to the difference in time when a packet enters the buffer until it reaches its destination (fully received).
As we can see from Figs. 4, 5 and 6, the average user throughput and packet delay improve with clustering
Table 1Simulation Configuration
Parameter Simulation model
Frequency/Bandwidth/Duplexing 2 GHz/10 MHz/FDD
Region 1200 m2
Station locations MHCPP-II 30.10−6stations/m2
Station ISD 80 m
Antenna configuration 2D-Omni SISO
Station power 30 W
UE Locations PPP 300.10−6users/m2
Hysteresis threshold 3 dB
Access scheme OFDMA
FFT size 1024
Scheduling interval 1 sub-frame
Pathloss model 3GPP Outdoor LOS-NLOS [14]
Link adaptation 10 % BLER target
Modulation order QPSK, 16QAM, 64QAM
Channel estimation Ideal
Packet drop time LTE QoS table [16]
Traffic model NGMN mix [15]
HARQ retransmission Not modeled
Scheduling weights α=0.7,β=0.5,ρ=0.5
GBR threshold rate 512 Kbps
Coupling loss threshold −125 dBW
compared to a standard isolated cell scenario. Further-more, for the dynamic approach the throughput is high compared to the fixed approach, for both center and edge users. Moreover, we also notice that with the dynamic approach, the difference in average throughputs between edge and center users is small compared to the other approaches, keeping a fairer balance between both types of users, while at the same time allowing for the through-put differentiation to occur only per traffic type as we can
Fig. 5Average delay
see in Fig. 4 for GBR vs. Non-GBR. This is mainly because in static clusters, we still have a cluster edge whereas in dynamic clustering, the effect of being on the cell edge is compensated by more efficient dynamic coordination, since clusters are chosen per user.
Furthermore, the main gain in throughput is in the non-GBR traffic as shown in Fig. 4. This is because the non-GBR traffic attempts to satisfy its rate requirement but then the bearer priority is decreased the more it goes higher than the rate requirement. How stringent we want this behavior to be can be set by the parameterρ. In Fig. 5, we can see that the average packet delay is a slightly higher than 10 ms (1 frame time) and is somewhat improved in the clustering scenarios. The effect on delay can also be controlled by the
βparameter.
Effectively, if we look at Fig. 7 where we show five rep-resentative cases, we can see that on one hand, when we give more weight to the delay fluctuations, the average delay decreases but so does the throughput. Conversely, when we increase the weight for the rate fluctuations, the throughput is improved compared to the case where the weights are the same but inversed, however it is not yield
Fig. 6Edge vs. center throughputs
Fig. 7Metric parameter selection
the best throughput. We can say that in this case, the delay is enhanced by sacrificing the average throughput.
In fact, when reacting faster to fluctuations in delay (by increasingβcompared toρ), the scheduler will give pref-erence to users with a high amount of delay, regardless of their rate class (GBR or non-GBR). Therefore whenβ is high, the scheduler would have a behavior mainly aiming to decrease packet drops that are due to timeouts (when delay is higher than maximum allowable delay). This happens since the delay is the major contributor to the TD metric, because the related term is in the exponent, whereas the average rate is only directly inversely pro-portional. This lowers the average delay, but also lowers the average throughput, due to the inadequate policy. The scheduling in this case is inadequate regarding through-put, because users with particularly high delay are more frequently prioritized.
On the other hand, when reacting faster to fluctuations in throughput (by increasingρcompared toβ), the oppo-site behavior occurs. Particularly for GBR traffic, streams that have not yet achieved their GBR rate are increas-ingly favored, while those that did, are disfavored. In other words, this means the scheduler will follow a policy that cares more about satisfying GBR users. In this case, the effect of delay becomes less important compared to throughput (regardless of GBR or non-GBR), which leads to loss of performance due to an increase in packet drops. Therefore, if the objective would be to maximize throughput, a balance between the two weights β and
6 Conclusion
In this paper we have studied resource allocation in the C-RAN CoMP paradigm using non-coherent JT, and have introduced a service-aware user-centric scheme for the downlink that achieves fairness in a multi-point fash-ion. When considering transmission from multiple TPs, user-centric schemes achieve the best results in terms of coverage and achievable rate. Service-awareness in scheduling must also be achieved considering that each user’s activity is different in terms of the traffic type. Effec-tively, the approach considers space, time and frequency domain perspectives while having a fixed value in the power domain, under a traffic mix of different services per user.
From our simulations, we have observed that we can expect that the proposed scheme could yield through-put improvements particularly for non-GBR traffic, while keeping the fairness between center and edge users and experiencing acceptable packet delays. However, for other practical aspects, we would still have to study and eval-uate the robustness to feedback delays and sensitivity to inaccuracies in channel estimation especially with coarse quantizations, as well as the system energy consumption trade-off (with power domain considerations), all of which are issues that would be interesting to further discuss for such type of schemes.
Competing interests
The authors declare that they have no competing interests.
Author details
1Graduate School of Science and Technology, Keio University, 3-14-1 Hiyoshi,
Kohoku-ku, 223-8522 Yokohama, Japan.2Department of Information and
Computer Science, Faculty of Science and Technology, Keio University, 3-14-1 Hiyoshi, Kohoku-ku, 223-8522 Yokohama, Japan.
Received: 30 July 2015 Accepted: 20 December 2015
References
1. NTTDOCOMO,DOCOMO to Develop Next-generation Base Stations Utilizing
Advanced C-RAN Architecture for LTE-Advanced. February 21, 2013
2. X Wang, B Mondal, E Visotsky, A Ghosh, Coordinated scheduling and network architecture for lte macro and small cell deployments. IEEE ICC Workshop, 604–609 (2014)
3. Airvana OneCell. www.airvana.com/products/enterprise/onecell/ 4. Artemis PCell. www.artemis.com/pcell
5. J Li, GY Niu, D Lee, J Fan, Y Fu, Multi-cell coordinated scheduling and mimo in lte. IEEE Com. Surveys and Tutorials.16, 761–775 (2014) 6. V Garcia, Y Zhou, J Shi, Coordinated multipoint transmission in dense
cellular networks with user-centric adaptive clustering. IEEE Transac. Wireless Com.13, 4297–4308 (2014)
7. P Baracca, F Boccardi, V Braun, A dynamic joint clustering scheduling algorithm for downlink comp systems with limited csi. ISWCS, 830–834 (2012)
8. T Szèp, Z Mann, Graph coloring: the more colors, the better? IEEE Int. Symp. Comput. Int. Informa, 119–124 (2010)
9. YH Cho, H Kim, S-H Lee, HS Lee, A QoE-aware proportional fair resource allocation for multi-cell ofdma networks. IEEE LCOMM (2014) 10. Q Yu, J Zhang, P Chen, B Cao, Y Zhang, Dynamic joint transmission for
downlink scheduling scheme in clustered comp cellular. IEEE ICCC (2013)
11. A Davydov, G Morozov, I Bolotin, A Papathanassiou, Evaluation of joint transmission comp in c-ran based lte-a hetnets with large coordination areas. IEEE Globecom (2013)
12. K Kwak, H Lee, HW Je, J Hong, S Choi, Adaptive and distributed comp scheduling in lte-advanced systems. IEEE VTC, 1–5 (2013)
13. H ElSawy, E Hossain, M Haenggi, Stochastic geometry for modeling, analysis, and design of multi-tier and cognitive cellular wireless networks: A survey. IEEE Commun. Surveys and Tutorials.15, 996–1019 (2013) 14. 3GPP, Further enhancements to lte time division duplex (tdd) for
downlink-uplink (dl-ul) interference management and traffic adaptation. TR 36.828 (V11.0.0)
15. NGMN, Ngmn radio access performance evaluation methodology. NGMN Technical Whitepaper. (NGMN Ltd., Frankfurt am Main, Germany, 2008) 16. 3GPP, Policy and charging control architecture. TS 23.203 (V13.2.0)
Submit your manuscript to a
journal and benefi t from:
7Convenient online submission
7Rigorous peer review
7Immediate publication on acceptance
7Open access: articles freely available online
7High visibility within the fi eld
7Retaining the copyright to your article