© 2015, IRJET.NET- All Rights Reserved
Page 875
Modelling and Prediction of NOx emissions from coal fired boilers:
Case study
Vineetha Morris J
1, Anumod D M
21
PG Student, Electrical and Electronics Dept, Amal Jyothi College of Engineering, Kottayam, Kerala, India
2Assistant Professor, Electrical and Electronics Dept, Amal Jyothi College of Engineering, Kottayam, Kerala, India
---***---Abstract –
As India modernizes and as the populationshifts to urban areas, the country has also shifted from using traditional biomass and waste to relying on other energy sources, including fossil fuels. India is strongly fossil fuel dependent and coal is the major fossil fuel in India. The country was ranked as the third-largest global coal producer, consumer, and importer of coal in 2012, and coal plays a pioneer role in the power sector. Due to growing energy demand dependence on coal is increasing day by day. Despite having significant coal reserves, India has experienced increasing supply shortages as a result of a lack of competition among producers, insufficient investment, and systemic problems with our mining industry Combustion of coal produces emissions of Nitrogen (NO&NO2) commonly
referred to as NOx which causes harmful environmental problems such as acid rain and smog. In this article a mathematical model based on dimensional analysis is developed to establish the relationship between boiler operational parameters and Nitrogen oxides (NOx) formation. Dimensional analysis works on the proper selection of parameters affecting the process (NOx formation).It operates on the dimensions of the selected parameters rather than their values. In dimensional analysis, it is not necessary to identify details of the actual combustion equipment e.g. its design, combustion air distribution system, positions of burners, etc. and what will be the effect on combustion of fuel if parameters like humidity changes; All these effects are reflected in the model through measured values of quantities that are used to build up the model. The experiment is based on on-line measurements of selected operational parameters for the given boiler.
Key Words:
dimensional analysis, nitrogen oxides
1. INTRODUCTION
Coal is the major fossil fuel in India and plays a key role in the energy sector [2]. Coal meets about 61% of the commercial energy needs and about 72% of the electricity
produced in India comes from coal. The combustion of coal produces various pollutants, such as oxides of carbon (COx), oxides of sulphur (SOx), oxides of nitrogen (NOx) and particulates .These pollutants degrades the environmental quality by causing acid rain ,ozone hole depletion and climate change. Climate change affects agriculture, ecosystem, human health and habitat of the entire living beings. Hence it is the responsibility of these industries to check these emissions and keep them to minimal level. Fly-ash particulates can be removed by fitting electrostatic precipitators and SO2 by installing a
flue gas desulphurization plant. The best way to reduce CO2 emissions is to improve power generation efficiency.
However, no practical methods exist for reducing NOx, leading to increased research into this area. During the combustion process in a coal-fired power plant, nitrogen from the coal and air is converted into nitric oxide (NO) and nitrogen dioxide (NO2); together these oxides of
nitrogen are commonly referred to as NOx.
2. DIMENSIONAL ANALYSIS
Dimensional analysis is a means of simplifying a physical problem by appealing to dimensional homogeneity to reduce the number of relevant variables [1]. It is based on the Buckingham Pi-theorem. Dimensional analysis works on the proper selection of parameters affecting the process (NOx formation).It operates on the dimensions of the selected parameters rather than their values. In dimensional analysis, it is not necessary to identify details of the actual combustion equipment e.g. its design, combustion air distribution system, positions of burners, etc. and what will be the effect on combustion of fuel if parameters like humidity changes; All these effects are reflected in the model through measured values of quantities that are used to build up the model.
3.MATHEMATICAL MODELLING BY DIMENSIONAL
ANALYSIS
According to Buckingham pi theorem if a problem involves n relevant variables & m independent dimensions then it can be reduced to a relationship between n – m non-dimensional parameters
π
1…….π
nm.© 2015, IRJET.NET- All Rights Reserved
Page 876
Volume of combustion air,Qa(m3/s)
Mass flow rate of coal, ṁc (kg/s)
Temperature of combustion air,Ta(K)
Volume of Nitrogen oxides,NOx(kg/m3)
Boiler performance,PB(kgm2/s3)
Calorific value of fuel,QC(m2/s2)
Here the number of selected parameters = 6 Number of basic dimensions = 4
Number of dimensionless arguments = 6-4 = 2
the dimensionless arguments areπ
1andπ
2It is possible in dimensional analysis to express the selected parameters including NOx formed in a functional form as follows:
0
fudamental dimensions of length, mass and time.The above parameters can be expressed as follows:
The relation for dimensional arguments
π
1andπ
2will be obtained from dimensional matrix A as prescribed below:Table-1: Parameters and Dimensions
Qa ṁc Ta NOx PB QC
Dimensional matrix A will be formulated from table 1 such that determinant of A ≠0.
Matrix A will be formulatedFor the matrixes with A and D dimensions and vector matrixes of unknown parameters B and E the following equation can be applied:
A
B
(
1)
D
E
By expanding A, B, D, E the following set of linear equations is obtained:
Values for x4 and x6 will be assumed such that its determinant also should not be zero:
Table-2:Dimensionless arguments and their values
© 2015, IRJET.NET- All Rights Reserved
Page 877
i.e.B C c 2
c x a 1
P
Q
*
m
π
m
NO
*
Q
π
(7)
The term
π
1contains NOx term and hence it can be expressed as a function ofπ
2i.e.
π
1
(π
2)
(8)Also
π
1andπ
2is expressed in the power function form to get relation between dimensionless arguments in Xcel as follows:
B 2
1
Aπ
π
(9)4. EXPERIMENTAL ANALYSIS
Table3:- Parameters and their values obtained from online measurements
Slno .
Qa (m3/s)
ṁc (kg/s)
Ta (k)
PB (kgm2/s3)
QC (m2/s2)
NOx (kg/m3)
1
81.6326531 9.75 531 80000000 23250000 0.000314262 2
81.6326531 11.22 535 81100000 23250000 0.000314262 3
79.3632653 10 532 80400000 23250000 0.000324984 4
78.0081633 9.722 532 80300000 23250000 0.000319602 5
78.0081633 9.444 533 80000000 23250000 0.00031837 6
76.4163265 9.167 533 80000000 23250000 0.000310154 7
104.734694 13.33 541 118000000 23250000 0.000353288 8
107.673469 13.83 554 117000000 23250000 0.000345072 9
114.938776 15.06 561 123000000 23250000 0.000361504 10
73.6979592 3.222 529 58300000 23250000 0.000425178 11
72.5632653 3 535 56200000 23250000 0.000422302 12
74.8326531 2.689 537 56000000 23250000 0.000396627 13
73.9265306 2.719 536 56000000 23250000 0.000398065 14
74.6040816 2.939 539 56000000 23250000 0.000408746 15
112.489796 11.94 540 125000000 23250000 0.000429286 16
111.346939 13.25 536 127000000 23250000 0.000314262 17
113.387755 11.94 536 130000000 23250000 0.000330694 18
68.4816327 3.639 543 62000000 23250000 0.000435243 19
68.7102041 3.889 535 62000000 23250000 0.000443828 20
68.4816327 3.528 531 62000000 23250000 0.00044161 21
67.1183673 3.722 534 62000000 23250000 0.000453934
22
84.1632653 5.361 524 73000000 23250000 0.000449826 23
68.7102041 5.25 543 77000000 23250000 0.000414908 24
84.3265306 5.25 533 81000000 23250000 0.000425178 25
84.1632653 5.25 566 81000000 23250000 0.000414908 26
110.693878 13.61 527 121000000 23250000 0.000365612 27
78.6857143 14.44 559 81500000 23250000 0.00033891 28
116.571429 13.89 538 130000000 23250000 0.000361504
5. RESULTS OBTAINED
Dimensionless arguments
π
1andπ
2is computed by substituting values from table 3 onto equations in 7Table4:-Dimensionless arguments and their values Sl.no
1
π
π
21 0.002631184 2.83359375
2 0.002286456 3.216584464
3 0.002579178 2.891791045
4 0.002564451 2.814900374
5 0.002629761 2.7446625
6 0.002585451 2.664159375
7 0.002775807 2.626461864
8 0.002686558 2.748269231
9 0.002759019 2.846707317
10 0.009725249 1.284931389
11 0.010214547 1.241103203
12 0.011037814 1.116415179
13 0.010822942 1.128870536
14 0.010375679 1.220209821
15 0.004044413 2.22084
16 0.002640914 2.425688976
17 0.003140423 2.135423077
18 0.008190746 1.364625
19 0.007841485 1.458375
20 0.008572045 1.323
21 0.008185736 1.39575
22 0.007061896 1.707441781
23 0.005430174 1.585227273
24 0.006829293 1.506944444
25 0.006651431 1.506944444
26 0.002973623 2.615144628
27 0.001846771 4.119386503
© 2015, IRJET.NET- All Rights Reserved
Page 878
Fig -1: plot of
π
1vs.π
2From fig 1 we obtain the values of A and B of equation9 as A= 0.013
B= -1.56
Substituting A and B in eqn 9 we get the formula for NOx (kg/m3) as below:
π
1
0.013π
21.56 (10)1.56
B C c
c x
a
)
P
Q
*
m
0.013(
)
m
NO
*
Q
(
(11)1.56
B u
a 0.56 c 3
)
P
Q
(
*
Q
m
*
0.013
)
m
kg
NOx(
(12)
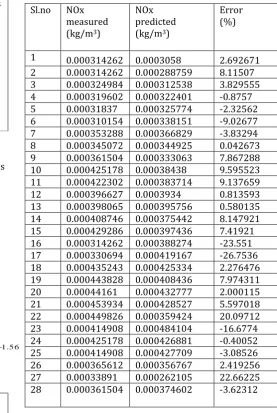
Chart -1: Measured NOx vs. Predicted NOx
Table 4:-Measured NOx vs. Predicted NOx values and their errors
Sl.no NOx
measured (kg/m3)
NOx predicted (kg/m3)
Error (%)
1 0.000314262 0.0003058 2.692671
2 0.000314262 0.000288759 8.11507
3 0.000324984 0.000312538 3.829555
4 0.000319602 0.000322401 -0.8757
5 0.00031837 0.000325774 -2.32562
6 0.000310154 0.000338151 -9.02677
7 0.000353288 0.000366829 -3.83294
8 0.000345072 0.000344925 0.042673
9 0.000361504 0.000333063 7.867288
10 0.000425178 0.00038438 9.595523
11 0.000422302 0.000383714 9.137659
12 0.000396627 0.0003934 0.813593
13 0.000398065 0.000395756 0.580135
14 0.000408746 0.000375442 8.147921
15 0.000429286 0.000397436 7.41921
16 0.000314262 0.000388274 -23.551
17 0.000330694 0.000419167 -26.7536
18 0.000435243 0.000425334 2.276476
19 0.000443828 0.000408436 7.974311
20 0.00044161 0.000432777 2.000115
21 0.000453934 0.000428527 5.597018
22 0.000449826 0.000359424 20.09712
23 0.000414908 0.000484104 -16.6774
24 0.000425178 0.000426881 -0.40052
25 0.000414908 0.000427709 -3.08526
26 0.000365612 0.000356767 2.419256
27 0.00033891 0.000262105 22.66225
28 0.000361504 0.000374602 -3.62312
6. CONCLUSION
© 2015, IRJET.NET- All Rights Reserved
Page 879
ACKNOWLEDGMENT
First of all, authors would like to thank God almighty, for best owing his blessings in this endeavour. The authors also acknowledge the technical support from all those who guided and helped during the preparation of this report
.
REFERENCES
[1] Maria Camogurska, “Modelling of nitrogen oxides formation applying dimensional analysis,” Chemical and Process Engineering. Vol.32 (3) pp.175-184, 2011.
[2] M.A.Habib and M.Elshafei. “Influence of combustion parameters on NOx production in an industrial boiler." Science Direct, Computers and fluids37, pp 12 – 23, 2008.