Plant
Response
and Livestock
Weight
Changes
on Big Bluegrass
Range
Grazed
during
Late
Fall, Winter,
and Early
Spring
PAT 0. CURRIE
Highlight: Yearling heifers grazing Sherman big bluegrass ranges in Colorado during the cold winter period gained weight during late fall with or without a protein supplement, but they gained less than animals that grazed native range and received %-lb protein/day. During winter and early spring, animals lost weight in most pastures. Exposure as well as kind and quantity of forage and feed available evidently influenced livestock weights. Grazing was not detrimental to Sherman big bluegrass during any period from late fall to early spring, and stands improved during the study. For most effective use, big bluegrass should replace native range for fall grazing in a management system. More animals could be carried over winter, or a set number of animals could be overwintered on fewer acres.
Climatic conditions during the study were often very cold at the 7,800 ft elevation of the experimental forest. January minimum temperature ranged from - 12°F in 1967 to - 30°F in 1971. Snow, although not usually deep, is present at different times throughout the fall through spring season in this area of Colorado.
Study Areas
Experimental Procedure
Sherman big bluegrass, a selected strain of Poa ampla Merr., indigenous to the Pacific Northwest, is highly productive in certain areas of the Rocky Mountain Region. Generally, it is best adapted to elevations above 7,000 ft and where average annual precipitation approaches or exceeds 14 inches (McGinnies et al., 1963). Although it is often difficult to establish, Sherman big bluegrass-usually remains green in late fall and winter, resumes growth very early in spring, and responds exceptionally well to grazing. It has a tendency to “pull up” when grazed, however (Hyder and Sneva, 1963; Haferkamp and Currie, 1973).
Two 45-acre tracts were planted to Sherman big bluegrass at the Manitou Experimental Forest near Woodland Park, Colorado, during the summer of 1965 (Currie, 1967). One tract, the Nursery Field, has a westerly exposure. The other, designated the Sinclair Field, has an easterly exposure. The land was plowed and tilled (Currie and Smith, 1970) to kill existing vegetation prior to seeding.
A randomized block design was used for evaluating treatment responses. The Nursery and Sinclair blocks were fenced to provide nine j-acre pastures at each location. In addition, two 30-acre native ranges, one adjacent to each area, served as controls for comparing livestock gains. Native ranges were included for comparison because they are the usual forage source in this area for keeping animals through the winter.
Beef production from Sherman big bluegrass grazed in late spring and summer has been greater than for other seeded species tested at the Manitou Experimental Forest (Currie, 1969a). Also, where incorporated into a yearlong management plan, early fall grazing of this grass produced excellent weight gains (Currie, 1969b).
To further evaluate big bluegrass as a source of forage, tests were conducted over a 3-year period to (1) determine cattle responses to grazing seeded stands of this species during late fall, winter, and early spring, and compare responses with those of animals grazing on nearby native ponderosa pine-bunchgrass ranges, (2) evaluate effects of grazing during these periods on stand characteristics, and (3) compare minimum level of protein supplement necessary for maintenance or satisfactory weight gains of animals grazing big bluegrass.
In the Nursery block, the control pasture is situated along a stream bottom that produces mainly meadow grasses and legumes. It also contains willow thickets, which provide some protection for cattle. The native range control treatment in the Sinclair block is more exposed. It is on an upland site which supports excellent stands of Arizona fescue (Festuca arizonica Vasey) and mountain muhly (Muhlenbergia montana (Nutt.) Hitchc.) among scattered stands of ponderosa pine (Pinus ponderosa Laws.).
Pasture and Livestock Treatments
The author is range scientist, Rocky Mountain Forest and Range Experiment Station, U.S. Department of Agriculture, Forest Service, with central headquarters maintained at Fort Collins, in cooperation with Colorado State University.
Manuscript received February 5, 1975.
Experimental grazing began in the fall of 1967 and was concluded in the spring of 1971. Grazing seasons and forage sources and protein supplement rates tested on the 5-acre pastures and native range were as follows:
Combinations of Forage Source and Supplement Rate (1) NR % Native Range + ‘/z lb protein/animal/day (2) S, Seeded Sherman big bluegrass - 0 protein (3) s % Seeded Sherman big bluegrass + % lb protein/
animal/day
(4) s ‘/z Seeded Sherman big bluegrass + ‘/z lb protein/ animal/day
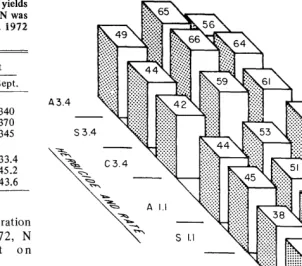
Table 1. Average seasonal changes in weight (lb/animal) of he& calves on Sherman big bluegrass pastures and native ranges for a 3-year period.
Season
Forage source and Fall protein supplement (Dec. l-
(lb/animal/day) Jan. 10)
Winter (Jan. lo- Feb. 20)
Spring (Feb. 20- Apr. 1) Nursery
B& bluegrass 0 lYa 1% Native range
‘Y2 Sinclair
Big bluegrass 0 VI 1% Native range
Y2
6 -21 2
19 -15 -3
18 -6 -5
35 16 -26
5 -14 -22
5 -10 -16
2 -10 -17
22 -6 -8
bluegrass pastures at either location.
Although sheds were provided to protect the heifers in all bluegrass pastures, exposure to the elements while grazing made the animals more susceptible to weight loss (Fig. 1). As expected, cattle weight gains varied significantly (P < .O 1) by years on the bluegrass pastures. During 1967-68, the heifers gained weight under all treatments in the fall, lost most weight in winter, and a lesser amount in spring. They ended the entire fall through spring seasons with a net gain of 14 lb/animal. In 1969-70, heifers lost an average of 2.1 lb/animal in the fall on the 1/2 lb protein/day treatment and gained only 2.5 and 0.1 lb on the 1/4 lb protein supplement and no protein treatments, respectively. The heifers on these latter two treatments lost less weight in the winter season than they did in the 1967-68 treatment year, but weight losses during the spring season were larger than previous losses. Thus the heifers ended with a net weight loss of a 8 lb/animal for the 1969-70 treatment year. In 1970-71, the weight gain and loss pattern by season was similar to that for 1967-68 with gains in the fall, followed by winter losses which averaged more than in the spring. Net loss averaged 5.5 lb/animal for the season. In all years the differences in gain between seasons were associated with the onset of cold weather, particularly if accompanied by wind.
Although heifers generally gained consistently during all seasons only on native ranges, it is advantageous to have Sherman big bluegrass pastures for fall use. Even without a protein supplement, heifers gained some weight in all years. These gains were made by a total of 27 heifers over a 3-year period in each 5-acre pasture, while only 12 heifers made the larger gains on 30 acres of native range. Evaluated on a per acre basis, gains from big bluegrass without supplement nearly equaled those for native range. With either the 1/4 or $ lb protein per day supplement, the gains produced per acre were double those for native range. More important, however, is that using bluegrass pastures in the fall permits saving native range areas for grazing during the more severe winter and early spring period. Thus, a larger number of animals could be maintained in good condition on the same total amount of grazable acreage, or the same number maintained on fewer acres. In addition, costs could be reduced by not feeding protein, or feeding at the g-lb/day rate compared with the l/i-lb/day used to supplement native range.
Table 2. Crown intercepts (inches) and numbers of Sherman big bluegrass plants per foot of drill row in 1971 following 4 years of grazing treatment. Values are adjusted means for 3 pastures with 25 plots per pasture analyzed by covariance.
Location Season
Crown intercept
Plant numbers
Nursery Fall 7.7 1.8
Winter ::o” 1.6
Spring 1.7
Sinclair Fall 7.0 1.6
Winter 7.0 1.7
Spring 7.4 1.6
Plant Responses
Grazing during any of the dormant periods was not detrimental to Sherman big bluegrass. Neither plant crown intercept nor number of plants differed significantly among grazing periods at the end of the study in 1971 (Table 2). The largest difference in average intercept for seasons was only 0.6 inch between fall and winter use at the Nursery location. These same two treatments also had the most difference in plant numbers, but again the difference was very small.
From 1968 to 1971, plant intercept increased while the number of plants decreased under all treatments at both locations. These changes were not large. The increase in intercept averaged 0.6 inch, and the average number of plants per foot of row decreased 0.3. The changes indicated, however, that plants were aggregating, thus the net effect was pasture improvement under all dormant-period grazing. In contrast, grazing during the growing season damaged the stands from “pull up.” Dormant season use of big bluegrass therefore provides an alternative management method (the first several years following establishment) and late fall would be the best use period for animal weight gain.
Because of uniformity in numbers and crown cover of big bluegrass in the pastures, there were no large differences in herbage yields between seasonal treatments (Table 3). Yields in 1967 were considerably higher than for other years because accumulated organic matter from time of planting in 1965 was included in this year’s standing crop estimate. In subsequent years, standing dead organic matter was separated from current live plants and not included in the yield figure.
Yields were uniform between the seasonal treatments, and fluctuated in relation to growing season precipitation. From 1968 to 1969, average yields increased approximately 500 lb/acre on all treatments. These higher yields were in response to an increase of 6.42 inches of moisture received during the growing‘ season. Yields then decreased roughly 50% in 1971 when precipitation also decreased about 50%. The influence of precipitation on yield has been documented for longer periods of time and several seeded species (Currie and Peterson, 1966; Currie, 1969 ; Currie and Smith, 1970).
Table 3. Herbage yields (lb/acre) from big bluegrass pastures in relation to seasonal precipitation (inches) and period of grazing. Records of oven-dry plant material produced on three pastures at each of two locations were averaged by grazing period.
Year
Precipitation
(Apr. 1-Aug. 31) Fall
Season of grazing Winter Spring
1967l 13.13 4,238 4,242 4,237
1968 9.93 952 906 954
1969 16.35 1,448 1,413 1,570
1971 8.54 744 730 740
’ Yield for 19 67 includes standing dead organic matter.
Table 4. Plant density’ of invading species in 1967 and 1970 on Sherman big bluegrass pastures in relation to season of grazing. Values averaged for three pastures per season at each location.
Season of grazing
Species
Fall Winter
1967 1970 1967 1970
Spring
1967 1970
Nursery Seeded species Fringed sagebrush Trailing fleabane Evening primrose Cinquefoil Misc. grasses Misc. forbs
Total
Sinclair Seeded species Fringed sagebrush Trailing fleabane Evening primrose Cinquefoil Misc. grasses Misc. forbs
Total
0.75 1.89 0.39 0.77 0.23 0.43 0.54 1.56 0.30 1.10 0.56 1.84 2.14 9.33 0.34 5.86 2.39 14.79 0.31 0.63 0.18 0.90 0.37 0.79 0.07 0.22 0.02 0.03 0.03 0.04 0.13 0.17 0.03 0.41 0.09 0.40 0.17 2.19 0.22 0.33 0.19 2.22
4.11 15.99 1.48 9.40 3.86 20.5 1
0.55 1.50 0.54 1.32 0.30 0.62 0.29 1.63 0.58 1.97 0.47 1.57 0.55 4.74 1.62 11.91 1.13 10.65 0.26 1.49 0.58 1.62 0.28 1.38 0.02 0.05 0.01 0.02 0.03 0.01 0.01 0.37 0.03 0.44 0.01 0.78 0.18 0.63 0.17 0.42 0.25 0.36
1.86 10.41 3.53 17.70 2.47 15.37
’ Plants per square foot.
Invading species changed most on seasonally grazed Sherman big bluegrass pastures (Table 4). Trailing fleabane (Erigeron flagellaris) initially was one of the more abundant species in most pastures in 1967. When remeasured in 1970, it was by far the most abundant plant. Densities ranged from 4.74 plants/ft2 in the fall-grazed Sinclair pasture to 14.79 in the spring-grazed Nursery pastures. There was no particular trend in relation to treatment, however.
Although fleabane contributed substantially to plant density, it remained relatively unimportant in terms of pasture yields or livestock forage. The “mother” plant often sends out a large number of runners which form new plants at the nodes. These juvenile plants seldom become very large, and often die. Also, both the mother and juvenile plants are dormant and have shattered prior to grazing, and those few that do remain viable have a prostrate growth form which limits their availability to livestock.
Fringed sagebrush (Artemisia frigida), evening primrose (Oenothera coronopifolia), volunteer plants of big bluegrass growing outside the drill rows, and other seeded species not killed from tillage prior to planting, also invaded the stands. All increased between 1967 and 1970, but none of the increases were associated with a particular seasonal treatment. The number of fringed sagebrush plants per square foot increased three- to six-fold under the seasonal treatments. Evening primrose and seeded species generally increased a smaller amount, with only a doubling or tripling in plant numbers. However, these species contributed approximately
20% to the standing crop of herbage available to livestock.
Conclusions
Dormant-season grazing of Sherman big bluegrass was effective in reducing “pull up.” As evidenced by aggregation of big bluegrass and minor invasion by native species, there was very little detrimental effect from late fall, winter, or early spring grazing. Big bluegrass usually provided abundant forage for overwintering weaner heifer calves. The animals gained weight in late fall with or without a protein supplement. Weight losses during winter and spring were relatively small, usually averaging less than 20 lb per animal. Feeding a protein supplement to prevent or reduce such a small weight loss probably is not justified.
Cattle fed % lb protein per animal per day on native range usually gained weight during winter months, particularly if the native forage consisted of meadow grasses and legumes. However, Sherman big bluegrass pastures carried 2 to 3 times more animals than did native ranges of comparable acreage. Big bluegrass forage grazed in late fall produced almost as many pounds of beef per acre as did native forage supplemented with % lb of protein. Big bluegrass supplemented with % or % lb of protein produced nearly twice as many pounds of beef per acre as did native range.
Literature Cited
Cooper, C. S., and D. N. Hyder. 1958. Adaptability and yield of eleven grasses grown on the Oregon high desert. J. Range Manage. 11:235-237.
Currie, P. 0. 1967. Seeding Sherman big bluegrass. J. Range Manage. 20: 133-l 36.
Currie, P. 0. 1969a. Plant response and cattle gains on Sherman big bluegrass. J. Range Manage. 22:258-261.
Currie, P. 0. 1969b. Use seeded ranges in your management. J. Range Manage. 22~432-434.
Currie, P. O., and Geraldine Peterson. 1966. Using growing season precipitation to predict crested wheatgrass yields. J. Range Manage.
19:284-288.
Currie, P. O., and D. R. Smith. 1970. Response of seeded ranges to different grazing intensities in the ponderosa pine zone of Colorado. U.S. Dep. Agr. Prod. Res. Rep. 112. 4 1 p.
Currie, P. O., M. J. Morris, and D. L. Neal. 1973. Uses and capabilities of electronic capacitance instruments for estimating standing herbage. Part 2. Sown ranges. J. British Grassl. Sot. 28: 155-160. Haferkamp, M. R., and P. 0. Currie. 1973. Effects of fertilizer on root
strength of Sherman big bluegrass. Agron. J. 65 :5 1 l-5 12.
Hyder, D. N., and F. A. Sneva. 1963. Studies of six grasses seeded on sagebrush bunchgrass range. Ore. Agr. Exp. Sta. Tech. Bull. 71. 20 p.
Malechek, J. C. 1966. Cattle diets on native and seeded ranges in the ponderosa pine zone of Colorado. U.S. Forest Serv. Res. Note RM-77, 12 p. Rocky Mountain Forest and Range Exp. Sta., Fort Collins, Colo.
McGinnies, W. J., D. F. Hervey, J. A. Downs, and A. C. Everson. 1963. A summary of range grass seeding trials in Colorado. Colo. Agr. Exp. Sta. Tech. Bull. 73. 81 p.
Neal, D. L., and J. L. Neal. 1973. Uses and capabilities of electronic capacitance instruments for estimating standing herbage. Part 1. History and development. J. British Grassl. Sot. 28:81-89.
Runoff
and Reservoir
Quality
for Livestock
Use in Southeastern
Montana
R. J. SOISETH
Highlight: Runoff and reservoir waters from the Pierre Site Descrbtion and Methods
Shale Plains in southeastern Montana were fresh (< 1,000
mglliter of TDS) to slightly saline (1,000 to 3,000 mglliter of The study was conducted on rangelands in the Pierre Shale TDS) and were rated good to fair for livestock use, However, Plains and Badlands Land Resource Area of Carter County in
as water levels drop, mainly through evaporation, waters in southeastern Montana. The fine-textured, panspot, saline-sodic some reservoirs could become moderately saline (3,000 to soils in this area have low infiltration rates (less than 1
10,000 mglliter of TDS) and should not be used if other cm/hour) and are sparsely vegetated (Fig. 1). Soil chemical waters are available. properties are shown in Table 1. Annual precipitation is approximately 24 cm, with 80%
received from April through September. Based on short term Reservoirs are a main source of water storage for livestock records, from related studies in the area, approximately 50% use in many semiarid areas in the Western United States. of the precipitation events from May through November Information is limited on the relation between the chemical produce runoff in the Pierre Shale Plains in southeastern quality of runoff water and water stored in reservoirs. Montana. However, long term gauging records and estimations Lotspeich et al. (1969) found that runoff water in playas in from short term records indicate an average runoff of only 2.5 the Southern High Plains was less saline than ground water and
cm per year in the area (Earl L. Neff, personal communication). Even though 2.5 cm of runoff per year is not was of excellent quality for irrigation. Gifford and Tew (1969) much, runoff from short-duration, intense storms will fill found that runoff waters from small plot infiltrometers (2.5 stock reservoirs in the area. Pan evaporation from June ft”) on untreated rangeland plots in southern Utah were more through September (1969- 1973) averaged 107 cm.
saline (21 to 37 micromhos/cm) than the infiltrometer water applied to the plots. Peterson and Heath (1963) suggested that most surtace runoff waters contain small to moderate amounts of dissolved salts. Alsayegh et al. (1966) found that, based on soluble salts, quality of waters in livestock ponds on fine-textured soils in western South Dakota was excellent to good for livestock use.
Water for livestock is a major problem on the Pierre Shale Plains in southeastern Montana. Very few wells are drilled because the water in shallow strata is generally highly mineralized and unsuitable for drinking (Perry, 1935). Because depth to suitable ground water is too great for economical well drilling, surface reservoirs are the main source of stock water in these areas. Runoff from saline soils with electrical conductivities of up to 9.3 mmhos/cm @ 25°C (predominantly NaS04, salts), high evaporation rates, and low precipitation suggests that reservoir waters could increase in salinity and become unfavorable at times for livestock use. The objective of this study was to classify runoff and reservoir waters for livestock use based on chemical characteristics.
The author is agricultural research technician, U.S. Department of Agriculture, Sidney, Montana.
This research is a contribution from the Western Region, Agricultural Research Service, U.S. Dep. Agr., in cooperation with the Bureau of Land Management, U.S. Department of the Interior, and the Montana Agricultural Experiment Station, Journal Series No. 536.
Manuscript received November 6, 1974.
In 1971, 1972, and 1973, runoff water samples were collected from five 0.8 l-hectare watersheds and in 1971 and 1973, from one large watershed (about 3,600 hectares). During the same 3 years, water samples were collected periodically from three reservoirs with drainage areas of from 250 to 650 hectares. Several other reservoirs with drainage areas of from 130 to 770 hectares were sampled in 1973. Since Alsayegh et al. (1966) found water salinity to be homogeneous at all depths in reservoirs, water samples were taken from 3-30 cm below the water surface (Fig. 2).
Standard laboratory procedures were used to analyze soil and water samples (U.S. Salinity Laboratory staff, 1954). Electrical conductivities (EC) and pH were measured respectively with a conductivity bridge and pH meter. The atomic adsorption spectrophotometer was used to determine calcium and magnesium. A flame photometer was used to measure sodium. Bicarbonates and carbonates were determined by titration with sulfuric acid, and chloride was determined by titration with silver nitrate. Sulfate content was calculated by difference: SO4 = total cations (Na + Ca + Mg + K) minus determined anions (HC03 + CO3 + Cl) expressed in meq/liter. The phenoldisulfonic method was used to analyze for N03-N. Total dissolved solids (TDS) were determined by weighing the residue after evaporating (105OC) a measured water sample or by estimating them from EC measurements.
-
aquatic plants; but overnight, the pH values returned to lower levels. No increase in pH was measured in reservoir water samples without aquatic plants. From this data and supporting information (Clarke, 1966 and the Federal Water Pollution Control Administration, 1968), it appears that high pH values in some reservoir waters are partly due to diurnal changes in COz and O2 content caused by photosynthetic activity of aquatic plants. They should not be harmful to livestock.
In 1973, water samples were taken from several reservoirs when water levels were low. Chemical analyses of these samples also indicated that TDS and ionic concentrations did not reach levels harmful to livestock. However, TDS in waters in some reservoirs did approach 2,500 mg/liter and, presumably, these waters could reach a poor rating if water levels continued to decline.
Some reservoir waters at low water levels looked polluted and unpalatable for livestock use. This apparent pollution was caused mostly by livestock moving around in the shallow waters, eating emergent vegetation, and contaminating the water with excrement (Figs. 3 and 4). However, these conditions exist mainly late in the grazing season when water levels are low and when forage has diminished on the rangelands. Conceivably, performance of animals drinking muddy, fecally contaminated waters, and/or waters with excessive minerals could be adversely affected. These waters should not be used if other water is available.
Results of this study indicate that reservoir and runoff water quality in the Pierre Shale Plains in southeastern
Montana is good to fair for livestock use. However, as water levels decrease in some reservoirs as a result of evaporation, the water could become poor in quality because of an increase in TDS and pollution from livestock moving around in these reservoirs. If poor water quality is suspected, the water should be tested for mineral content and organic pollution.
Literature Cited
Alsayegh, Ahmed Y., Clayton L. Hanson, and Carl J. Erickson. 1966. Salt balance in livestock pond waters. S.D. Farm and Home Res. 17(3):20-22.
Clarke, George L. 1966. Elements of Ecology. John Wiley and Sons, New York. 560 p.
Federal Water Pollution Control Administration. 1968. Water Quality Criteria. U.S. Government Printing Office, Washington, D.C. 234 p. Gifford, Gerald F., and Ronald K. Tew. 1969. Evaluating rangeland
water quality with small plot infiltrometers. J. Soil and Water Conserv. 24(2):65-67.
Lotspeich, Frederick B., Victor L. Hauser, and Oliver R. Lehman. 1969. Quality of waters from playas on the Southern High Plains. Water Resources Res. 5(1):45-58.
Perry, Eugene S. 1935. Geology and ground-water resources of southeastern Montana. Montana School of Mines. Memoir No. 14. 67 p.
Peterson, Harold V., and Virgil T. Heath. 1963. Stock water facilities for the Pacific Southwest. J. Soil Water Conserv. 18(3):103-108. U.S. Salinity Laboratory Staff. 1954. Diagnosis and improvement of
saline and alkali soils. U.S. Dep. Agr., Agr. Handbook 60.
Weeth, H. J. 1973. Non-applicability of federal water quality standards when applied to cattle. Water-Animal Relations Proceedings. p. 9-12.
’ Establislt a more vigorous range clover stand..?
RHIZO-KOTE clover
seed coatings
-planted successfully on thousands of acres of Cal!- fornia range/and,provides cattlemen and
sheepmen with:
1. Lower seeding rates and better stand establishment;
2. Improved broadcast and aerial applica-
3. Protection for the seed against adverse soil conditions;
4. Improved root nodulation through effec- tive seed inoculation.
For more information on RHIZO-KOTE, contact:
Insist on RHIZO-KOTE clover seed coatings from your seed supplier!
Economics
of Ranch
Management
Alternatives
in Southwestern
North
Dakota
F. LARRY LEISTRITZ AND NEIL J. QUALEY
Highlight: The fundamental management problem of northern plains ranchers is to increase ranch income while maintaining or improving the productivity of the range resource. This study used linear programming to evaluate the profitability of alternative range and livestock management practices. Sale of yearlings was found to be more profitable than selling calves. Establishment of crested wheatgrass for spring grazing allowed deferment of native range and was profitable if yearling .prices exceeded $40 per cwt. Fertilization of crested wheatgrass pastures and native hayland at a rate of 40 pounds actual nitrogen per acre was profitable, but native range fertilization was not profitable using prices for the 1970-73 period. Recent price trends place added emphasis on efficient use of the range resource.
productivity in the northern plains, indicating a need for change in traditional ranch management practices.
The fundamental management problem facing northern plains ranchers involves the allocation and use of scarce resources (land, labor, and capital) so as to maximize profit while maintaining or enhancing rangeland productivity.
Ranchers are confronted with a need to maintain or improve the condition of their rangeland while also maintaining or increasing their sales of beef cattle. Saunderson (1973) points out that rising land prices have placed stockmen under pressure to increase beef production per unit of land. Ranch decisions are further complicated by rapidly fluctuating prices of cattle, feed, and other inputs.
The range cattle industry is an important sector of agriculture in the Northern Great Plains. For instance, in North Dakota, sales of cattle and calves accounted for 31% of total sales of crops and livestock in 1973 (Price and Taylor, 1974). In the neighboring states of Montana, Wyoming, and South Dakota, range cattle have an even greater relative importance. Wheeler (1970) reports that sales of livestock in 1968 represented about 75% of the gross value of agricultural production marketed in the northern plains area of those three states. Over the past 10 to 15 years, the number of beef cattle on farms and ranches in the northern plains area has increased. For example, in the 14 North Dakota counties south and west of the Missouri River, cattle numbers have increased 83% from 1960 to 1974 (Price and Taylor, 1974).
The purpose of this study is to determine the most profitable range and livestock management practices for northern plains cattlemen. Specific objectives include the evaluation of (1) fertilization of native range, (2) use of cropland for tame pasture or hay production to supplement the rangeland feed base, and (3) sale of yearlings rather than calves.
Procedure
The trend of increasing cattle numbers places added pressure on the range resource and poses challenges for the range manager. Additional livestock numbers can be supported on a fixed land base by converting cropland to tame pasture or hay production to supplement the range resource, by using purchased feed to supplement the range, or by increasing grazing intensity on rangelands. Grazing intensity can be increased through various range improvement practices, such as range fertilization. Recent articles (Goetz, 1969; Lorenz and Rogler, 1973) report substantial responses of northern plains mixed grass rangelands to nitrogen fertilization. However, a recent survey (Leistritz, 1972) indicates that less than one-fifth of western North Dakota ranchers use fertilizer on any of their grazing lands. Wheeler (1970) reports that overgrazing has resulted in a general decline in range
The nature of northern plains ranching makes the determination of the most profitable range management practice difficult. An analytical technique is needed which allows the simultaneous selection of (1) the number and type of livestock, (2) the allocation of cropland among the alternatives of cash crop production, feed grain and hay production, and pasture, (3) the allocation of rangeland to spring, summer, and fall grazing, and (4) the rate of fertilization of both the range and the tame pastures. Linear programming is such a technique and is the principal analytical procedure of this study.
Linear programming is a mathematical procedure which allows returns to the fixed resources to be maximized subject to a set of production restraints which are considered simultaneously.’ Linear programming was used in this study to determine ranch management practices which maximize returns to the ranch operator’s labor, management, and land for a representative ranch. The data used in the programming reflect present range management technology and were obtained from surveys of range livestock producers in western North Dakota, from experiment station trials, and from the North Dakota Crop and Livestock Reporting Service. The Authors are associate professor and research assistant, Department
of Agricultural Economics, North Dakota State University, Fargo. Qualey’s present address is Citizen’s State Bank, Rugby, North Dakota.
Manuscript received October 28, 1974.
‘A nontechnical discussion of linear programming may be found in Levin and Lamon (1969). More detailed treatments are found in Heady and Candler (195 8) and Wagner (19 69).
JOURNAL OF RANGE MANAGEMENT 28(5), September 1975 349
study area consisted of the 14 counties in North Dakota located south and west of the Missouri River.
The representative ranch studied consisted of 2,243 acres of which 606 acres were cropland, 65 acres were used for native hay production, and 1,572 acres were rangeland. The cropland included 255 acres of sandy soil on rolling land which was considered marginal for crop production. Of the rangeland, only 629 acres or 40% was suitable for fertilization, based on soil type and terrain. Ranch labor was provided by the operator and his family although a full-time man could be hired if needed.
Livestock Management Alternatives
The basic livestock enterprise was the beef cow-calf herd with the rancher having three alternative methods of marketing:
1) Calves are weaned in October and sold around November 1.
2) Calves are weaned, fed through the winter, and sold the end of April.
3) Calf is weaned, fed through the winter, summer grazed, and sold either in June, August, or October depending on range condition and prices.
A 16% cow herd replacement rate and a 90% calf crop were assumed with calves being born in March and April. One bull was required for every 25 cows and had a 4-year useful breeding life.
Weaned calves were sold at weights of 430 and 410 pounds for steers and heifkrs, respectively. Calves fed during the winter for sale in April were fed a grain-roughage ration to gain 1.75 pounds per day (average weighted daily gain for steers and heifers). If the operator intended to summer graze yearlings they were wintered on a high roughage ration to gain 1 .OO pound daily and placed on native range or tame pasture about May 10.
Calf and yearling prices used in the programming model were based on a 3-year average (1970-73) of prices received at the Union Stockyards, West Fargo. Marketing costs were based on Dunn (1971).
Range Management Alternatives
The grazing season in southwestern North Dakota begins about May 10 and lasts from 6 to 8 months. Six- and g-month grazing were included as alternatives available for grazing cows:
1) Graze native range continuously with supplemental grazing of crop and hayland aftermath beginning in September.
2) Graze crested wheatgrass (Agropyron desertorum) from May 10 to June 20 and defer native range for summer and fall grazing.
3) Graze crested wheatgrass pastures from May 10 to June 20, graze native range from June 20 to September 10, then move to Russian wildrye (Elymus junceus) pasture until November.
The grazing season for yearlings was divided into three periods:
1) Spring grazing from May 10 to June 20. The yearlings gain at a rate of 2.25 pounds per day and can be grazed on either native range or crested wheatgrass.
2) Summer grazing from June 20 to August 1. Yearlings graze native range and gain at a rate of 1.75 pounds per day.
350
3) Fall grazing from August 1 to October 1. Yearlings graze native range and gain 1.00 pound per day.
The yearlings could be sold at the end of any of the three periods. Several range and pasture fertilization alternatives were available:
1) Native rangeland could be fertilized with 40 pounds of actual N. (Only 40% of the rangeland acreage was judged suitable for fertilization, however.)
2) Crested wheatgrass pasture could be fertilized with 40 or 80 pounds of actual N.
3) Russian wildrye pasture could be fertilized at a rate of 40 pounds of actual N.
All tame pasture was established on cropland acreage and the decision whether or not to fertilize the pasture was based on the value of the added production relative to the added cost. Cost-sharing for pasture establishment was available from the Great Plains Conservation Program. Ammonium nitrate (33% actual N) was used for fertilization.
Grain and Hay Alternatives
Wheat, barley, oats, and alfalfa hay could be grown as cash crops. The prices for the small grains were based on 1974 farm program guarantee prices. Forage crop alternatives included alfalfa, corn silage, and native hay; and oats and barley could be grown as feed crops. Native hay could be fertilized with 40 pounds actual N per acre. Yields attained on marginal cropland as compared to good cropland were estimated to be approximately 70% for grain crops and corn silage and 90% for alfalfa (Table 1).
Results of Programming Analysis
Linear programming analysis was used to determine the opt imum ranch organization given alternative livestock production and pasture management systems. A recent ranch survey (Leistritz, 1972) has shown that western North Dakota ranchers typically sell their calves shortly after weaning and do not typically fertilize rangeland. An initial or “baseline” solution, developed for purposes of comparison, indicated the profit-maximizing ranch organization when only these traditional management practices were allowed. Subsequent analysis involved increasing the livestock marketing and pasture management alternatives.
Baseline Solution
The baseline solution (Solution 1) indicates the profit-maximizing ranch organization using traditional pasture
Table 1. Forage and cash crop yields on good and marginal cropland, southwestern North Dakota.
crop Unit
Yield on good cropland
Marginal cropland Wheat following fallow
Barley following fallow Oats following small grain Corn silage
Alfalfa hay
Crested wheatgrass for spring pasture Crested wheatgrass for
spring grazing:
With 40 pounds actual N With 80 nounds actual N
bushel/acre 33.70 23.70 bushel/acre 54.80 38.50 bushel/acre 57.00 40.20
ton/acre 5.30 3.70
ton/acre 1.50 1.35
AUM/acrea 0.88 .80
AUM/acrea 1.50 1.37
AUM/acrea 1.61 1.46
aAn AUM is the amount of
dry cow.
forage required per month by a 1,000 pound
management techniques and cattle marketing practices (Table 2). For this solution, tame pasture establishment and native range fertilization were not allowed, and sale of calves at weaning was the only cattle marketing alternative considered. Wheat after fallow occupied most of the good cropland with the remainder (11 acres out of 351) devoted to oats production. The oats were used as winter feed for the cow herd. Marginal cropland was used for wheat after fallow and for alfalfa hay production. The cow herd totaled 110 and 82 calves were sold annually. The rancher’s return to his labor and management was $6,787.
Alternative Cattle Marketing Programs
For this solution (Solution 2), the alternatives of selling either backgrounded calves or yearlings were included in the model. Sale of yearlings after summer grazing was the most profitable alternative. Sale of backgrounded calves was more profitable than selling weaned calves but less profitable than selling yearlings. In order to provide additional winter feed, 26 acres of good cropland was shifted from wheat-fallow to oats (Table 2). L b a or and management returns for this solution were $9,635, an increase of 42% from the Solution 1 level. Alternative Pasture Management Programs
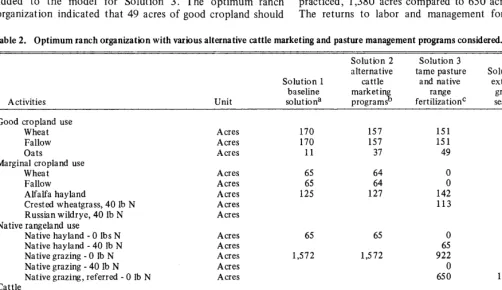
The alternatives of establishing tame pasture and of fertilizing tame pasture, native hayland, and native range were added to the model for Solution 3. The optimum ranch organization indicated that 49 acres of good cropland should
be used for oats production with the remainder in wheat-fallow (Table 2). All marginal cropland was used for forage production- 142 acres for alfalfa hay and 113 acres for crested wheatgrass. All tame pasture and native hayland was fertilized with 40 pounds of actual N, but no native range was fertilized. Russian wildrye for fall grazing was not established in this solution. Of the 1,572 acres of native range, 6.50 acres were used for deferred grazing. Labor and management returns for this solution were $11,325 which was 67% greater than that for Solution 1 and 18% greater than for Solution 2.
Extended Grazing Season
An 8-month grazing season (May 10 to December 31) was used to determine the effect on ranch organization of the reduced labor and winter feed requirements associated with this management strategy. The 8-month grazing season was analyzed in Solution 4, using the livestock marketing and pasture management strategies included in Solution 3.
The livestock and crop production pattern with an 8-month grazing season did not differ greatly from that with a 6-month season (Table 2). The acreage of alfalfa hay was reduced by 33 acres, as a longer grazing season implies a reduced hay requirement per head. The major change in pasture management with this solution was the large increase in the acreage of native range on which deferred grazing was practiced, 1,380 acres compared to 650 acres for Solution 3. The returns to labor and management for Solution 4 were
Table 2. Optimum ranch organization with various alternative cattle marketing and pasture management programs considered. Solution 2 Solution 3
alternative tame pasture Solution 4
Solution 1 cattle and native extended
baseline market in range grazin
Activities Unit solutiona programs % fertilizationC season 8
Good cropland use
Wheat Acres 170 157 151 152
Fallow Acres 170 157 151 152
Oats Acres 11 37 49 47
Marginal cropland use
Wheat Acres 65 64 0 0
Fallow Acres 65 64 0 0
Alfalfa hayland Acres 125 127 142 109
Crested wheatgrass, 40 lb N Acres 113 146
Russian wildrye, 40 lb N Acres
Native rangeland use
Native hayland - 0 lbs N Acres 65 65 0 0
Native hayland - 40 lb N Acres 65
Native grazing - 0 lb N Acres 1,572 1,572 9;; 192
Native grazing - 40 lb N Acres 0 0
Native grazing, referred - 0 lb N Acres 650 1,380
Cattle
Cow herd Number 110 94 125 122
Weaned calves solde Number 82 0 0
Background calves soldf Number 0
Yearling soldg Number 69 93 90
Cull cows sold Number 17 14 19 18
Return to operator
labor and managementh Dollars 6,787 9,635 11,325 11,022
aNo tame pasture establishment or range fertilization was allowed. Sale of calves at weaning was only cattle market alternative. bMarketing of backgrounded calves and yearlings was allowed. Tame pasture establishment and range fertilization were not allowed.
Orarne pasture was established to provide spring (May lo-June 20) grazing for cows and yearlings. Native range could be fertilized with 40 pounds of N, and native range grazing could be deferred until June 20.
dAn S-month grazing season (May lo-December 31) was used. Cattle marketing and pasture management alternatives were the same as in Solution 3.
eMarketed about November 1. fMarketed about April 30. gMarketed about August 1.
hNet returns to operator for his labor and management. Computed by subtracting a capital charge of 7% on long term and 8% on shortterm investment from net ranch income.
$11,022 or 3% less than for Solution 3. This rather small dif- ference in profitability indicates that the choice of grazing season length will probably be influenced greatly by year-to- year variations in winter and available feed supplies.
Effects of Varying Fertilizer Prices
Fertilizer costs are a source of considerable uncertainty. Consequently, price of nitrogen fertilizer was varied to determine the effects of higher prices on the profitability of tame pasture and native range fertilization. Price of ammonium nitrate (33% actual nitrogen) was varied from $50 to $140 per ton. The prices of cattle, grain, and other inputs and the production activities were the same as in Solution 3. With a fertilizer price of $50 a ton, 492 acres of native range and 84 acres of crested wheatgrass were fertilized with 40 pounds of actual N per acre. When the price increased to $65 per ton, native range fertilization was eliminated, but crested wheatgrass increased to 113 acres, partially replacing the native range production. The crested wheatgrass acreage fertilized remained constant at all price levels up to $140 per ton, the highest price included in the analysis. Native hayland (65 acres) was profitably fertilized at all price levels.
Conclusions
Under the conditons imposed in the model ranch of this study, ranch income and returns to the operator’s labor and management can be substantially increased through departures from traditional management practices. Sale of yearlings was more profitable than selling calves at weaning. Crested wheatgrass for spring’ grazing was a more profitable use of marginal cropland than wheat at yearling prices of $40 per cwt and higher compared to a wheat price of $2.05 per bushel. However, yearling prices of $51 per cwt would be needed before good cropland would be used for tame pasture. When crested wheatgrass was established, fertilization at a rate of 40 pounds of actual nitrogen per acre was substantially more profitable than the alternatives of either no fertilization or fertilization at the rate of 80 poynds of actual nitrogen per acre. Fertilization of suitable native hayland also was a profitable practice under a wide range of fertilizer prices. Profitable fertilization of native rangeland on an annual basis required ammonium nitrate prices $65 per ton or less. Thus widespread fertilization of native range is unlikely, given
present cattle price-fertilizer cost conditions.
Recent increases in fertilizer and grain prices and changes in the cattle price structure will influence the profitability of the various alternatives. Prices of yearlings became much higher relative to the price of calves in 1974 than was the case in the 1970- 1973 period. Production of yearlings will be even more profitable, relative to calves, under these conditions. Yearling production also provides the rancher with added flexibility to adjust his herd size to annual fluctuations in the range feed supply. Higher grain prices, of course, make the conversion of cropland to tame pasture less attractive. If high grain prices continue, future research might be directed to the use of selective fertilization to increase cool season grass production of selected native range sites for spring grazing. Periodic applications of herbicides in conjunction with nitrogen to improve range condition (Schneiter and French, 1968) also may be a fruitful subject for economic analysis.
Literature Cited
Dunn, E. V. 1971. Costs and considerations for marketing livestock in North Dakota. North Dakota State Univ., Fargo, N. Dak. Agr. Econ. Rep. No. 74. 31 p.
Goetz, Harold. 1969. Composition and yields of native grassland sites fertilized at different rates of nitrogen. J. Range Manage. 22: 384-390.
Heady, E. O., and W. Candler. 1958. Linear programming methods. Iowa State Univ. Press, Ames, Ia. 588 p.
Leistritz, F. L. 1972. Cattle ranchers using federal land in western North Dakota: resources, costs, and returns. North Dakota State Univ., Fargo, N. Dak. Agr. Econ. Rep. No. 92. 24 p.
Levin, R. I., and R. P. Lamone. 1969. Linear programming for management decisions. R. D. Irwin, Homewood, Ill. 308 p. Lorenz, Russell J., and George A. Rogler. 1973. Growth rate of mixed
prairie in response to nitrogen and phosphorus fertilization. J. Range Manage. 26:365-371.
Price, J. R., and F. R. Taylor. 1974. North Dakota crop and livestock statistics. North Dakota State Univ. and North Dakota State Stat. Office, Fargo, N. Dak. Agr. Stat. No. 32. 76 p.
Saunderson, Mont H. 1973. Trends in western ranch prices and values. J. Range Manage. 26:7-g.
Schneiter, Albert A., and Ernest W. French. 1968. Herbicides and fertilizers for restoring native pastures in North Dakota. North Dakota Farm Res. 26(2): 10-12.
Wagner, H. M. 1969. Principles of operations research applications to managerial decisions. Prentice-Hall, Englewood Cliffs, N. J. 937 p. Wheeler, R. 0. 1970. The range cattle industry of the Northern Great Plains-a comparison of production rates between 1958 and 1967. Montana Agr. Exp. Sta. Bull. 643. 21 p.
CLYDE ROBIN
NATIVE SEEDSCastro Valley, California 94546
Welcome
to Omaha
and the
29th Annual Meeting of the
Society for Range Management
Resource Integration to Meet Society’s Needs
February 16-20,1976 Omaha Hilton Hotel
Omaha, Nebraska
Effect
of Desert
Termites
on Herbage
and
Litter
in a Shortgrass
Ecosystem
in West
Texas
MICHAEL C. BODINE AND DARRELL N. UECKERT
Highlight: The desert termite, Gnathamitermes tubiformans, is an important insect on rangelands in the southwestern United States. Population densities of this insect averaged 2139/m* in the upper 30 cm of soil in a shortgrass community in West Texas over a 3-year period and reached a peak of 9127/m*. The ,live biomass of termites averaged 5.2 g/m* and reached a peak of 22.21 g/m*. In a laboratory study, desert termite workers consumed 2.4% of their live body weight/day of dry buffalograss leaves. In field studies, control of desert termites with insecticide resulted in a 22% increase in standing crop of grass and a 50% increase in litter accumulation by the end of the second growing season after control was initiated. Termite-free plots had almost three times more litter than termite-infested plots after four growing seasons. Desert termites accounted for S5% of the disappearance of litter from the soil surface. Ranchers can expect higher population densities of desert termites and hence greater consumption of forage and litter during wet years.
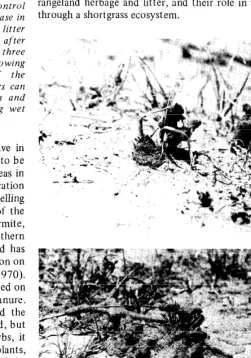
Termites are viewed as both beneficial and destructive in many ecosystems. In some instances they are thought to be important in nutrient cycling and soil formation, whereas in others they are regarded as major factors in range deterioration and soil erosion. A number of species of ground-dwelling termites are restricted to the arid and semiarid lands of the southwestern United States. The desert termite, Gnathamdtermes tubiformans (Buckley)’ , occurs in southern New Mexico, Texas, Arizona, and northern Mexico and has been reported to destroy large areas of growing vegetation on grazing lands (Light, 1934; Snyder, 1949; Weesner, 1970). This species lives in the soil and comes aboveground to feed on grasses, forbs, dead herbage, dry wood, and livestock manure. This insect constructs mud tubes or sheetings around the surfaces of its food (Fig. 1). It does not penetrate wood, but removes only the surface material. When attacking herbs, it often consumes the entire aboveground portions of the plants, leaving intact its earthen tubes with the general shape of the
Authors are graduate research assistant and associate professor, Range and Wildlife Management Department, Texas Tech University, Lubbock, 79409. Bodine’s present address is P.O. Box 695, Sterling City, Tex. 7695 1.
This paper is Texas Tech University, College of Agricultural Sciences Publication No. T-9-l 50.
Manuscript received January 29, 1975.
’ Isoptera: Termitidae.
consumed vegetation. The workers and soldiers come above the soil surface at night and during the cooler parts of the day to forage, and are particularly active after rains (Light, 1934; Calaby and Gay, 19.59; Weesner, 1970).
The loss of forage and litter from the soil surface to these insects frequently alarms ranchers and range managers, hence this study was undertaken to determine their impact on rangeland herbage and litter, and their role in the energy flow through a shortgrass ecosystem.
Literature Review forest in Australia.
Maldague (1964) estimated the population density of subterranean and mound-building termites in Brachystegia
forest in the Congo at 1000/m2 with a total biomass of 10 g/m” (live weight). Lee and Wood (1971) estimated the population of N. exitiosus, a mound-building termite in Australia, at 600/m’ with biomass of 3.0 g/m2. Strickland (1944, 1945) reported population densities of subterranean termites of 3864/m2 and 5473/m2 in Trinidad rain forest. Lee and Wood (1971) reported population densities of 1 2/m2 in desert grasslands and steppe of Southern Australia and 2000/m’ in native grasslands of Northern Australia. They theorized that the biomass of termite populations may approach or exceed that of native mammalian herbivores in some habitats, and may thus result in dietary competition. Lee and Wood (1971) listed various foods utilized by
termites, including living and dead wood, forbs and grasses, plant debris, fungi, dung, and soil rich in organic matter. Termites feed on plants at all stages of growth, and their feeding damages roots, stems, leaves, and seeds of the host plant (Reddy, 1960; Sankaran, 1960). Harvester termites cut down standing grasses and forbs, while scavengers collect leaves, twigs, seeds, plant litter, dung, and other substrate from the soil surface. Many species are polyphagous or oligophagous (Lee and Wood, 1971).
Many instances of termites feeding on living vegetation have been documented. Krishnamoorthy and Ramasubbiah (1960) reported that termites fed on green house plants, field crops, and forage plants on grazing lands. Reddy (1960) stated that nearly every agricultural crop in the humid tropics is fed upon by termites. Ferrar and Watson (1970) reported that termites feed on grasses, crops, and live wood in Australia. Watson and Gay (1970) determined that Drepano termes perniger (Froggatt) and D. rubriceps (Froggatt) were principally responsible for the degradation of a mulga ecosystem in Queensland, Australia. These termites increased in numbers during years when grass was abundant. During ensuing drier conditions, the termites removed the remaining grass and litter, leaving denuded areas which were subject to extensive erosion of the topsoil. Coaton (1954, 1960) discussed the impact of the harvester termites Hodotermes mossambicus
(Hagen) and Microhodo termes viator (Latreille) on grasslands in South Africa. He felt that overgrazing, failure to apply rotational grazing, and burning of the veld in late winter resulted in a denuded condition which was favorable to a progressive increase of termite population levels and consumption of practically all of the grass produced. In Zululand, termites were believed to be responsible for a 25% decrease in carrying capacity of the grasslands.
Many species of termites are believed to compete with grazing animals for forage, to actually damage forage resources, and to interrupt soil nu,trient cycles. On the other hand, some termites are thought to be beneficial in their effect on the soil. Lee and Wood (1971) summarized these inconsistencies by stating: “One cannot say, on the basis of present knowledge, whether or not grass-feeding termites can be ranked with kangaroos as low-level competitors to be tolerated and possibly ‘managed,’ or whether like the rabbit, they should be more or less exterminated.” Krishna and Weesner (1970) reported that less than 10% of the known species of termites have actually been recorded as pests, and that they are actually very important in nutrient cycling and soil formation. Lee and Wood (1971) have surveyed the literature on the influence of termites on nutrient cycling and soil properties.
Termites aid in the decomposition of wood and plant litter, thereby contributing to the formation of humus and cycling of nutrients (Adamson, 1943). Hopkins (1966) reported that termites were largely responsible for the decay of wood in certain habitats in Nigeria. Maldague (1964) estimated that
Cubitermes fungifaber (Sjiistedt) consumed approximately 50% of the annual litter fall in a Brachystegia forest near Yangambi, Congo; however, Lee and Wood (1971) believed Maldague’s estimate to be too high, and reported that it was actually 10% or less. Lee and Wood (197 1) reported that
Nasutitermes exitiosus (Hill) consumed 16- 17% of the woody litter, or 4.9% of the total annual litter fall in a dry sclerophyll
Methods and Materials Study Area
The study was conducted 19.2 km southwest of Post in Garza County, Texas, on the southeastern edge of the Llano Estacado. The climate of the area is semiarid, characterized by low precipitation, high evaporation, hot summer days followed by cool nights, and moderate winter temperatures punctuated by severe cold spells. Annual precipitation in the area ranges from 22 cm to 103 cm, with a mean of 48 cm, about 85% (41 cm) of which falls between March and October. However, high winds and high temperatures contribute to an annual evaporation of 185 cm. The annual snowfall is 19 cm. The frost-free period is about 201 days (Mowery and McKee,
1959).
The soil throughout the study area is an Olton clay loam. The topography of the area is nearly level to gently rolling, with a 0- 1% north-facing slope. The vegetation consists primarily of blue grama (Bouteloua gracilis H.K.B.), and buffalograss (Buchloe dactyloides Nutt.). Minor grass species include red threeawn (Aristida longiseta Steud.), sand muhly
(Muhlenbergia arenicola Buckl.), vine-mesquite (Panicum
obtusum H.K.B.), tobosagrass (Hilaria mutica (Buckly) Benth.), and silver bluestem (Bothriochloa saccharoides (SW.) Rydb.). Honey mesquite (Prosopis glandulosa Torr.) is the major shrub species.
Termite Population Density and Biomass
To determine the population density of subterranean termites, 40 randomly selected soil cores (81.07 cm2 X 30.18 cm) were taken monthly. Each soil core was sealed in a plastic bag and returned to the laboratory to be manually examined for termites. The termites were counted and a mean number of termites/m* was calculated. The average biomass of individual
Table 1. Mean population density (number/m2 ) and biomass (g/m’) (live weight basis) of desert termites in the upper 30 cm of soil in shortgrass rangeland in Garza County, Texas, during 1972, 1973, and 1974 and the growing seasons (March through October) of these years.
Time interval Years
1972 1973 1974 Growing seasons
1972 1973 1974
Population density’ Population biomass
3672 a 8.93
1692 b 4.12
1152 b 2.80
4730 c 11.51
2640 d 6.42
1482 e 3.61
1 Means within a column different at P < 0.10.
worker termites, determined by weighing three groups of 100 live specimens, was used as the mean weight of all castes and instars to convert population densities to g/m*.
Herbage Consumption
Laboratory study.
Laboratory feeding trials using G. tubiformans workers were conducted during September, 1972, to determine the mean rate of dry matter consumption. The trials, in which live workers were collected in the field and placed in 3.8-liter glass jars, l/3 full of moist sand, and covered to exclude light, were
replicated five times. Oven-dried buffalograss leaves were placed in each jar with the termites. After 10 days, the contents of each jar were emptied, the remaining termites were counted, and the remaining leaves oven-dried and weighed. Dry matter consumption per termite per day (D) was calculated according to the equation:
D= ‘i - ‘n (l/10) 7 l/2 (Ni + N,)
where Xi = initial weight of oven-dried buffalograss leaves, X, = final weight of oven-dried buffalograss leaves,
Ni = initial number of termites, and
N, = final number of termites.
The temperature of the laboratory during these feeding trials was approximately 28°C.
Field Study.
Paired plots (0.6 ha in area) were established during July, 1971, and one plot was sprayed with chlordane (octachloro4, 7-methanotetrahydroindane) at a rate of 3.37 kg AI/ha to control termites. The insecticide treatment was applied again in April, 1973, to maintain essentially 100% termite control. One exclosure (4.6 m X 4.6 m) was constructed on each plot to eliminate the influence of livestock on herbage production and litter accumulation. Both plots were deferred from grazing during the 1974 growing season.
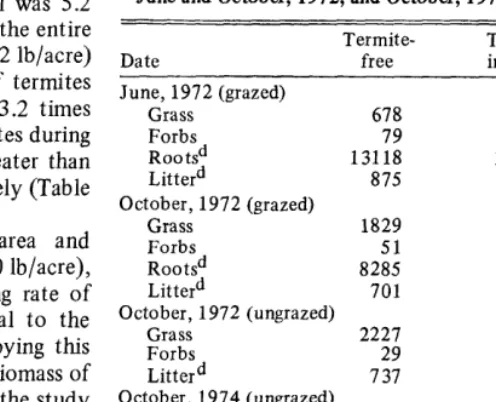
The standing crop of grasses, forbs, and litter was sampled on June 5 and October 10, 1972, and again on October 18, 1974 (11, 15, and 39 months subsequent to initiation of termite control, respectively). On each plot, 45 randomly selected 0.25-m’ circular quadrats were clipped to ground level to determine standing crop biomass of grasses and forbs. A Devac@ insect vacuum was used after clipping to collect the litter from each quadrat. Herbage and litter samples were oven-dried at 63’C for 72 hours and weighed. The litter samples from each plot were combined, and a composite sample was ashed in a muffle furnace at 600°C for 8 hours. The oven-dried weight of each litter sample was then converted to an ash-free weight. During October, 1972, five 0.25-m2 circular quadrats were sampled in each exclosure to determine the standing crop of forage and litter.
Belowground plant biomass was determined during June and October, 1972, by extracting the major roots from 40 randomly selected soil cores (81.07 cm2 X 30.18 cm) taken from the sprayed plot and from 40 similar cores taken from the unsprayed plot. Each soil core was washed over a No. 40 soil sieve (0.42-mm mesh) to separate the soil and roots. Root samples were oven dried, weighed, and ashed to determine an ash-free weight for each sample.
Standing crop data of grasses, forbs, roots, and litter on termite-infested and termite-free plots were analyzed for significant differences using the t-test (Snedecor and Cochran, 1967).
Litter Bag Study.
The rate of removal of organic material from above and below the soil surface by termites was estimated using the
JOURNAL OF RANGE MANAGEMENT 28(5), September 1975
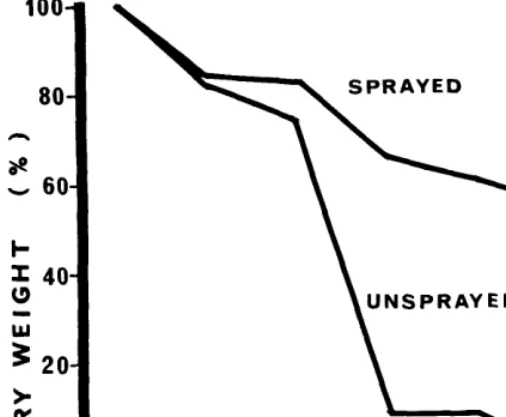
litter-bag technique described by Bocock (1964). On April 4, 1972, 240 nylon net bags (30 cm X 30 cm, 3-mm mesh) were filled with 10 g of oven-dried blue grama leaves, and 60 were placed on the soil surface and 60 were placed 15 cm below the soil surface on both termite-infested and termite-free areas. Each month from May through December, five bags were collected at random from each treatment and weighed. Differences in disappearance were attributed to termite consumption.
Results and Discussion Termite Population Densities
The mean population density of termites on the unsprayed plot was 2139/m2 f 688 (90% confidence limits) over the 3-year period. The peak in population density occurred in September, 1972 (9127/m2). There were usually no termites in the upper 30 cm of soil during the winter months (November, December, January, and February). Population densities varied significantly between years and between growing seasons (Fig. 2) (Table 1). The population density during 1972 (3672/m2 +_ 2076) was significantly higher than during 1973 (1692/ m2 +_ 995) (P< 0.1) and 1974 (1 152/m2 +_ 616) (P < 0.02). The population density during the growing season (March through October) of 1972 (4730/m2 f 1883) was also significantly higher than during the 1973 growing season (2640/m2 2 1194) (P < 0.1) and the 1974 growing season (1 482/m2 +_ 635) (P < 0.01). These differences in termite population densities were attributed to annual and seasonal fluctuations in air and soil temperatures, precipitation, and soil moisture (Ueckert et al., unpublished data). In years or growing seasons of relatively abundant precipitation, temperature was the most important factor affecting desert termite population densities; under more xeric conditions, soil moisture was the most important factor. Termite population densities were positively correlated with temperatures and soil moisture. Conditions were considerably more mesic in 1972 than during 1973 or 1974.
Termite Population Biomass
The mean weight of a live G. tubiformans worker was 2.433 mg and its mean oven-dry weight was 0.584 mg. We used these values as an approximation of weights for all castes of termites
10
8
I
-1972--1973--1974-