CO
2neutral fuels
Adelbert P. H. Goede(∗)
Dutch Institute for Fundamental Energy Research DIFFER PO Box 6336, 5600 HH Eindhoven, The Netherlands
Summary.— CO2is a valuable resource, life on Earth depends on it. Rather than wasting it to the atmosphere, or burying it underground, CO2can be combined with water and turned into valuable chemicals and fuels, the process being powered by re-newable electricity. Rere-newable electricity generated by wind and photovoltaics (PV) is making big strides, but is limited by ill-matched supply and demand. In addition, electricity only makes up 20% to 30% of total energy demand. Domestic heating, high temperature/pressure Industrial processes and mobility/transportation gobble up the rest. Mobility and transportation prove particularly difficult to decarbonise. Aviation is a case in point. Battery-powered aircraft are unlikely to become feasible by 2050. Hydrogen has too low an energy density and is haunted by safety issues. Current policy, therefore, is directed at bio fuels. One problem, there is not enough of it. The Fuel vs. Food vs. Flora trilemma of bio-based fuel is unlikely to gain public acceptance. By converting renewable electricity into fuel, power to molecules (P2M), two birds are killed with one stone: providing fuel for long haul trans-portation and enabling long-term, large-scale energy storage to cover the seasonal mismatch between supply and demand of renewable electricity. Feedstock consists of air-captured carbon or nitrogen and water. Chemically combined, it creates a liquid fuel with greatly enhanced energy density, such as kerosene or ammonia, or gaseous fuel like methane which can replace natural gas in the existing gas network. Direct air capture of CO2 is currently being commercialised. The conversion tech-nology of water and CO2by electrolysis has recently been extended to novel plasma technology, the subject of this paper. For CO2 splitting by plasmolysis, the reduced
electric field has been identified as the key parameter explaining and improving the energy efficiency. Energy efficiency by plasmolysis is similar to that of electroly-sis, but offers advantages in energy density, upscaling and switching in response to intermittent power with no use of scarce material. A simple model explains the inverse relation between energy efficiency and particle conversion and relates input microwave power to CO2 gas density, plasma dimension and ionisation degree, al-lowing design parameters for a 100 kW pilot reactor to be specified. Recycling CO2 in combination with P2M is a game-changing technology to meet overall CO2 emis-sion reduction targets. It takes advantage of existing, inexpensive infrastructure for energy storage, transport and distribution. Existing internal combustion engine technology can be maintained where necessary. Close coupled to a remote solar array or an off-shore wind farm it offers a solution to decentralised renewable fuel production at the renewable electricity source.
1. – The energy transition
The next 20 years will mark a fundamental shift in the way energy is generated, stored, delivered, valued and purchased. Unlike nuclear, this energy transition will be market-driven, for governments can regulate and facilitate, industries can produce the goods, but consumer demand will ultimately decide the fate of this energy transition. This view is shared by the European Commission. Germany, pioneer in the energy transition, has added further requirements: the energy must be clean, secure and affordable. Targets for 2030 and 2050 have been set by International Agreement (UNFCCC), by the EU (RED) and by National policy [1, 2]. The road to get there, however, is largely unchartered.
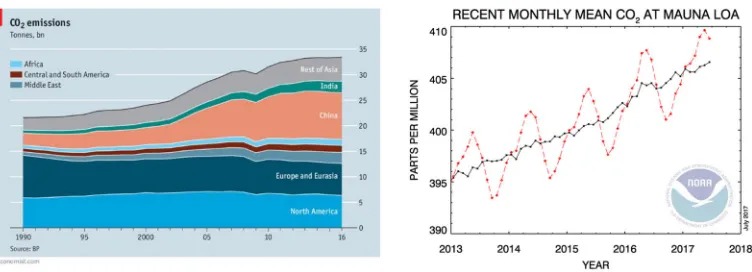
The driver of the energy transition is climate change. Mitigation policy is based on reduction of greenhouse gas emissions, notably CO2emissions from the use of fossil fuels. Currently, the rise in CO2 emissions show signs of levelling off, see fig. 1a). The cause is attributed, not to an increased share of renewables, but to a slowing of the economy and an improved energy efficiency. What counts, however, is not CO2emission, it is the CO2concentration in the atmosphere that determines greenhouse radiative forcing. This CO2 concentration shows no sign of levelling off, see fig. 1b). Governed by the coupling between atmosphere and ocean, it may take decades, if not centuries, before the effects of CO2 emission reduction become tangible, ocean inertia being the rate determining factor in the climate system.
Fig. 1. – a) Global CO2 emissions from energy use roughly flat over 2014–2016. Economic downturn and improved energy efficiency are partly responsible. Source: BP and The Economist, 17 June 2017. b) Atmospheric CO2concentration measured at Mauna Loa ground station. Red is monthly mean, black is seasonally corrected moving average. Source: NOAA.
Faced with a growing world population and an increasing level of consumption, bio energy is in competition with food and flora and, in any case, will not suffice to meet future world energy demand [3]. Fossilised biomass, created over several 100 million of years is resource limited and not renewable over human life span.
Alternative renewable energy sources are thus needed. Renewable energy schemes pursued to date are based on either direct conversion of solar photons into fuel, or indirectly, through the intermediate of renewable electricity. The direct conversion route, or artificial photosynthesis, mimics nature by combining solar energy conversion and fuel synthesis into one device, whereas the indirect route converts to electricity first, followed by fuel synthesis in a separate step powered by renewable electricity. Feedstock, in both cases consist of air and water. Most renewable energy sources deployed to date generate electricity, hence tailored to the indirect solar fuel production concept.
Electricity covers only about 20% to 30% of primary energy consumption, the re-maining 70–80% going into low-temperature domestic heat (usually natural gas), high-temperature industrial heat (usually coal) and transportation (mainly oil). Typical CO2 emissions produced over the various sectors are listed in table I, presented for the case of The Netherlands. It shows that CO2 emissions are roughly equally attributed over all sectors at around 20%. Hence, in order to meet CO2 emission reduction targets, it is paramount to shift current focus away from the electricity system towards the energy system as a whole.
TableI. – CO2 emissions attributed to the various sectors of the economy for The Netherlands. The Netherlands accounts for0.5%of globalCO2 emissions, the EU for10.5%, see also fig.1a)
for worldCO2 emission distribution.
CO2 emission budget The Netherlands 0.5%
Power and lightning electricity 26%
Low-temperature domestic heat gas 18%
High-temperature industrial heat coal 19%
Transport (cars, ships, airplanes) oil 17%
Non-energy emissions (agriculture,
20% waste, chemical feedstock)
Typically CO2 emission distribution 20:20:20:20:20
Source: Energy Agenda, Min. Econ. Affairs, Dec 2016/97015
agreed on a 50% CO2emission reduction by 2050 as compared with 2005 [5]. These down rated CO2 emission targets illustrate the difficulty faced in transforming the transport sector into sustainability.
2. – Hydrogen economy
One radical option to transform the transport, heat and chemical sectors into sus-tainability is a hydrogen-based economy. This option has been around for a while and could be instrumental in the coupling of the electricity sector to the other sectors of the energy system. Hydrogen, however, is a highly flammable and volatile gas with a low-energy density of 0.01 MJ/ltr at ambient pressure and temperature. Also, it brittles metal containers. This limits the ability to store and transport hydrogen and to use hydrogen as an energy carrier. Combined with the high cost of producing renewable hydrogen, deployment of hydrogen as an energy carrier has been limited so far.
Several options to overcome the low-energy density problem of hydrogen are being explored, including hydrogen compression at 700 bars for storage in vehicles or at 200 bar for large scale storage in salt caverns, liquefaction at 20 K and storage in metal hy-drides, Metal Organic Frameworks (MOF), Liquid Organic Hydrides (LOHC) or carbon nanotubes.
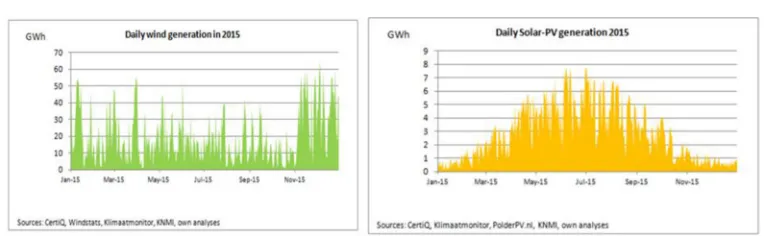
stor-Fig. 2. – a) Wind intermittency over N-W Europe showing a large dynamic range (factor 100) on a day to day basis. Seasonal variations of a factor 2 to 3 is in phase with heat demand but not quantitatively. b) Solar PV electricity is in phase with diurnal demand, but not quantitatively with surplus during the day, shortage at night. Dramatically out of phase with renewable PV supply is seasonal heat demand over Northern EU latitudes, winter insolation being only 10% of summer whilst heat demand is up by a factor four. Courtesy Martijn Visser of Energy Academy Groningen, The Netherlands.
age and transportation, benefiting from existing infrastructure, whilst the well-qualified Internal Combustion Engine (ICE) technology remains to serve long haul transportation. Hydrocarbons, however, require carbon capture (CC) in order to close the carbon cycle and render the fuel cycle carbon neutral. No carbon is involved in storing hydrogen in ammonia (NH3). Apart from the pungent smell, ammonia is characterised by low flammability, high hydrogen storage density of 17.6% by mass and 107g H2/ltr and a high energy density of 11.5 MJ/ltr. Furthermore, ammonia is an essential element in the food chain being at the basis of fertiliser production. The fixation of nitrogen to hydrogen has allowed human population to grow without running out of food, overcoming the 19th century Malthusian dilemma of population growth outpacing food supply.
Modern ammonia plants employ steam methane reforming (SMR) to produce the hydrogen needed to react with atmospheric nitrogen under high pressure and high tem-perature, the Haber-Bosch process. This is an energy intensive process, and in addition, relies on fossil feedstock. Current ammonia production accounts for 1.4% of global CO2 emission. For ammonia to become sustainable as an energy carrier both the formation process and the feedstock must become CO2 free. Powering the process by renewable electricity and deriving hydrogen from electrolysis of water would be an option within reach of existing technology. However, it would be highly desirable to develop a less en-ergy intensive ammonia synthesis process, mimicking nature by departing from air and water. Electro-chemistry and non-equilibrium plasma chemistry may hold the key to such nitrogen fixation pathway.
3. – Energy storage
Fig. 3. – a) Gas demand [GWh/day], mainly heat, shows seasonal variation of factor 4. b) Elec-tricity demand [GWh/day] almost flat at±10% throughout the year. Courtesy Martijn Visser, Energy academy Groningen, The Netherlands.
is needed for several reasons, illustrated by figs. 2 and 3. On the supply side wind power creates large peaks and troughs in electricity generation, a dynamic range of a factor 100 between lulls and gusts in a matter of minutes is not unusual, wind power scaling with wind velocity cubed. PV displays a more predictable diurnal cycle but, obviously not matched to demand at night. Electricity overproduction during the day must be tidied over to cover night-time demand. An energy buffer acting on a short time scale of msec to days is necessary to smooth out the fast variations in the generation of renewable electricity.
Power to Heat (P2H), employing heat pumps and storage heaters to siphon off surplus electricity, may well provide a solution to cover the diurnal mismatch between RE supply and demand in domestic heating. But P2H would offer no solace in covering seasonal RE mismatch. Seasonal heat demand over Northern Europe is shown in fig. 3a), gas serving as a proxy to heat demand, again for the Dutch situation. Demand for heat in winter exceeds that of summer by a factor of four on a weekly basis. On shorter times demand is even more volatile. Electric power demand, on the other hand, is almost flat, see fig. 3b) showing a±10% variation over the year. A doubling in electric power transmission to cope with seasonal heat demand variation will be costly and such grid will run idle for most of the time being massively oversized during summer. The current practise of curtailment of subsidised wind power during summer will be difficult to justify towards tax payers.
The energy supply - demand mismatch requires a buffer covering seasonal to inter-annual time scales. Existing technologies, including batteries, super capacitors, flywheels, pumped hydro and CAES (Compressed Air Energy Storage) suit the requirements of short-term energy storage, but offer no solution to large-scale seasonal and inter-annual energy storage requirements.
TableII. –Comparison of capital investment cost per kW power transported for electricity and gas transport lines in comparable situation. Gas is a factor20cheaper. Source: Gas Unie, The Netherlands.
Power: BritNed Gas: BBL
Length 260 km 230 km
Investment 600 M¤ 500 M¤
Capacity 1 GW 20 GW
Specific investment costs ¤230/kW/100 km ¤11/kW/100 km Nord Stream gas pipeline:¤9/kW/100 km (Russia to Europe via Baltic).
in 2050 [6]. For the Netherlands, RE surplus is expected to amount to 1.5 TWh in 2025 (∼1% total energy production) increasing to 30–55 TWh in 2050 [7]. For France, these numbers are 15 TWh for 2030 and between 44 and 91 TWh for 2050, respectively [8].
4. – Power to M
Converting renewable electricity into energy dense gaseous or liquid fuel presents a solution to long-term, large-scale energy storage. This is the Power-to-Molecules (P2M) scheme, where molecules stand for synthesised gas or liquid fuel or chemicals. P2M has the powerful ability to couple the electricity sector to the gas, the oil and the chemical sector, leading the way to CO2 reduction of the energy system at large. Existing inex-pensive infrastructure for energy storage and transport is readily available. The Dutch gas net alone unlocks a massive 550 TWh energy storage capacity. Transportation of energy by gas is more than a factor 20 cheaper than energy transport by electricity, see table II.
Currently, Europe runs about 50 pilot and demo P2G projects, about half of them in Germany, with efforts accelerating over the past years. These projects anticipate a substantial RE surplus generated in all RES scenarios by 2050 and recognise the difficulty to store and transport this surplus electricity on a large scale. The existing gas grid provides both storage and transport infrastructure that meets seasonal requirements for heat and overcomes the inherent limitations in storage of renewable electricity.
For transportation similar dilemmas are encountered. Batteries are free from carbon emission during operation. However, they suffer from low-power density compared with hydrocarbon fuel, which limits their range. Taking again the extreme example of long haul aviation: to replace the energy content of a 260 tonnes of kerosene load of an Airbus 380 at take-off, the most advanced Li-ion battery would weigh 14.000 tonnes. The plane will never take off. Long haul aviation powered by batteries is unlikely to become feasible by 2050.
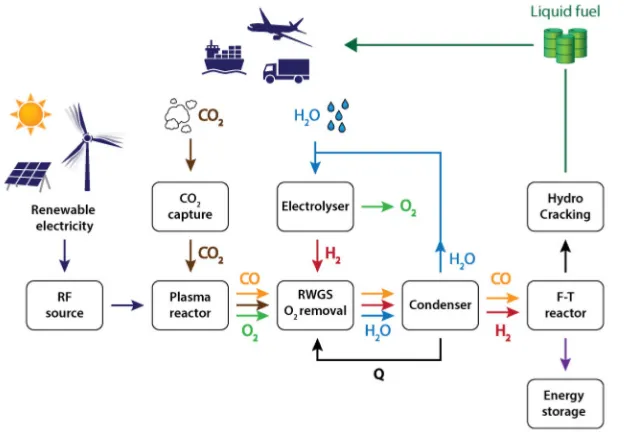
Fig. 4. – The CO2 neutral fuel cycle of an internal combustion engine driven by hydrocarbon fuel, illustrated for the case of aviation. Sustainable aircraft grade kerosene is produced from water and air powered by renewable electricity through the splitting of CO2, formation of syngas and Fischer-Tropsch synthesis. By recapturing the CO2 directly from air, the CO2 cycle has come full circle. Source: EU H2020 funded KEROGREEN project [9].
industry anticipates. However, batteries will not meet long-distance road transportation requirements, in particular not for heavy-duty lorries. The hydrocarbon powered internal combustion engine is unlikely to lose its grip on the motorways by 2050.
5. – Conversion of renewable electricity into fuel
The conversion step of electricity into fuel and chemicals is the critical step, both technically and economically. Basic research and development of cost-competitive electro-chemical solutions are subject of current R&I effort. Electro-electro-chemical conversion is based on the electrolysis of water and CO2into syngas. Syngas is the key mixture around which the synthesis of hydrocarbons revolves. The process is known as Fischer-Tropsch (FT) synthesis. Both electrolysis and FT technology have been around for about 100 years. Deployment so far has been limited to strategic use in South Africa and Nazi-Germany when oil embargos threatened fuel supply. At this point in time, however, high cost and upscaling is the limiting factor to large-scale implementation.
oxygen is separated out and the CO partly converted into hydrogen by the water gas shift reaction creating syngas, a mixture of CO and H2. Out of syngas hydrocarbons are formed by Fischer-Tropsch (FT) synthesis. The wax produced is further processed by hydrocracking to create kerosene. FT synthesised fuel at 50% blending ratio is ATSM certified as jet grade fuel. Upon combustion, CO2and H2O are emitted. By recapturing the CO2 directly from air, the fuel cycle is closed, a CO2 neutral fuel cycle is created which does not add to the atmospheric CO2 concentration.
Synthetic fuels, based on C-H-O compounds, usually display absorption bands in the infrared and are thus greenhouse gases (GHG). Compared with CO2their Global Warm-ing Potential (GWP) maybe higher, but their relatively short atmospheric lifetime will diminish their long-term impact on global warming. For example, methane is a more potent GHG than CO2 on a molecule by molecule basis. However, the atmospheric life-time of methane is about 10 year, far less than the several hundred years that CO2stays in the atmosphere. Manmade methane emissions may result from leaking gas pipelines, estimated to amount up to 10% of total gas flow for Siberian gas transport. Methane release from the vast Siberian permafrost region may be instrumental in kick-starting climate change before CO2 greenhouse warming takes over, a situation encountered in the Quaternary periods when ice ages and warm spells succeeded in quick succession.
On air pollution synthetic fuels meet the most stringent regulation; there is no soot because the synthesised fuels contain no aromatics, there is no sulphur because synthe-sis is based on H2O and CO2 only, and NOx formation is lowered by tuning the ICE
combustion temperature.
Carbon neutral fuels offer energy security and reduce the dependency and cost of imported fossil fuels. Feedstock consists of abundant CO2 and H2O, and power derives from indigenous renewable electricity. The fuel can be stored at large scale for an ex-tended period of time, transported and distributed to customers by existing, inexpensive infrastructure, with no need to expand the electricity grid.
6. – Electro chemistry
Electro-chemical conversion of H2O and recently CO2 is traditionally based on al-kaline electrolysers. The technology is commercially available. Power density is low (0.1 W/cm2) which means sizable plant lay-out. Proton Exchange Membrane (PEM) electrolysers are at early commercial stage and show higher energy efficiency and power density (1 W/cm2), allowing more compact sized equipment and up-scaling to MW level within reach [10]. However, PEM employs an expensive membrane and noble metal electro-catalysts, i.e.platinum and iridium, resulting in cost and sustainability issues. Degradation causes limitations to membrane operational life time.
at the triple phase boundary layer between gas reactant, electrode and catalyst is poorly understood [13]. Both alkaline and SOC do not respond well to intermittent renewable electricity.
7. – Plasma chemistry
Plasma-chemical conversion or plasmolysis increases the power density and consequent productivity by more than an order of magnitude compared with SOC. Electro-chemical conversion is a surface process taking place at the gas-electrode interface. By contrast, plasma chemical conversion is a volume process and hence scales with dimension cubed rather than dimension squared of a surface process. Combined with high gas flow rates, upscaling to high CO production rates at 100 kW power level is feasible. Plasma chem-ical conversion does not employ scarce materials and a plasma responds instantly to intermittent input power.
The plasma eases conditions for splitting CO2 through vibrational excitation of the molecules, not through direct electron impact dissociation, electron dissociative attach-ment or through heating of the gas [14, 15]. As a consequence, vibrational temperature exceeds the translational and the rotational temperatures, the CO2gas is in a thermody-namic non-equilibrium state. The CO2gas is weakly ionised —only one in 105molecules is ionised— and is relatively cold, similar to a fluorescent lamp. The energy to produce the plasma is a relatively small fraction in the energy balance.
By tuning the electron energy distribution function EEDF, energy is directed mainly at the CO2 vibrational degree of freedom, not to translational or rotational energy. A non-equilibrium condition is created whereby the vibrating molecules impart vibrational energy on each other, ratcheting up vibrational energy of one molecule at the expense of others, ultimately breaking the CO2 molecular bond. Most effective in vibrational dissociation is the CO2 asymmetric stretch mode, stretching the O atom away from the CO part of the linear CO2molecule. This mode is excited most effectively by relatively low energy electrons in the range of 0.4–2 eV [16].
Dissociation to CO proceeds in two steps: first one molecule CO and one atomic oxygen O are formed at 5.5 eV dissociation energy. Subsequently, the atomic oxygen reacts with another exited CO2 molecule to form a second CO at 0.3 eV net energy, yielding a net enthalpyH for the production of one CO molecule H = 5.8/2 = 2.9 eV. This is much lower than direct electron dissociation and lower than the>7 eV required for an electron induced Franck-Condon transition [15]. The loss of vibration energy by vibrational-translational relaxation is reduced by cooling the gas, notably for the asymmetric stretch mode [17]. Low gas temperature (T0 < 1000◦C) also prevents the reverse CO2 forming reaction from taking place. Low temperatures are obtained by supersonic expansion of the gas through a nozzle.
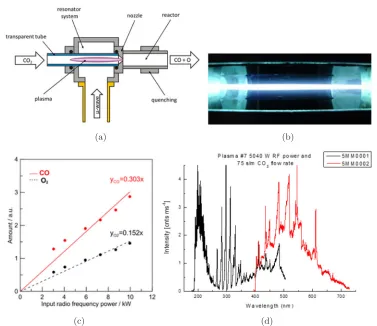
tangentially at the entrance of the reaction chamber to create a vortex gas flow aimed at stabilising the plasma by creating a radial pressure and temperature gradient. Gas com-position measurements are based on quadrupole mass spectrometry (QMS) and optical emission spectroscopy (OES). Gas pressure is measured at the entrance and at the exit of the reaction chamber. A typical plasma discharge is shown in fig. 5b) [20-22].
Experimental results show production rates of 7.5 slm CO at 200 mbar pressure at a CO2 gas flow rate of 75 slm. The energy efficiencyη, defined in sect.11, reaches 60% at 3 kW microwave power (915 MHz) absorbed. The CO2to CO conversion ratio is relatively low at 10% for safety reason. However, conversion ratio CO2 to CO is shown to scale linearly with RF power and inversely with gas pressure to reach 70%, see fig. 5c) and fig. 12. A typical CO spectrum is shown in fig. 5d). Linear scaling of CO concentration with power is confirmed by CO line strength measurement.
7.2. Plasmolysis vs. electrolysis. – The effectiveness of plasma against electro chem-istry is illustrated by comparing the physical size of the plasma reactor itself with an SOC electrolyser producing the same amount of O2flux. Plasma O2 production rate per kW input power is 1.25 slm O2, which corresponds to 0.93·10−3mole O2/s. At typical SOC transport of 1 A/cm2 this requires about 358 cm2 SOC surface area (Faraday constant 1/4F to account for transport of 2 double negatively charged O atoms). By contrast, the surface area surrounding the plasma is about 30 cm2. Hence, plasma productivity is up by a factor 10 by volume compared with SOC electro-chemical conversion for the same surface envelope.
The relevant parameter in achieving high vibrational excitation and subsequent high energy efficiency and conversion, turns out to be the reduced electric field E/n, see sect. 10and subsect. 14.2. Although known from theoretical studies [23], these exper-iments show direct experimental evidence for the first time [21]. CO2 molecules are vibrational excited by low energy electrons in the range of 1 eV where the reaction rate peaks at about 10−8cm3/s. This is achieved by adjusting the mean free path of plasma electrons accelerated in the externally applied RF electric fieldEand tuning the neutral particle densitynto obtainE/n∼10−16V cm2. Current CO2 plasmolysis development is directed at optimisation of the reduced electric field E/n and reduction of the CO2 gas temperature, both aiming at an increased energy efficiency.
(a) (b)
(c) (d)
8. – Gas separation
A major challenge is the separation of O2from the CO2, CO, O2gas mixture produced by plasmolysis of CO2. Notably the separation of the oxygen molecule from the nearly equally sized CO molecule, with kinetic diameters of 0.346 nm and 0.376 nm, respectively, is not trivial. Various schemes have been considered, based on paramagnetic properties of oxygen, cryogenic distillation and membranes. The membrane scheme includes polymeric membranes, MOFs, ceramic microporous membranes, mixed ion electron conducting membranes and electrochemical oxygen pumps.
The latter, considered here, is a solid oxide cell (SOC), similar to that used in high-temperature fuel cells and electrolysers. It consists of a thin electrolyte sandwiched between two oppositely biased electrodes, one of these usually providing mechanical support. An SOC operates in the temperature range 700 to 800◦C where the material becomes conductive to negatively charged oxygen ions. If the SOC is operated as an electrolyser, the plasma electrode displays high electro-catalytic activity in reducing CO2. If the SOC is operated as an oxygen selective pump it supresses the back reaction of CO by the electrochemical O2 reduction reaction and transport of ionic oxygen away from the electrode surface into the electrolyte.
SOC composed of perovskite electrode material and an Yttria stabilized Zirconia (YSZ) electrolyte have shown remarkable properties that can be fully exploited in oxygen gas separation. They act as an oxygen extractor and a barrier to other species in gas mixtures when subjected to electrical potential gradients. Issues include the oxidation of CO by gaseous or lattice oxygen at the hot plasma electrode surface in competition with desired catalytic reduction of CO2at that surface. Furthermore, chemo-mechanical compatibility of electrode-electrolyte materials and negative oxygen ion conductivity are key parameters. The reaction kinetics of oxygen reduction O2+ 4e− → 2O2− at the plasma electrode is influenced by both the plasma sheath electric field and the externally applied voltage across the SOC membrane. Both compete in pulling electrons out of the plasma electrode interface.
8.1. Perovskite membranes. – Lanthanum-based perovskite membranes yield supe-rior oxygen flux values for oxygen separation. State-of-the-art materials for solid ox-ide fuel cells are based on an electrolyte of Yttria stabilized Zirconia (YSZ) and a Ni/YSZ cermet fuel electrode. The oxygen electrode is a La0.85Sr0.15MnO3±δ (LSM) or
La0.6Sr0.4Co0.2Fe0.8O3−d(LSCF) perovskite that forms a good combination with YSZ or GDC (gadolinium-doped ceria). The Ni/YSZ fuel electrode displays excellent catalytic properties for fuel oxidation and good current collection, however, carbon deposition and poor redox cycling degrades performance. Furthermore, electrolysis of H2O and/or CO2 oxidises the Ni leading to NiO/YSZ which is a poor conductor and therefore not suitable for the important functionality of current collection, hence Ni/YSZ cannot be employed in our case. Current research concentrates on alternative redox stable perovskites.
One candidate material is La0.75Sr0.25Cr0.5Mn0.5O3 since it has comparable
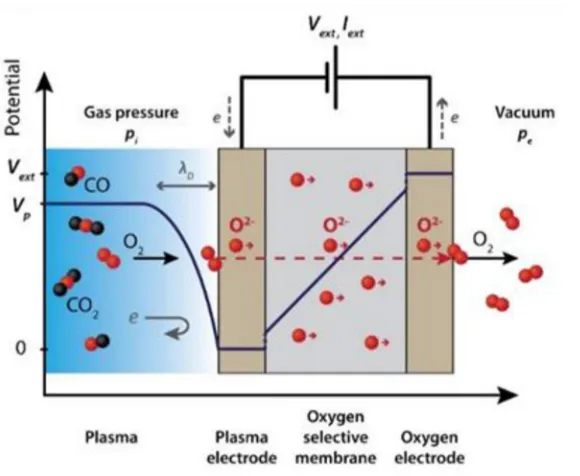
Fig. 6. – Voltage distribution of the plasma across the plasma sheath and across the solid oxygen membrane. An externally applied electric field across the membrane transports the negative oxide ions to the oxygen electrode. Plasma-activated CO2, CO, O2molecules, radicals, atoms and plasma electrons incident on the plasma electrode and subjected to the plasma sheath electric field influence the electro-chemistry at the plasma perovskite interface, synergistically boosting CO formation and oxygen transport.
will be the starting point for the development of an efficient plasma electrode which will be inactive for CO oxidation and will exhibit oxygen separation fluxes upon mild polar-ization. On the oxygen side, state of the art material LSCF or LSM in combination with YSZ or GDC will be used, while YSZ will be the electrolyte.
8.2. Plasma electrochemical interaction. – Novel is the presence of plasma adjacent to the SOC cathode, see fig. 6. The plasma leads to activated species including vibra-tional and electronically excited molecules and atoms, radicals, ions and electrons. This will activate the chemistry at the plasma electrode interface. In addition, the positively charged plasma and the polarisation of the SOC will enhance reactivity. Preliminary hybrid plasma-SOC experiments conducted at the Tokyo Institute for Technology indi-cate that synergism occurs between a SOC membrane and a plasma-activated CO2 gas, lowering the SOC operating temperature to 600◦C and improving conversion ratio as compared with pure electrolysis [28, 29].
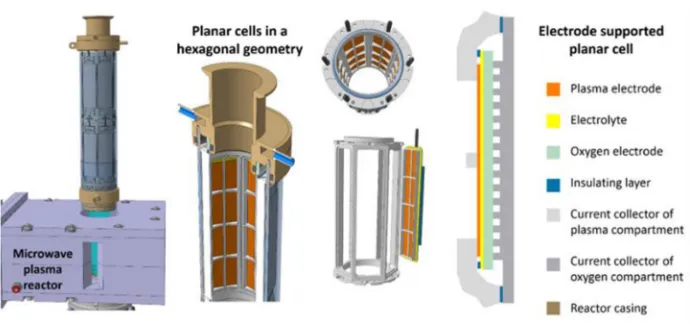
Fig. 7. – Schematic of the oxygen separator module based on planar membranes arranged at the plasma exit in hexagonal geometry. The oxygen outlet is indicated in blue. Detail on the right hand side shows the membrane assembled into a cell. Indicated are the perovskite plasma electrode (red), electrolyte (yellow) and the oxygen electrode (green). This membrane sandwich is mechanically supported by the castellated metal surface also serving as oxygen gas transport conduit. The SOC Cell is equipped with current feed through connected to the plasma and oxygen electrodes, respectively.
on capped tubular membranes which offer intimate plasma to SOC coupling [30, 9]. Re-quirements include gas tight separation of oxygen to plasma compartment and Galvanic isolation of the electrodes. Tubes are thermo-mechanically more stable and benefit from proven metal jointing technology. If failed, they can be individually replaced. The main issue is the fabrication of tubular membranes and their current collection. Here, the planar membrane concept offers advantage. The deposition of thin layers is simpler than for tubular membranes. Commercial Fuel Cell technology is predominantly based on the fabrication of planar membrane cells and their integration into stacks, offering a well proven technology. A conceptual design is shown in fig. 7.
At the typical plasma conditions discussed, 1.25 slm O2needs to be transported out of the plasma per kW power input, corresponding to 0.93×10⁻³mole/sec. The membrane surface area required is 358 cm2 at a typical SOC current density of 1 A/cm2, taking account a 4 times Faraday constant to account for 2O2−ion transport. This figure forms the basis of membrane surface area specification of the O2 separator.
Simula-Fig. 8. – Alternative scheme to oxygen separation: replace by proton feed. This option does away with the water gas shift and CO purification units, however, adds a water electrolyser unit.
tion Package (VASP) [32]. Computation is directed at newly doped quinary perovskite electrodes, that are expected to perform better than the existing electrode materials such as La0.75Sr0.25Cr0.5Mn0.5O3 (LSCM) [33, 34].
8.4.Alternative to oxygen separation. – A proton conducting cell [30] is employed as an alternative to oxygen separation, see fig. 8. In this approach water electrolysis occurs at the oxygen electrode and is followed by injection of protons into the plasma electrode. This is expected to lead to selective water formation at the plasma electrode interface through oxygen reduction. The intermediate operation temperature of proton conduct-ing SOC (500–600◦C) is expected to reduce the kinetics of the undesired back reaction of CO oxidation to CO2 at the plasma electrode. If CO oxidation kinetics dictate a fur-ther lowering of the operation temperature, the scenario of employing commercial PEM electrolysers becomes an option. These electrochemical cells operate in the temperature range of 20–200◦C, however, at the expense of costly and less-sustainable noble metals needed for the electrode materials.
9. – Basic parameters
and mean free paths for the CO2 gas and for the plasma constituents. For the plasma, the electric shielding distance (Debye length), plasma frequency and electro-magnetic wave dispersion add to pertinent time and length scales. Some simplified considerations will provide an order of magnitude ordering of the relevant processes.
9.1.The CO2 molecule. – Carbon dioxide is a linear molecule exhibiting 4 vibration and 2 rotation oscillation modes: the symmetric stretch mode (ν,0,0), the asymmet-ric stretch mode (0,0, ν) and two bend modes (0, ν,0) in two perpendicular directions, hence 9 degrees of freedom in total including translational motion. The radius of a CO2 molecule is a0 = 0.116 nm (the equilibrium C-O distance). The electron dissociation energy of CO2 isD= 5.451 eV, the cross-section reaches a max 10−16cm2 above 30 eV. Similarly, the cross-section for dissociative ionisation and formation CO+starts at 25 eV reaching a max 0.39×10⁻¹⁶cm2 at ∼90 eV electron energy. The ionisation energy of CO2 is 13.777 eV, reaching a maximum at an electron energy∼100 eV [17].
9.2.Spectrum ofCO2. – The absorption/emission spectrum of CO2vibration-rotation modes is situated in the IR, see the HITRAN database [35]. The fundamental of the asymmetric mode is found at λ = 4.24–4.28μm (750 THz, τ = 14 fs, hν = 0.29 eV) with an absorption cross-section of 1.4×10⁻¹⁷cm2/molecule. Overtones are found at λ = 2.68–2.78μm and λ = 2.0–2.02μm. The fundamental of the bend mode is at λ= 14.9–15μm with cross-section 5×10⁻¹⁸cm2/molecule. The symmetric mode has no IR transition (no dipole).
Electronic excitations in the eV range produce optical emission of the molecules in-volved [36]. The CO2 term scheme, representing the electronic energy levels, is given by [37]. As it turns out, there is no emission of CO2 in the UV visible. Only in the far UV 140–160 nm some weak absorption bands exist. Emission of CO+2 exist for the transitionsA2Π
u> X2Πg at 393.3–438.4 nm andB2Σ+u > X2Πgat 218.9–226.8 nm [36]. These emissions have not been observed in our experiments.
9.3.Emission spectra of CO,C2,O,O2 reaction products. – These spectra, by con-trast, exhibit emission spectra in the UV-visible. The CO molecule energy diagram is given in [38]. In our experiments, the UV 4th positive singlet system A1Π > X1Σ+ (200–250 nm) and 3rd positive and 5B triplet system b3X+ > a3Π (260–390 nm) have been identified. In the visible, the ˚Angstr¨om singletB1Σ+> A1Π and the Triplet system d3Π > a3Π (400–650 nm) are also observed. A shift from 3rd and 4th positives to the ˚
Angstr¨om and Triplet system is observed at high gas pressure. The plasma turns from pale blue (Type I) to intense white (Type II).
The C2 Swan band has been observed in the same spectral interval (430–620 nm) as the CO ˚Angstr¨om and Triplet bands, showing further decomposition of CO2 to carbon taking place.
the OES spectrometer, hence not observed in our experiments. Unfortunately, also the 680 nm oxygen line is not observed.
Atomic oxygen lines3D0 and5D0>5P around 615 nm are observed in the measured spectrum. These small peaks are only measurable in the high-reducedE-field condition. At low reduced E-field the Swan band outshines them. Atomic oxygen spectral lines could elucidate their vibrational origin, deriving either from the O(1D) state or the lower energy O(3P) dissociation branch of CO
2. The O(1D) 2p4 transition to ground state O(3P) has an emission at 636 nm, whilst O(3P)3s to O(3S) has an emission at 844.7 nm [39]. Unfortunately, these lines could not be identified from our measurements. In conclusion, the CO molecule produced in the CO2 dissociation process is in the X1Σ+singlet ground state. Hence, no electronic emission representing this state is avail-able. Atomic oxygen produced is either in the ground state O(3P) or in the excited state O(1D). A transition from the excited singletDlevel to the ground state would reveal its origin. The line corresponding to1D→3P at 630 nm has not been observed. Similarly, transitions 5S0 and3S0 to the 3P ground level at wavelength 130 and 135 nm, respec-tively, would produce tell-tale signs, but are not within spectral range of the spectrometer and anyway are blocked by absorption in air. Hence, all CO and O lines observed result from direct excitation by plasma electrons and not from vibrational excited CO2 energy levels.
9.4. The microwave field. – The electro-magnetic field in the cylindrical cavity is in the TM010 mode, hence the electric field maximises on-axis to which it is aligned. A typical electric field strength on axis of the RF cavity calculated by COMSOL is E = 27 kV/m @ 915 MHz and PRF = 3 kW [19]. The distance travelled by an elec-tron accelerated in vacuum by this E-field during the half cycle τ = 0.546 ns, is s = 1/2(eE/m)t2 ∼ 720μm. By contrast, CO+
2 ions move only 9 nm, remaining es-sentially stationary during RF-field oscillation. The speed acquired by electrons in this half cycle (v=at) becomesv= 2.6×10⁶m/s, equivalent to an energy of∼20 eV.
The de Broglie wavelengthλ=h/pof a 20 eV electron is 0.28 nm, hence of the size of the CO2 diameter (0.232 nm). Above this energy, the electrons start seeing individual atoms, rendering them ineffective for excitation of molecular vibration.
9.5. Electron-CO2 gas collisions. – The cross-sections of vibrational excitation of a CO2molecule by electrons at around 1 eV electron energy is of order∼10−16cm2for all modes, dominated by the asymmetric stretch mode. The cross-section for the asymmetric mode peaks at 0.4 eV and drops characteristically asσ≈1/vwith increasing energy [17]. This implies a constant collision frequency for the asymmetric stretch mode over the range from 0.5 to over 30 eV electron energy.
Considering the total collision cross-section for electrons in CO2,σtot∼10−15cm2, the mean free pathλtot= 1/nσtotat low pressure Type I discharge (1 mbar) isλtot∼370μm,
TableIII. –Characteristic time scales and lengths of the electron neutralCO2 gas interaction.
P mbar τexcfs τvibfs τtotps τevps τnn ns λnn μm λevμm λtotμm s μm
1 0.39 14@ 62 12E3 130 50 74E3 370 720@
100 λ= 4.2μm 6 62 1.3 0.5 37 3.7 E= 27 kV/m
At high-pressure Type II discharges (> 100 mbar), the situation is very different since λtot ≈ 4μm and therefore λtot s, i.e. the electron is never able to pick up speed between collisions. At less than 1/100 of the RF cycle, the electron is knocked off-course by collision with a CO2 molecule. A constant drift velocity establishes with vD ≈ Eλ ≈ E/n, where the proportionality factor is the electron mobility defined as μ=e/(mν).
The interaction time of an electron with a CO2 molecule τexc= 2a0/ve = 0.39 fs for a 1 eV electron (ve= 5.93×10⁵m/s), is much faster than the vibration timeτvib= 14 fs (σ = π/4a2
0 ≈ 10−16cm2). Hence, the molecule can be regarded as frozen during the inelastic electron collision; the Frank-Condon principle applies. The electron acts as a clapper ringing the CO2 molecular bell.
The electron neutral collision time follows from the total cross-section averaged over the electron velocity distributionτetot= 1/nσtotveyieldingτtot= 6 ps atp= 100 mbar and 1 eV electron energy. Similarly, for the excitation of the asymmetric vibration mode the electron collision time becomesτev= 60 ps atp= 100 mbar, both much smaller than the RF oscillation time.
The mean free path for inter-molecular CO2-CO2 collision at 300 K isλnn[m] = 4.5× 10⁻⁵/p[mbar]. At a pressure of 1 mbar (Type I discharge) this yields a mean free path λnn = 50μm. At a pressure of 100 mbar λnn = 0.5μm. This path length results in a collision time withTgas= 300 K (vth= 378 m/s) ofτnn=λnn/vth= 130 ns at 1 mbar and τnn = 1.3 ns at 100 mbar. These times become a factor 3 shorter at Tgas= 3000 K and another factor 5 at a pressure of 500 mbar, more typical for the Type II discharge. Hence, typical n-ncollision times of Type II discharges are τnn <0.1 ns, i.e.shorter than the oscillation period. The interaction time of two CO2molecules isτint= 4a0/vth= 1.2 ps,
i.e.slow compared with the vibration oscillation time. Interacting molecules are locked together for some 100 vibrations.
Results on characteristic times and mean free path calculations are summarised in table III, leading to the following ordering in time and length scales pertaining to the CO2 plasma discharge:
τexcτvibτintτetotτevτnnτosc.
Once the CO2 molecule is vibrational excited in the ground state 1Σ+ by high rate electron impact, it needs to climb the vibration energy ladder in order to overcome the dissociation threshold energy of 5.5 eV. The necessary energy derives from the kinetic en-ergy of intermolecular CO2-CO2collision. Energy is transferred in high-energy vibration modes at points where the nuclear coordinates of the different molecular energy levels match according to the Frank-Condon principle. This VV exchange process populates the higher1B
2 vibration energy levels of the CO2 molecule. It is the limiting factor in the rate of dissociation [15]. Thus, CO2molecular bells, gently but repeatedly twanged by electrons, chime in unison until occasionally crashing into each other, transferring sufficient energy to ring overtones. Overtones of sufficiently high energy break the bell.
9.6. Plasma parameters. – The degree of ionisation is a critical parameter in the dissociation of CO2 for being the source of electrons that are instrumental in vibrational excitation and subsequent dissociation. The relaxation efficiencyηVT is defined as the fraction of vibration energy going into dissociation over the fraction going into translation energy [15]. Thus, relaxation efficiency ηVT must be high for effective dissociation. It increases with the degree of ionisation in the discharge at fixed energy input. At an input energy ofEv= 0.5 eV per molecule CO2 and an ionisation degreene/n0= 10−6.5 the relaxation efficiencyηVT = 40%. This increases toηVT = 80% for ten times higher ionisation degreene/n0= 10−5.5. At a neutral densityn0= 5.38×1018cm−3(pressure of 200 mbar) and an electron densityne= 1.7×1013cm−3, a relaxation efficiencyηVT= 80% is reached. In RF discharges, the energy efficiency peaks atEv= 0.8–1 eV [15]. Optimum energy efficiency for CO2dissociation is reached atEv= 0.5 eV and an ionisation degree ne/n0∼10−5.
Since the degree of ionisation is important for efficient dissociation of CO2, plasma parameters add to characteristic time and length scales relevant to the activation system. These parameters include Coulomb collisions, Debye length and plasma frequency.
Coulomb collision times vary as (m1/2T3/2)/n. Hence, at low electron temperature and high plasma density these times become remarkably short, nearing neutral collision times. Times for electrons relate to times for ions asτe= (me/mi)1/2τi. Hence, electron-electron collision times are a factor 3.5×10⁻³shorter than CO2ion-ion collision times. On the other hand, collision times between electrons and ions are approximately equal to the electron-electron collision times: τei = 2
√
2τee. Thus, the following ordering in Coulomb times results: τee≈τeiτii, showing that electrons relax by mutual collision much faster than ions. As shown before, Coulomb collisions do not play a role in plasma thermalisation, the plasma is electron-neutral collision dominated.
Coulomb collision times are calculated from the Spitzer formula, including a weak dependence on the Coulomb logarithm ln Λ, varying from 7 to 15 in the parameter range considered. The Coulomb logarithm represents the screening of a test particle by the plasma at distances greater than the Debye length, yielding small angle scattering as the dominant collision mechanism,
τei= 3(2π)3/2
TableIV. –Electron-ion Coulomb collision timesτei vs. electron temperature and ion density.
ni Te= 0.1 eV Te= 1 eV Te= 10 eV Te= 100 eV
1018m−3 τei= 1.3 ns τei= 32 ns τei= 840 ns τei= 23μs 1019m−3 τei= 0.15 ns τei= 3.6 ns τei= 92 ns τei= 2.5μs
Results of the Coulomb collision timeτei and τii calculation are shown in table IV and table V, respectively.
Hence, electron-ion Coulomb collision times are longer than electron neutral collision times, even for a cold, dense plasma. Also, the Coulomb collision times are longer than the RF oscillation time. Only collisions with neutrals play a role, the plasma is neutral collision-dominated, but essentially collision-free for electron and ion collisions mutually. The Coulomb collision mean-free path follows from λ = vthτ with 1/2mv2th =kT. For the same temperatureλee=λii. Results are shown table VI.
For lowTe and high density the mean free path becomes of order plasma dimension. Otherwise, no Coulomb collision takes place inside the plasma volume.
The Debye lengthis given byλD= √
(ε0kT)/(ne2). Results are tabulated in table VII. For most conditions the Debye screening length is<10μm,i.e.small compared with the plasma dimension. For a collisional plasma the skin depth becomes the relevant parameter, depending on the plasma resistivity.
The number of particles in a Debye sphere is given byND= 4/3πλ3Dne. Results are tabulated in table VIII. Hence, at low Te there are very few particles contained in a Debye sphere in this type of plasma.
Plasma frequency is defined asω2
pe=nee2/ε0me. Results are tabulated in table IX. The RF frequency (915 MHz) is lower than the plasma frequency. Hence, the wave cannot propagate. The wave can propagate when collisions are included. The plasma permittivityε(ω) = 1−ω2pe/ω2{1−iν/ω}contains the factoriν/ω, whereνis the electron neutral collision frequency. Since this ratio is generally larger than 1, the electric field in the RF cavity is displaced by the plasma.
9.7. Plasma chemistry. – The reaction proceeds in two steps, starting with CO2 in the1+ground state, excited by electron impact to low-level vibrational energy [15]:
CO2∗(1Σ+)→CO2∗(1B2)→CO2∗(3B2)→CO(1Σ+) + O(3P), (1)
ΔH = 5.451 eV net enthalpy.
TableV. –Ion-ion Coulomb momentum transfer-timeτii.
ni Ti= 0.1 eV Ti= 1 eV
1018m−3 τii= 287 ns τii= 9.1μs
TableVI. –Mean free pathλee/ii Coulomb interaction.
ni Te= 0.1 eV Te= 1 eV Te= 10 eV
1018m−3 λee/ii= 238μm λee/ii= 13.8 mm λee/ii= 1.5 m 1019m−3 λee/ii= 27.5μm λee/ii= 2.1 mm λee/ii= 0.17 m
The higher CO2 vibrational energy level 1B2 is reached by molecular V-V relaxation. Activation energy is lowered by a non-adiabatic singlet1B
2to triplet3B2spin transition. This happens at the point where energy level and molecular distance of the O=CO bond coincide. It allows molecular break-up at minimum 5.5 eV energy, leaving CO and O formed in the ground electronic state.
The atomic oxygen radical produced follows up by a second reaction with abundantly available CO2 producing one more CO molecule at 0.3 eV net energy, additional energy being freed by recombination of atomic oxygen into molecular oxygen at 5.2 eV:
(2) O + CO2→CO + O2, ΔH = 0.3 eV net enthalpy.
The three-body recombination reaction of atomic oxygen to O2 has a much lower rate coefficient as compared with the reaction with CO2. The two reactions in succession yield a net enthalpy for the production of one CO molecule H = 5.8/2 = 2.9 eV, the limiting stage being reaction (1).
10. – Reduced electric field
Electrons gain energy by the applied electric field and are scattered by CO2molecules that can be considered stationary (Lorentzian gas). A steady-state electron drift sets up with velocityvD proportional to the applied electric field with proportionality constant μe, the electron mobility. The velocity acquired between collisions isvD= (eE/me)τen, whereτen= (n0σenvD)−1is the collision time. Combination yields the energyUe gained by electrons between collisions
(3) Ue= 1/2mevD2= 1/2eE/(n0σen) = 1/2eEλen,
TableVII. –Debye lengthλD.
ne Te= 0.1 eV Te= 1 eV Te= 10 eV
1018m−3 2.35μm 7.45μm 23.5μm
TableVIII. –Number of particlesND in a Debye sphere.
ND Te= 0.1 eV Te= 1 eV
1018m−3 54 1720
1019m−3 17 550
where λen is the electron neutral mean free path. This expression yields a relation between electron energy and the reduced electric field:
(4) Ue =e/(2σen){E/n0}.
This expression permits calculation of the reduced electric field for a given electron energy. For example, the cross-section for vibrational excitation of the CO2asymmetric stretch mode peaks at an electron energy of 0.4 eV where the cross-section is σen = 1.8 ×10⁻¹⁶cm2 [16]. Substitution yields E/n
0 = 1.4×10⁻¹⁶V cm2 for the reduced electric field value, where vibrational excitation by electrons is maximum. This value corresponds with Russian theory [15].
Through collisions the electrons randomise and, albeit non-Maxwellian, could be as-signed a temperature. Since Ue = 3/2kTe the expression for the reduced electric field yields
(5) kTe=e/(3σen){E/n0}.
Hence, a linear relation exists between electron temperature and reduced electric field, which is useful in relating measured plasma parameters to the reduced electric field. The above expression differs from [15] by a numerical factor, which takes into account inelastic energy loss during electron randomisation.
11. – Energy efficiency forCO2 splitting
Energy efficiency is defined as η = H/ECO, where H = 2.9 eV is the minimum net enthalpy required for the production of one CO molecule from CO2 input gas flow and ECO is the actual energy expended per CO molecule produced. Measured is Ev, the energy input per incoming CO2 molecule, which is proportional to input power PRF over gas flow rate Q or Ev ≈ PRF/Q. The fraction of CO2 converted into CO is α= [CO]out/[CO2]in. Since the input energyEv is distributed over CO2/αmolecules to
TableIX. –Plasma frequency as a function of plasma density.
ne νpe= 8.967√ne
1018m−3 ∼9 GHz
produce one CO molecule, it holds thatEv=αEco. Since bothαandEv are amenable to measurement, the energy efficiencyη becomes expressed in measured quantities:
(6) η=CQ/PRF =αH/Ev.
Here, C is a constant of numerical factors, in this case C = 1.93×10² at 300 K. The conversion factor α is determined experimentally from mass analysis of the exit gas stream and supported by spectral line strength measurement. Measured values ofη vs.
Ev are plotted in figs. 11, 12 and 13 applying eq. (6).
12. – Plasma particle balance
Plasma is created by electron ionisation of the CO2gas and lost by ambipolar diffusion up to the sheath edge where the ions reach the Bohm velocity. The Bohm velocity is a result of the overriding need for plasma neutrality, which requires fluxes of ions and electrons out of the plasma to be equal. Equating production and loss, the steady-state particle balance is obtained. Since production by ionisation is a volume process and loss by diffusion a surface process, the gas densityn0 and the plasma radius R, are coupled parameters:
(7) 2vB=n0σionvR≈√(E/n)
herevB =√2kTe/mi is the Bohm velocity andσionvthe ionisation rate averaged over the electron velocity distribution, whilst use is made of eq. (5) to relate electron tem-perature to the reduced electric field. The ionisation rate increases proportionally with the reduced electric field. This expression shows the plasma discharge radius to contract with increasing gas pressure. This phenomenon has been observed experimentally in the transition of going from Type I discharge at low pressure (1 mbar), see fig. 9, to Type II discharge at high pressure (100 mbar), see fig. 5b).
Put differently, the loss of the plasma can be expressed in a plasma electron contain-ment timeτe as
(8) τe
√
(E/n)≈R.
Hence, increasing electron containment —which is good because ionisation is energetically expensive— lowers the reduced electric field for fixed plasma radius and thereby increases energy efficiency.
The energy balance yields an expression for the electron densityne
(9) PRF=neΣin0σivΔεiV,
Fig. 9. – Typical Type I discharge with nozzle placed at the entrance of the discharge, char-acterised by 1 mbar pressure. After expansion striations are visible indicating shock fronts, a tell-tale sign of supersonic flow.
yield basic gas discharge parameters. Typically, the plasma density is in the range 1018– 1019m−3, ionisation degree 10−6 to 10−5 and electron temperature in the range 1 to 10 eV.
13. – Vortex flow
Gas is injected tangentially at the entrance of the cylindrical reaction chamber through a small orifice where it accelerates and expands. A strong spiralling gas flow is established along the chamber wall, causing a radial pressure and temperature gradient to build up. This type of flow has been exploited in the Ranque-Hilsch cooling machine [40, 41]. In our case it provides stability of the plasma discharge.
In axial direction, flow is directed through a nozzle after which the gas expands and cools. When the exit pressure is low enough this flow reaches a maximum, called choked flow. Under this condition, in the throat of the nozzle, the gas velocity reaches the speed of soundcs or Mach M = 1. Beyond, the velocity increases and becomes supersonic at the exit of the reaction chamber leading to shock waves to form, see fig. 9. At these sonic gas speeds the vortex rotates at high frequency, 300000 r.p.m. is not unusual. The resulting centrifugal acceleration typically reaches 106g at the wall of the reactor vessel. Assuming M = 1 in the throat of the nozzle, i.e. chocked flow, the gas velocity equals the speed of sound. The gas flow velocity vF follows from nvFO = F, i.e.
Fig. 10. – The CO 3rd positive triplet band is shown to increase linearly with gas pressure, consistent with CO production rates.
14. – Experimental results
Three types of discharge have been investigated at constant input CO2 gas flow rate of 11.1 slm:
Type I gas expansion nozzle, 10 mm diameter is placed at the entrance of the cavity expanding the gas into the discharge. Typical gas pressure 1 mbar is characterised by highE/n∼100×10−16V cm2. Typical energy efficiencyη= 15% is found constant with power and particle conversionαincreases linearly with power. OES shows dominance of 3rd and 4th positive CO bands to increase linear with power.
Type II gas expansion nozzle is placed at the exit of the cavity freely expanding the converted gas stream. The high-pressure 200 mbar gas discharge is characterised by low E/n ∼ 10−16V cm2. The discharge diameter contracts with higher pressure in accord with eq. (7), see fig. 5b). Typical energy efficiencyη= 35% increases by reducing power. Particle conversion increases with power from 10% upward. The OES is dominated by the CO ˚Angstr¨om and CO Triplet system, see fig. 5d), whilst the Swan system reveals carbon.
Type III exit nozzle diameter has been increased in steps from 5 mm, to 10 mm, to 26 mm diameter. This type of discharge is characterised by an intermediate reduced electric field regimeE/n∼10×10−16V cm2. Intermediate energy efficiencies result.
Fig. 11. – Energy efficiency and particle conversion in terms of energyEv per incoming CO2 molecule obtained from variation of RF power. Data are constrained by stoichiometric fit, taking the O2 data as reference for not suffering from cracking products produced inside the QMS.
Fig. 13. – Energy efficiencyηfor CO production increases by lowering the energyEvper incoming CO2molecule.
Increasing the input microwave powerPRF at constant flow rateQshows an approx-imate linear increase in particle conversion ratio α = aPRF for all types of discharge, see fig. 5c). SinceEv/H∼PRF/Q, whereEv is the energy expended per incoming CO2 molecule expressed in units ofH, the minimum enthalpy, it follows thatα≈(Ev/H)Q. Since the energy efficiencyη=H/Eco=α(H/Ev)≈PRF(H/Ev) =Q, it follows that at constant flow rate the energy efficiency is constant with power. In reality there are devi-ations to linearity of conversion ratio, which explains that calculated energy efficiencies show a slight increase at low power.
The CO emission line strength is shown to increase linearly with RF power, confirming the QMS data, see fig. 10. Similarly, with gas pressure the line strength is seen to increase linearly.
14.1.Energy efficiency. – Plotting CO conversion data as a function of input power, fig. 5c) and similar for gas flow variation, in terms of specific energyEvper CO2molecule yields figs. 11 and 12. The typical energy efficiency 50% obtained reduces with increase of power, whilst the conversion to CO increases linearly with power.
14.2.Reduced electric field. – The electric field has been calculated by Comsol Mul-tiphysics simulation program [19]. The vacuum field strength on axis of the cavity is E[V/cm] = 4.965√PRF [W]. Since the microwave frequency is much lower than the cut-off plasma frequency, power is absorbed by e-n collisions in the plasma. At the plasma density considered the E-field skin depth still penetrates the plasma on axis, albeit at reduced strength. These aspects have been ignored in theE estimate.
Results are collated in figs. 13 and 14. The trend suggests that higher efficiencies may be obtained at lower E/n values. Here, conflicting requirements on sustaining the gas discharge requiring Te > 1 eV and low E/n values requiring Te < 1 eV need to be accommodated, suggesting decoupling of requirements necessary. This may be achieved by a double humped electron energy distribution function (EEDF). Energy efficiency goes up with decreasing energyEv per incoming CO2molecule, whilst particle conversion goes down. This result is consistent with eq. (6) and is tantamount to saying that the available energy per input CO2 molecule needs to be concentrated in one out of many CO2molecules in order to accumulate sufficient energy to attain the net 2.9 eV dissociation energy.
REFERENCES
[1] United Nations Framework Convention Climate Change, http://unfccc.int/paris agreement/items/9485.php.
[2] RED 2009/28/EC, https://ec.europa.eu/energy/en/consultations/preparation-new-renewable-energy-directive-period-after-2020.
[3] Mohr A.andRaman S.,Energy Policy,63(2013) 114;Searle S. Y.andMalins C. J.
Proc. 20th Eur. Bio. Conf. &.Exh., Milan, Vol.53, (2012).
[4] A European Strategy for Low-Emission Mobility SWD(2016) 244 final, Brussels, 20.7.2016 COM(2016) 501 final.
[5] UN International Civil Aviation Organisation, http://www.icao.int/Meetings/a39/ Documents/Resolutions/a39 res prov en.pdf.
[6] BMU Leitstudie 2012 by DLR, IWES, IFNE.
[7] Grond L. J.et al., DNV-KEMA report GCS 13.R.23579 (2013),www.energeia.nl/docs/ P2G ECN 2014.pdf.
[9] KEROGREEN, EU H2020 funded project 763909 “Production of Sustainable aircraft grade Kerosene from Water and Air powered by Renewable Electricity through the splitting of CO2, formation of Syngas and Fischer-Tropsch synthesis” by DIFFER, KIT, VITO, HyGear, CerPoTech and INERATEC, seehttps://www.differ.nl/network/kerogreen. [10] Carmo M., Fritz D. L., Mergel J. and Stolten D., Int. J. Hydrogen Energy, 38
(2013) 4901.
[11] Jensen S. H., Sun X., Ebbesen S. D., Knibbe R.andMogensen M.,Int. J. Hydrogen Energy,35(2010) 9544.
[12] Zheng Y., Wang J., Yu B., Zhang W., Chen J., Qiao J. andZhang J.,Chem. Soc. Rev.,46(2017) 1427.
[13] Irvine J. T., Neagu D., Verbaeken M.C., Chatzichristodoulou C., Graves C.and Mogensen M. B.,Nature Energy,1(2016) 15014.
[14] Legasov V. A.et al.,Dokl. Akad. Nauk.,238(1978) 66,Sovj. Phys. Dokl.,23(1978) 66.
[15] Rusanov V. D., Fridman A. A. and Sholin G. V., Sov. Phys. Usp., 24 (1981) 447, Usp. Fiz. Nauk.,134(1981) 185.
[16] Itikawa Y.,J. Phys. Chem. Ref. Data,31(2002) 749.
[17] Azizov R. I., Vakar A. K., Zhivotov V. K., Krotov M. F., Zinov’ev O. A.,
Potapkin B. V., Rusanov A. A., Rusanov V. D. and Fridman A. A., Sov. Phys.
Dokl.,28(1983) 567.
[18] Leins M.et al., 31th Int. Conf. Phen. in Ionized Gases, Granada (2013).
[19] Leins M., Thesis, Ch 2.3.2 (2010), Universit¨at Stuttgart.
[20] Goede A. P. H.andvan de Sanden M. C. M.,Europhys. News,47, issue No. 3 (2016)
22,http://dx.doi.org/10.1051/epn/2016304.
[21] Goede A. P. H.et al.,EPJ Web of Conferences,79(2014) 01005, DOI:10.1051/epjconf/
20147901005.
[22] Goede A. P. H.,Joint EPS-SIF International School on Energy, edited byCifarelli L.
andWagner F.(SIF, Bologna) 2015, pp. 357-380, ISBN 978-88-7438-094-7.
[23] Nighan W. L.,Phys. Rev. A,2(1970) 1989.
[24] Diomede Paola, DIFFER communication.
[25] Tsampas M. N. et al., Cat. Sci. Techn., 5 (2015) 4884, http://dx.doi.org/10.1039/
C5CY00739A.
[26] Sapountzi F. M.et al.,Solid State Ionics,277(2015) 65,http://dx.doi.org/10.1016/
j.ssi.2015.05.003.
[27] Vernoux P. et al., Chem. Rev., 113 (2013) 8192, http://dx.doi.org/10.1021/
cr4000336.
[28] Tagawa Y.et al.,Kagaku Kogak Ronbunshu,37(2011) 114.
[29] Tun L. L., Matsuura N.andMori S.,22nd Int. Symp. Plasma Chemistry(2015) p.
O-15-3.
[30] Tsampas Mihalis, DIFFER Internal Communication.
[31] Suleyman E. r., DIFFER Internal Communication.
[32] Kresse G. and Furthmuller J., Phys. Rev. B, 54 (1996) 11169,
DOI:10.1103/PhysRevB.54.11169.
[33] Tao S. andIrvine J. T. S.,Nat. Mater.,2(2003) 320, DOI:10.1038/nmat871.
[34] Yue X., Arenillas A. and Irvine J. T. S., Faraday Discuss, 190 (2016) 269,
DOI:10.1039/C6FD00001K.
[35] HITRAN (2004) Harvard Smithsonian, Cambridge,http://vpl.astro.washington.edu/. [36] Pearse R. W. B.andGaydon A. G.,The Identification of Molecular Spectra, 4th edition
(Chapman and Hall) 1976, pp. 109–112.
[38] Herzberg G., Molecular Spectra and Molecular Structure, Vol. 1 Spectra of Diatomic Molecules, 2nd edition, p. 452.
[39] Herzberg G.,Atomic Spectra and Atomic Structure (Dover books) 2010, p. 163.
[40] Liew R., Zeegers J. C. H., Kuerten J. G. M. andMichalek W. R.,Phys. Rev. L,
109(2012) 054503.
[41] Liew R., Zeegers J. C. H., Kuerten J. G. M.andMichalek W. R.,Exp Fluids,54
![Fig. 3. – a) Gas demand [GWh/day], mainly heat, shows seasonal variation of factor 4. b) Elec-tricity demand [GWh/day] almost flat at ±10% throughout the year](https://thumb-us.123doks.com/thumbv2/123dok_us/8033497.1336985/6.482.48.441.61.178/demand-mainly-seasonal-variation-factor-elec-tricity-demand.webp)