Use of ID3 Decision Tree Algorithm for Placement
Prediction
Hitarthi Bhatt#1, Shraddha Mehta#2, Lynette R. D'mello#3 #
Dept. of Computer Engineering, D.J. Sanghvi College of Engineering, Mumbai University
Mumbai, India
m Abstract— Every year corporate companies come to colleges in order to recruit students. Recruitment is one of the most essential processes for any organization as they look for skilled and qualified professionals to fill up the positions in their organization. Many companies hire students through campus recruitment process. Campus recruitment is an efficient way to get the right resources at the right time with minimal cost and within minimum time frame. While the industry hires candidates from different institutes, students too get a chance to start their career with some of the best companies in the corporate sector. The main aim of this paper is to identify relevant attributes based on quantitative and qualitative aspects of a student's profile such as CGPA, academic performance, technical and communication skills and design a model which can predict the placement of a student. For this purpose ID3 classification technique based on decision tree has been used. The result of this analysis will assist the academic planners to design a strategy to improve the performance of students that will help them in getting placed at the earliest.
Keywords—Weka; Placement Prediction; ID3 Algorithm; Decision Tree; Data Mining
I. INTRODUCTION
Campus placement is a process where companies come to colleges and hire students before they complete their graduation. This paper proposes a system which determines the probability of a student getting placed based on different attributes like programming skills, CGPA, communication skills, internships, backlogs, SSC and HSC marks. For this purpose ID3 classification algorithm is used.
ID3 algorithm is primarily used for decision making. ID3 (Iterative Dichotomiser 3) algorithm invented by Ross Quinlan is used to generate a decision tree from a dataset[5]. ID3 classification algorithm makes use of a fixed set of examples to form a decision tree. In order to depict the dependency of various attributes the resulting tree is used. To decide which attribute goes into the decision node ID3 uses information gain. ID3 searches through the attributes of the training instances and extracts the attribute that best separates the given examples.[17] ID3 operates recursively
on 'n' partitioned subsets in order to get the "best" attribute until it classifies the training sets after which ID3 stops; here n is the number of possible values of an attribute. The algorithm makes use of greedy search, that is, it picks the best attribute and never looks back to reconsider earlier choices.
II. LITERATURE SURVEY
A. ID3 Algorithm
In decision tree learning, ID3 (Iterative Dichotomiser 3) is an algorithm invented by Ross Quinlan used to generate a decision tree from the dataset.[3] To model the
classification process, a tree is constructed using the decision tree technique. Once a tree is built, it is applied to each tuple in the database and this results in classification for that tuple.
The following issues are faced by most decision tree algorithms[4]:
• To choose splitting attributes • Order of splitting attributes • Number of splits to be taken
• Balance of tree structure and pruning • The stopping criteria
The decision tree algorithm is based on Entropy, its main idea is to map all examples to different categories based upon different values of the condition attribute set; its core is to determine the best classification attribute from condition attribute sets. The algorithm chooses information gain as attribute selection criteria; usually the attribute that has the highest information gain is selected as the splitting attribute of the current node. Branches can be established based on different values of the attributes and the process above is recursively called on each branch to create other nodes and branches until all the samples in a branch belong to the same category. To select the splitting attributes, the concepts of Entropy and Information Gain and Gain Ratio are used.
The use of entropy and information gain is discussed in the subsequent section.
Entropy
It is a measure in the information theory, which characterizes the impurity of an arbitrary collection of examples. If the target attribute takes on 'c' different values, then the entropy S relative to this c-wise classification is defined as
Entropy(s) =∑- Pi log2Pi
training data has 14 instances with 5 positive and 9 negative instances, the entropy is calculated as
Entropy ([5+,9-])
= -(5/14)log(5/14)- (9/14)log(9/14)=0.9402
A key point to note here is that the more uniform the probability distribution, the greater is its entropy. If the entropy of the training set is close to one, it has more distributed data and hence, considered as a good training set.
Information Gain
The decision tree is built in a top-down fashion. ID3 chooses the splitting attribute with the highest gain in information, where gain is defined as difference between how much information is needed after the split. This is calculated by determining the differences between the entropies of the original dataset and the weighted sum of the entropies from each of the subdivided datasets. The motive is to find the feature that best splits the target class into the purest possible children nodes - pure nodes with only one class
This measure of purity is called information. It represents the expected amount of information that would be needed to specify how a new instance of an attribute should be classified. The formula used for this purpose is:
G(D, S) = H(D) - ∑P(Di)H(Di)
The attribute with highest value of information gain is used as the splitting node thereby constructing the tree in top down fashion.
B. CART
CART stands for Classification and Regression Trees (Breiman et al., 1984). It is characterized by the fact that it constructs binary trees, namely each internal node has exactly two outgoing edges. The splits are selected using the towing criteria and the obtained tree is pruned by cost– complexity Pruning. When provided, CART can consider misclassification costs in the tree induction. It also enables users to provide prior probability distribution.
C. C4.5
C4.5 is a well-known algorithm used to generate decision trees. The decision trees generated by the C4.5 algorithm can be used for classification, and for this reason, C4.5 is also referred to as a statistical classifier.
At each node of the tree, C4.5 chooses one attribute of the data that most effectively splits data set of samples S into subsets that can be in one class or the other[12]. It is the
normalized information gain (difference in entropy) that results from choosing an attribute for splitting the data. The attribute factor with the highest normalized information gain is considered to make the decision. The C4.5 algorithm then continues on the smaller sub-lists having next highest normalized information gain.
D. CHAID
CHAID is a type of decision tree technique, based upon adjusted significance testing (Bonferroni testing). CHAID can be used for prediction as well as classification, and for detection of interaction between variables. In practice, CHAID is often used in the context of direct marketing to select groups of consumers and predict how their responses to some variables affect other variables, although other early applications were in the field of medical and psychiatric research.
Reasons to choose ID3
1. Understandable prediction rules are created from the training data.
2. Builds the fastest tree. 3. Builds a short tree.
4. Only need to test enough attributes until all data is classified.
5. Finding leaf nodes enables test data to be pruned, reducing number of tests.
6. Whole dataset is searched to create tree. 7. Whole hypothesis space is searched.
Weka
Weka (Waikato Environment for Knowledge Analysis) is a free software available under the GNU General Public License that implements a large collection of machine learning algorithms and is widely used in data mining applications[14]. Weka supports several standard data
mining tasks, more specifically, data pre-processing, clustering, classification, regression, visualization, and feature selection. All of Weka's techniques are predicated on the assumption that the data is available as a single flat file or relation, where each data point is described by a fixed number of attributes.
III. PROPOSED SYSTEM
Campus placement is a process where companies come to colleges and identify students who are talented and qualified, before they finish their graduation. The proposed system determines the likelihood of placement based on various attributes of a student’s profile. Depending on the parameters , manual classification is done whether the student is placed or not placed. A decision tree is then implemented to determine the probable outcome of a student being placed.
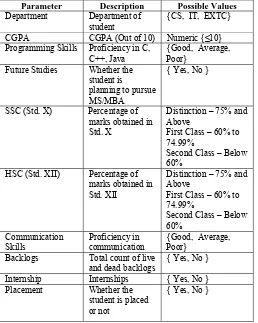
The following set of student data is considered as the base set for the proposed system. The data set comprises of different quantitative and qualitative measures of 14 students. The attributes such as department of the student, CGPA (Cumulative Grade Performance Average), programming skills, future studies such as planning for a master’s degree, SSC percentage, HSC percentage, communication skills, number of backlogs which is the total count of backlogs both active and dead and the total number of relevant internships have been taken into consideration.
Fig. 1 Student data
The combination of various attributes determines whether the student is placed or not. The quantitative aspects like undergraduate CGPA, Marks obtained in X and XII form the major aspect of a student’s academic endeavours. The qualitative aspects like communication and programming skills form a backbone for a student to get placed as each recruiting company desires to hire students that have a sound technical knowledge and ability to communicate effectively. The other factors like internships, backlogs, future studies add value only when the prior requirements are met. The attributes and the possible values are explained below:
TABLE I
Attributes and their values
Parameter Description Possible Values
Department Department of
student {CS, IT, EXTC}
CGPA CGPA (Out of 10) Numeric {≤10}
Programming Skills Proficiency in C,
C++, Java {Good, Average, Poor}
Future Studies Whether the
student is planning to pursue MS/MBA
{ Yes, No }
SSC (Std. X) Percentage of
marks obtained in Std. X
Distinction – 75% and Above
First Class – 60% to 74.99%
Second Class – Below 60%
HSC (Std. XII) Percentage of
marks obtained in Std. XII
Distinction – 75% and Above
First Class – 60% to 74.99%
Second Class – Below 60%
Communication Skills
Proficiency in communication
{Good, Average, Poor}
Backlogs Total count of live
and dead backlogs
{ Yes, No }
Internship Internships { Yes, No }
Placement Whether the
student is placed or not
{ Yes, No }
With these attributes, a decision tree using Weka tool is obtained. The J48 classification algorithm which is an extension of ID3 algorithm is used to generate the decision tree.
Fig. 2 Weka Explorer Window
The algorithm gives a pruned decision tree with leaves as the decision that is placed or not placed. The primary node consists of programming skills which can accommodate three possible values viz. Good, Average and Poor. If the programming skills are Poor, the student is not placed. Furthermore, if the programming skills are good, the student may be placed based on the academic credential which is CGPA. If the CGPA of the student is above 7, student will be placed otherwise the student will not be placed. Also, if the student has average programming skills, he may still be placed based on other attributes like internships, future studies, communication skills, etc.
The final decision tree with four leaf nodes is obtained as shown below. The leaf nodes hold the value whether the student is placed or not placed.
Fig. 3 Weka Classifier Tree Visualizer
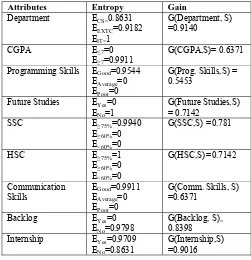
TABLE III
Entropy and Information Gain values for different attributes
Attributes Entropy Gain
Department ECS=0.8631
EEXTC=0.9182
EIT=1
G(Department, S) =0.9140
CGPA E≤7=0
E≥7=0.9911
G(CGPA,S)= 0.6371
Programming Skills EGood=0.9544
EAverage=0
EPoor=0
G(Prog. Skills,S) = 0.5453
Future Studies EYes=0
ENo=1
G(Future Studies,S) = 0.7142
SSC E≥75%=0.9940
E≥60%=0
E<60%=0
G(SSC,S) =0.781
HSC E≥75%=1
E≥60%=0
E<60%=0
G(HSC,S)=0.7142
Communication Skills
EGood=0.9911
EAverage=0
EPoor=0
G(Comm. Skills, S) =0.6371
Backlog EYes=0
ENo=0.9798
G(Backlog, S)=
0.8398
Internship EYes=0.9709
ENo=0.8631
G(Internship,S) =0.9016
Consider the attribute future studies; it has two possible classes viz. Yes and No. There are four students who wish to pursue future studies and remaining ten out of fourteen who do not have any plans to opt for higher studies. According to the training set, all the students who wish to pursue future studies are not placed. This indicates that all the information is contained in a single class. Hence, entropy becomes zero. Higher value of entropy indicates higher degree of distribution of information among classes. The lowest value of information gain is obtained for programming skills. Thus it is chosen as the root node. Further, the next lowest value (CGPA) is taken as the split node for next level. The subsequent nodes of decision tree at each level are determined by the value obtained in information gain.
Advantages of Decision Tree[16]
1. Variable screening or feature selection is implicitly performed by decision trees. Upon fitting a decision tree to a training set, within the dataset, the most essential variables are the top few nodes based on which the tree is split.
2. For data preparation, decision trees need less effort from users. To overcome scale differences between parameters - for example if there is a dataset which measures revenue in millions and loan age in years, say; this will require some form of normalization or scaling before it can fit a regression model and interpret the coefficients. Such variable transformations are not required with decision trees because the tree structure will remain the same with or without the transformation. Decision trees are also not sensitive to outliers since the splitting happens
3. Nonlinear relationships between parameters do not affect tree performance. As described here, highly nonlinear relationships between variables will result in failing checks for simple regression models and thus make such models invalid. However, decision trees do not require any assumptions of linearity in the data. Thus, they can be used in scenarios where known parameters are nonlinearly related.
4. The best feature of using trees for analytics is that they are easy to interpret and explain. Decision trees are very intuitive and easy to explain.
IV. RESULTS
The splitting node is based upon Information gain, i.e. Programming skills in this case. Table III indicates the department and the CGPA of the students who have good programming skills. Students having good programming skills are only considered as EGood=0.9544, whereas EAverage=0, EPoor=0.
TABLE IIIII
Attributes and their values after first splitting node
Department CGPA Programming
Skills
CS 8.33 Good EXTC 6.78 Good EXTC 6 Good
IT 9.67 Good
EXTC 7.9 Good
IT 7.99 Good
CS 6.12 Good
IT 7 Good
The next splitting attribute based upon Information Gain is CGPA. The students having good programming skills and CGPA >7 are considered. As, E≥7=0.9911 and
E≤7=0.
TABLE IVV
Values considered after the second splitting node
Department CGPA Programming
Skills
CS 8.33 Good
IT 9.67 Good
EXTC 7.9 Good
IT 7.99 Good
V. CONCLUSION
ACKNOWLEDGEMENT
We express our sincere gratitude towards our guide Prof. Lynette D’Mello who assisted us throughout our work. We thank her for directing us to the right tract and for the motivation and prompt guidance she has provided whenever we needed it.
REFERENCES
[1] Er.Paramjit kaur 1 , Er. Kanwalpreet Singh Attwal ," Comparative Analysis of Decision Tree Algorithms for the Student's Placement Prediction", International Journal of Advanced Research in Computer and Communication EngineeringVol. 4, Issue 6, June 2015
[2] D. D. B. Rakesh Kumar Arora, “Placement Prediction through Data Mining,” International Journal of Advanced Research in Computer Science and Software Engineering, vol. 4, no. 7, july 2014. [3] Kalpesh Adhatrao, Aditya Gaykar, Amiraj Dhawan, Rohit Jha and
Vipul Honrao, " Predicting Students' Performance using ID3 and C4.5 classification algorithm", International Journal of Data Mining & Knowledge Management Process (IJDKP) Vol.3, No.5, September 2013
[4] Dunham, M.H., (2003) Data Mining: Introductory and Advanced Topics, Pearson Education Inc.
[5] Sweta Rai, Priyanka Saini, Ajit Kumar Jain “Model for Prediction of Dropout Student Using ID3Decision Tree Algorithm”, International Journal of Advanced Research in Computer Science & Technology, Vol. 2 Issue 1 Ver. 2 Jan-March 2014.
[6] Namita Puri, Deepali Khot
,
Pratiksha Shinde, Kishori Bhoite, Prof. Deepali Maste, " Student Placement Prediction Using ID3 Algorithm",International Journal for Research in Applied Science & Engineering Technology (IJRASET), Volume 3 Issue III, March 2015[7] Weka Tool [Online] http://www.cs.waikato.ac.nz/ml/weka/
[8] Chenchen, "The apply of ID3 in stock analysis", The 6th International Conference on Computer Science & Education (ICCSE 2011) August 3-5, 2011. SuperStar Virgo, Singapore [9] Zdravko Markov, Ingrid Russell, " An Introduction to the WEKA
Data Mining System"
[10] Ajay Kumar Pal, Saurabh Pal, " Classification Model of Prediction for Placement of Students", I.J.Modern Education and Computer Science, 2013, 11, 49-56
[11] Singh, Soniya & Priyanka Gupta , "Comparative Study ID3, CART and C4.5 Decision Tree Algorithm: A Survey", International Journal of Advanced Information Science and Technology (IJAIST) Vol.27, No.27, July 2014.
[12] Xiaoliang, Z., Jian, W., Hongcan Y., and Shangzhuo, W., (2009) “Research and Application of the improved Algorithm C4.5 on Decision Tree”, International Conference on Test and Measurement (ICTM), Vol. 2, pp184-187.
[13] Ming, H., Wenying, N. and Xu, L., (2009) “An improved decision tree classification algorithm based on ID3 and the application in score analysis”, Chinese Control and Decision Conference (CCDC), pp1876-1879.
[14] [Online].
https://en.wikipedia.org/wiki/Weka_%28machine_learning%29.
[15] Information Gain [online] http://homes.cs.washington.edu/~shapiro/EE596/notes/InfoGain.pdf
[16] Key advantages of using decision trees for predictive analytics-Simafore [Online]
http://www.simafore.com/blog/bid/62333/4-key-advantages-of-using-decision-trees-for-predictive-analytics
[17] Dr. Rahul G. Thakkar, Mr. Vimal Patel, Mr. Hardik Desai, "Predicting Movement of Stock on The Basis of Daily Fluctuation Using Data Mining", International Journal of Advanced Research in Computer Science and Software Engineering, Volume 4, Issue 11, November 2014