A Genetic Algorithm Based Average Percentage of
Statement Coverage Technique for Test Case Ordering
Atul kumar Pal1, Makul Mahajan2 1
Student, Lovely Professional University, 2
Assistant Professor, Lovely Professional University
Abstract: This paper address the research in the field of test case ordering in regression testing. The idea is to improve APSC by applying our proposed approach adaptive genetic algorithm hybrid approach for test case ordering in regression testing. In this research basically we focused on test-case ordering and statement coverage by Applying adaptive genetic algorithm hybrid approach and measure APSC (Average Percentage Statement Coverage) and GA (Genetic Algorithm). In this research we take hundred test-case of apache server and evaluate hundred test-cases. We used java eclipse environment for coding and run the test cases. First we apply APSC (Average Percentage of statement coverage) technique for ordering test-cases as well measure the APSC. We got good results but this technique not sufficient to cover maximum statement. So, we hybrid the adaptive and Genetic Algorithm approach to measure the APSC and run all test-cases until all statement not covered.. Our approach gives us better results than single APSC adaptive technique.
Keywords: Regression Testing, Test case prioritization/ordering, Genetic Algorithm , APSC(Average Percentage of statement coverage) ,Adaptive Approach ,APFD(Average Percentage of Fault Detection),Fitness, Parent Generation , Crossover , Mutation.
INTRODUCTION
Software engineering is the application of a systematic, disciplined, quantifiable approach to the development, operation, and maintenance of software .It is also defined as a systematic approach to the analysis, design, assessment, implementation, testing, maintenance and reengineering of software .Software testing is an important activity in software development as well in software maintenance and quality assurance. It recognizes defects and problems, and evaluates and improves product quality. Software testing has been a serious research topic since the late 1960s. Software testing may represent more than 40%-60% of a software development budget. Moreover, approximately 50% of the elapsed time is expended in testing software being developed. Software maintenance refers to the modifications of software after delivery. Other terms suggested for maintenance are software support, software renovation, continuation engineering and software evolution [9]. To discover blames and issues in the item outline as right on time as would be prudent, trying is done in numerous stages. Software Testing Play an important role in assuring the software quality of the system. However many research papers proved and state that more than half of cost in software is used in testing and maintenance of the software. So many researchers already had done a lot research in to reducing the cost of software testing. But as well we have need to take care of their will
be no effect on the quality while we apply many approach in reducing the cost of testing ex: we can detect fault properly, we can cover overall statements of the code, we can provide ordering to each test case in which sequence we run test case that we cover all statements of the code. In this research we focused on Adaptive approach and extend this approach by applying Genetic Algorithms through this approach we found that we got better result of APSC then existing approaches. The adaptive test-case ordering approach computes the fault-detection capability of each test case based on the faulty potential (which measures to what extent a statement is likely to contain faults) of its executed statements. During regression testing, as soon as a selected test case finishes running, the adaptive approach modifies the faulty potential of all the statements executed by this test case based on its output, and then modifies the fault detection capability of all unselected test cases. The adaptive approach selects a test case with the largest fault-detection capability and programmers run the selected test case. The preceding process repeats until all the test cases are selected and run. Generally speaking, the adaptive approach schedules test cases and executes test cases simultaneously. This is also the main difference between the adaptive approach and existing test-case prioritization approaches.
In this research we focus to improve the efficiency in average percentage of statement coverage technique. We improved the APSC of adaptive approach by applying our proposed approach Adaptive genetic algorithm hybrid approach.
In this paper we discuss our research work in five section. In Section I we discus on related work. In Section II we discus on our Problem Formulation . In Section III we discus on our Research Methodology . In Section IV we discuss on our Results . In Section V we discuss on Conclusion and Future Scope.
1. RELATED WORK
before changes in the Program. To conquer this issue, they show a multipurpose investigate prioritization approach, which chooses the implementation request of experiments at the same time amid the execution of experiments. The versatile methodology chooses experiments in light of their flaw identification ability, which is computed in view of the produce of chose experiments. When an experiment is chosen and runs, the deficiency recognition ability of every unselected experiment is changed by yield of the most recent chose experiment. To assess their proposed methodology they perform this methodology on eight C language Program and four java language Program. Their experimental results prove the Adaptive approach is significantly better than the existing test case prioritization. In figure 1: comparison of both approach is shown [3].
Figure 1: Comparison between Test case prioritization approach and adaptive approach.[3]
Yu-Chi Huang et al.(2011) give brief history detail on test-case prioritization technique for regression testing and applied Genetic Algorithms process to cover statement of the code . They perceived that during testing, the experiment is a couple of data and expected yield, and various experiments will be executed either successively or haphazardly. The procedures of experiment prioritization generally timetable experiments for relapse testing in a request that endeavors to expand the proficiency. In any case, the expense of experiments and the strictness of shortcomings are generally shifted. In their paper, they propose a method of expense aware experiment prioritization taking into account the utilization of past records. They accumulate the past records from the most recent relapse testing and afterward propose a hereditary calculation to choose the best request. Some very much requested analyses are performed to assess the viability of our proposed system. Assessment results show that their proposed methodology has enhanced the deficiency discovery adequacy. It can likewise been discovered that organizing experiments in light of their authentic data can give high test adequacy amid testing [27].
2. PROBLEM FORMULATION
The existing test-case ordering approaches Dan Hao et al.[23] present an adaptive test-case prioritization approach, which determines the implementation order of test cases concurrently during the execution of test cases. In particular, the adaptive approach selects test cases based on their fault detection capability, which is calculated based on the output of selected test cases. As soon as a test case is selected and runs, the fault-detection capability of each unselected test case is modified according to the output of the latest selected test case. The adaptive approach is better than the additional approach on some subjects (e.g, replace and schedule).
When we apply this approach by taking hundred apache server test cases in java. we found that only 31 test cases cover near about 98 percent statements coverage but what about left test cases how we provide them order that we can cover maximum statements, so to improve this problem we applied Genetic Algorithm approach with adaptive approach on left test cases only and we found that this Adaptive Genetic Algorithm is better than simple adaptive approach we cover 99.6 percentage approx. statements cover by our proposed approach .
Figure2 shows that how we reach towards this problem this flow diagram represent the our work process from beginning of the research .
Figure 2: Flow chart to reach the problem in research.
3. RESEARCH METHODOLOGY
Algorithm of Adaptive Genetic Hybrid proposed Approach
Input: Test Suite T
Output: Tgreatest(A test case which has largest fitness value in
population of final generation).
APSC (Measure Adaptive Percentage of Statement Coverage)
Declaration:
Ts: represent the latest selected test case . N : number of test cases
M : statements P: population size . G: number of generation. Cp: Crossover Point. Mp : Mutation Point.
Ltc : Left Test cases after Adaptive Approach ordering . Adaptive Process :
1. Begin
2. for each test case t in T. 3. calculate initial priority(t). 4. End for .
5. Select the test case (ts) with the largest priority in T. 6. Add ts to T’
7. T ← T-{ts}. 8. Run ts.
9. While T is not empty do. 10. For each test case t in T.
11. Change priority(t) based on the output of ts. 12. End for
13. Select the test case(ts) with largest priority which cover statement.
14. Add ts to T’. 15. T ← T-{ts}. 16. Run ts. 17. End while
18. Return Ltc : left test case from T those not cover statement.
19. Genetic Algorithm Process : 20. Begin :
21. Input: Ltc
22. P1 ← generate population (Ltc,P,fl,fsl).
23. For i=1 to g.
24. F1 ←evaluateFitness (Pi, tc,fl,fsl)
25. Pi+1 ← addTwoBest(Fi, Pi)
26. For j=3 to P.
27. Parent1← RandomSelectParent(Pi)
28. Parent2 ←RandomSelectParent(Pi)
29. Child1,child2 ← CrossOver(Parent1 , Parent2,Cp)
30. Child1 ← Mutation(Child1, mp)
31. Child2 ← Mutation(Child2, mp)
32. Pi+1← addChildren(Child1,child2)
33. Fg+1 ← EvaluateFitness(Pg+1,tc,fl,fsl)
34. Tgreatest ← SelectBest Child(Fg+1,Pg+1)
35. Return Tgreatest.
36. Measure APSC : 37. C←n*m (n←Lts) 38. N2←2*n
39. S1←sum/c (sum=0)
40. S2←1/(2*n)
41. Apsc←1-(S1+S2)
42. Apsc←Apsc*100 43. Return Apsc
Figure 3: Algorithm1 (Adaptive Genetic Hybrid Algorithm)
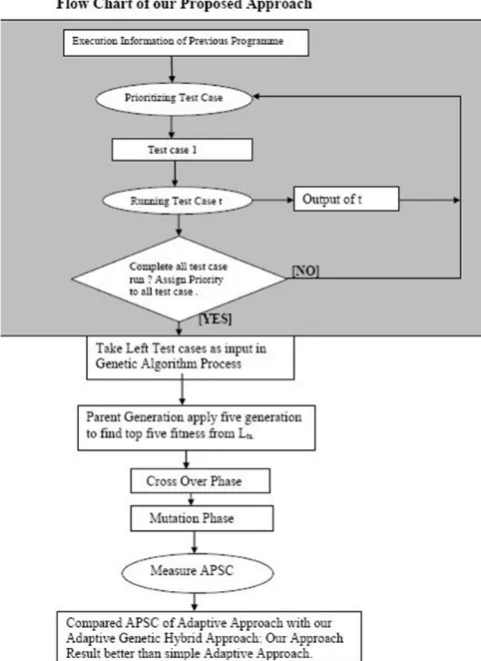
In figure 4 represent the flow chart of our prosed algorithm the gray shaded area in flow chart represent the adaptive approach and rest part applied by us that is genetic algorithm .
Figure 4 : Flow Chart of our Proposed Approach(Research Methodology)
Adaptive Genetic Algorithm Hybrid proposed test-case prioritization approach in this approach we ordering the test case and find the average percentage of statement coverage for hundred test cases in java . First we measure the APSC of adaptive approach and ordering the test case. In adaptive approach we order the test case like until our statement not cover if test cases left or we can say failure test cases those are unable to cover any statement its means the statement coverage is not done perfectly . We take that Left test cases after applying adaptive approach and perform genetic algorithm on these test case. In Genetic algorithm we apply three main techniques to order the test case like this our APSC improved as compared to adaptive approach. We apply these techniques in genetic algorithm to giving the order to each test case
3.1 Adaptive Approach
In this Research Methodology, we first present the adaptive process of the existing test-case prioritization approach by howing its basic difference with our proposed approach adaptive genetic hybrid approach and then give the details of the adaptive genetic hybrid approach in below sections. For ease of exhibition, we present the adaptive genetic hybrid test case ordering approach in terms of statement coverage, which can also be implemented on other adaptive approach also. In figure 8: the dark area of flow chart represent the adaptive approach methodology the rest for flow chart is further methodology of Genetic algorithm. The overall flowchart figure 3. Represent the our adaptive genetic hybrid approach methodology.
We take hundred apache server test cases Antloader package of test cases in java IDE Eclipse.
First we set each test case priority 1. Priority (t) = Ʃ Potential(S) --- (1)
Where potential(s) represent how likely statement covered by the existing selected test case. Potential(S) of any statement S in which scope [0,1].
If test case(t’) passed then, Potential(s) , s is not executed by t’. Potential(S) = Potential(s)*q , s is executed by t’
If test case(t’) failed then,
Potential(s)*P , s is executed by t’
P and q are two non-negative constants whose values are between 0 and 1. In our implementation process while all test case priority set 1 in initial than, we run all test case those test case cover statement we provide “G” to that test case. Those test case gain maximum number of G their priority must be high. so according to this process we found that in this approach by running hundred test cases few test cases cover the statements on that bases we calculate APSC of this approach.
The effect of passed/failed output on the ܲݐ݁݊ݐ(ݏ) of any statement ݏ is measured by ݍ/ in the earlier equation. Moreover, when p=q=0, the adaptive approach becomes the additional statement-coverage based test-case prioritization approach, whereas when p=q=1, the adaptive approach becomes the total statement-coverage based test case ordering approach. That is, the total or additional statement-coverage based test-case ordering approach can be viewed as an instance of the adaptive approach. The existing research on test-case prioritization has fully evaluated the effectiveness of the total approach and the additional approach. Although and ݍ in the preceding equation are two independent variables, to facilitate evaluation of the proposed adaptive approach, currently we assume +ݍ = 1 in this research and evaluate the effectiveness of the adaptive approach by setting q=0, 0.2, 0.4, 0.6, 0.8, or 1,
Than we calculate APSC for adaptive approach by applying APSC formula .
3.2 Parent Generation : This is the first step of genetic
algorithm of parent selection we apply this process only on the remaining test cases after adaptive approach for the selection of five top parents we set priority to each test case according to the statement coverage we calculate fitness In our proposed algorithm 1 Pg + 1, is produced, the fitness value of each chromosome is determined on line 33. In Algorithm1 , and the chromosome whose fitness value is the greatest is selected to be the test order. We select parent randomly Algorithm 2 show that how parent selection process going on.
Algorithm 2: Random Parent Selection Algorithm
Input : Pi the population of the ith generation. output : Parent chromosome selection
1. FitnessSum← calculate fitnessSum of chromosome(Pi) 2. r← generate random number(FitnessSum)
3. for K=1 to P
4. r← r-fitof Chromosomek 5. if r < 0
6. Break
7. Parent← chromosomek 8. Return Parent
Figure 5: Random Parent Selection Algorithm.
As the above Figure 5 Algorithm 2 states that first we input the population of the rest of test cases after adaptive approach in1st generation we apply five generation in our experiment. According to above algorithm first we take randomly chromosomes. We take two highest priority test cases from previous adaptive approach as Parent1 and Parent 2. While we calculate the fitness and the highest fitness test case become the next parents of nest generation. Like this process we got five highest parents with high fitness value. After performing first generation we not consider that highest parent fitness in second generation. Same like this after getting second highest fitness value we don’t consider that test case in third so on until we not complete all process for each test case.
3.3 Cross Over : After completion of first step of Genetic
from both folks. The joined capacity on lines 7 and 8 creates a tyke by consolidating the duplicated subsequence of one guardian with the qualities of another guardian that are not in the replicated subsequence.
Input: Parent1 : selective Chromosome from population
Parent2 : Another Selective chromosome from population
Cp : CrossOver Point
Output: Children1, Children2 (two new chromosomes
produced by algorithm)
1. n← generateRandomNumber(100) 2. if n < Cp
3. P1← select Crosspoint(Parent1) 4. P2← select CrossPoint(Parent2) 5. Segment1 ← fragment(P1,Parent1) 6. Segment2 ← fragment(P2,Parent2) 7. children1← join(Segment1 , Parent2) 8. children2← join(Segment2 , Parent1) 9. else
10. children1← Parent1 11. children2← Parent2 12. Return children1 children2
Figure 6: Algorithm 3 Cross over
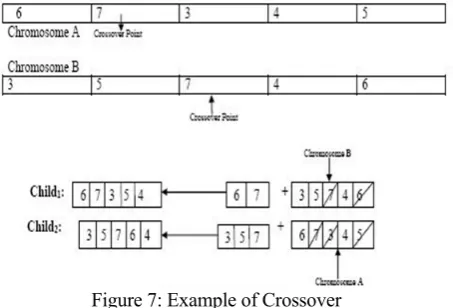
Figure 7: Example of Crossover
For example, considering the chromosomes in Fig 7 demonstrates their hybrid process. The hybrid purposes of An and B are at positions 2 and 3, individually. Child1 gets the subsequence before the hybrid point from An, and the rest from B. Since 6 and 7, which are qualities of B, are additionally in the subsequence duplicated from A, they are not added to the child1. So also, child2 acquires the subsequence before the hybrid point from B, and the qualities that are not in that subsequence from A.
3.3.4 Mutation: Mutation is performed on the chromosomes
got by the hybrid process First, the transformation (childrenc, mp) creates a number, n, which goes from 0 to 100 on line 1. On the off chance that n is not exactly the change likelihood, mp, the calculation chooses two qualities of childrenc arbitrarily and swap their positions, as demonstrated in Fig.8. Something else, the transformation administrator would not be connected.
Figure 8 : Example of Mutation
Algorithm 4: Mutation
Input: Childrenc chromosome produced by crossover .
Mp Mutation Point
Output: Childrenm , chromosome produced by algorithm
1. N← GenerateRandomNumber(100) 2. if N<Mp
3. Mp1 , Mp2 ←select Mutation Points
4.Childrenm← SwapPosition(Mp1 , Mp2, Childrenc )
5. else
6.Childrenm← Childrenc
7. Return Childrenm
Figure 9: Algorithm 4 Mutation Algorithm
In Mutation phase of genetic algorithm paper we take both children chromosome generated by the crossover operator. We show in figure 3.8, how the children change after applying mutation operator. First we take children1 and randomly generate number for two different mutation points . as in example Mp1 and Mp2 indicate gene 7 and 5 in above example. We simply swap these genes and got childrenm1 , and Childrenm2 . same process going on for each chromosomes we received after cross over operator/phase . The mutation (childc, mp) also gives those test cases a chance to get a higher priority for test case ordering .
3.5 Measure APSC: The fifth step of our methodology is
measuring the average percentage of statement coverage which will show our experimental work, the result of APSC represent how our approach is better than adaptive approach. The general formula to measure APSC.
APSC = 1 - Ts1+Ts2 +……….. Tsm + 1/2*n n*m
but in our experimental coding we apply this formula like . APSC = 1 – sum/c + 1/ 2*n
Where , n= number of test case (Ltc left test cases after adaptive approach)
M= statements C= n*m
S1 = sum/n*m , sum/C . S2 = 1/(2*n)
APSC= 1-S1 +S2 .
3.6 Execution time
The last parameter measures in this research is execution time .we calculate how much execution time should be taken by existing approach and proposed approach .and we found that execution time is high in our proposed approach because this is generally clear as well it should take more time than adaptive approach because we execute adaptive approach as well genetic algorithm process in which five parent generation , crossover and mutation operators processing in our proposed approach .we also found that execution time depend on the system configuration also . while we process this approach on high configuration system it take less time while we process on law configuration system it take a lot of time . so we conclude this parameter in our future scope we can improve APSC as well time execution if we apply any other approach/technique further.
4.RESULT AND GRAPHS
In this chapter we will discuss about the result obtained by us for both existing approach as well our proposed approach. In existing approach of adaptive test-case prioritization we calculate APSC (average percentage of statement coverage) and execution time also by vary the q and p value .
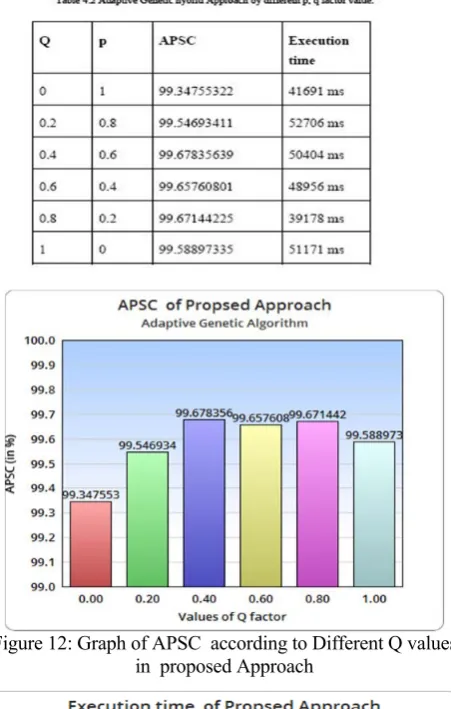
The existing research on test-case prioritization has fully evaluated the effectiveness of the total approach and the additional approach. Although and ݍ in the preceding equation are two independent variables, to facilitate evaluation of the proposed adaptive approach, currently we assume +ݍ = 1 in this research we evaluate the effectiveness of the adaptive approach and proposed approach by setting q=0, 0.2, 0.4, 0.6, 0.8, and 1 . We focus on Q factor value just because the q factor value multiply only when test case is pass. Same like that we calculate the execution time for the adaptive approach and proposed approach by setting q=0, 0.2, 0.4, 0.6, 0.8, and 1 .
As it shown in table number 4.1 while we take different p, q factor values we get different average percentage of statement coverage and execution time. We found that the highest APSC is at q=0.2, p=0.8 value while the minimum time taken at q=0.4, p=0.6. so from this table we analyses we can change the factor value according to our need in which we have need to focus. If our focus on to statement coverage we take best value of p, q in which we get highest APSC. While we have needed to focus on execution time we will select p, q value according to the low executions time value.
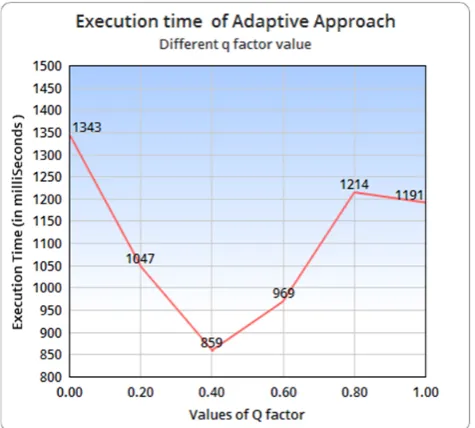
Figure 10, represent the value of APSC on Y-axis while there is different Q factor value on x-axis. While in figure 11 the graph resent the execution time take by adaptive approach while we measure APSC.
Figure 10: Graph of APSC according to Different Q values in Adaptive Approach.
Figure 11: Graph of Execution Time according to Different Q values in Adaptive Approach
Figure 12: Graph of APSC according to Different Q values in proposed Approach
Figure 13: Graph of Execution Time according to Different Q values in Proposed Approach.
In the above figure and tables we represent the separate outcomes from both approach the existing adaptive approach as well our prosed approach. After that we compare the both approach on the basis of APSC as well time execution . In Figure 14 it shows that the comparison between the adaptive and our proposed approach. The red color bar indicate the adaptive approach while green bar represent our proposed approach and it is clear represented by graph our approach is better than existing adaptive technique in this research basically we focus only on APSC rather than execution time.While in figure 15 the line graph represent the time taken comparison between the existing
approach as well our proposed approach red line in graph represent the time taken by adaptive approach and green line represent the time taken by our proposed approach.
Figure 14: APSC Comparison of Adaptive and proposed Approach.
Figure15 : Comparison of Execution Time among Adaptive and Proposed Approach.
5.CONCLUSION AND FUTURE SCOPE
REFERENCES
[1]. A.B Taha, S.M. Thebaut, and S.S. Liu.,”An approach to software fault localization and revalidation based on incremental dat flow analysis”. in proceeding of the 13th Annual International Computer Software and Applications Conference..
[2] A. Marback, H. Do, and N. Ehresmann, “An effective regression testing approach for PHP web applications,” in Proceedings of the International Conference on Software Testing, Verification and Validation, Apr. 2012, pp. 221–230.
[3] Dan Hao, Xu Zhao, “Adaptive Test-Case Prioritization Guided by Output Inspection” 37th Annual International Computer Software and Applications Conference (COMPSAC 2013), 22-26 July 2013, pages 169-179, Tokyo, Japan
[4] D.Hoffman and C.Brealey. “Module test case generation” in proceedings of the Third Workshop on Software Testing, Analysis, and Verification, pages 97-102, December 1989.
[5] G. Rothermel and M. J. Harrold, Analyzing Regression Test Selection Techniques, IEEE Transactions on Software Engineering, V.22, no. 8, August 1996, pages 529-551.
[6] G. Rothermel, R. H. Untch, C. Chu, and M. J. Harrold,
“Prioritizingtest cases for regression testing,” IEEE Transactions on Software Engineering, vol. 27, no. 10, pp. 929–948, October 2001. [7]
http://www.ehow.com/facts_5835705_difference-between-operand-operator.html
[8] J. Hartmann and D.J. Robson.” Revalidation during the software maintenance phase”in Proceeding of the conference on Software Maintenance.
[9] J.Ziegler, J.M. Grasso, and L.G. Burgermeister.” An Ada based real-time closed-loop integration and regression test tool”. in Proceedings of the Conference on Software Maintenance -1989, pages 81-90, October 1989
[10] J. Offutt, J. Pan, and J. M. Voas.” Procedures for reducing the size of coverage-based test sets” in Proceedings of the Twelfth International Conference on Testing Computer Software, pages 111– 123, June 1995.
[11] Keith H. Bennett and V_aclav Rajlich. “Software maintenance and evolution: a roadmap.” in Proceedings of the International Conference on Software Engineering (ICSE'00), pages 73{87, 2000}.
[12] K. Onoma, W-T. Tsai, M. Poonawala, and H.
Suganuma.”Regression testing in an industrial environment”.
[13] Mithun Acharya ,”Configuration Selection Using Code Change Impact Analysis for Regression Testing”, 28th IEEE International Conference on Software Maintenance (ICSM), 2012
[14] Md. Hossain , “Regression Testing for Web Applications Using Reusable Constraint Values ,” IEEE International Conference on Software Testing, Verification, and Validation Workshops , 2014. [15] Md. Junaid Arafeen and Hyunsook , “Test Case Prioritization Using
Requirements-Based Clustering “, IEEE Sixth International Conference on Software Testing, Verification and Validation ,2013 [16] Mitchell Melanie, Fifth printing, 1999 An Introduction to Genetic
Algorithms , A Bradford Book The MIT Press , Cambridge, Massachusetts • London, England
[17] M.J. Harrold, R. Gupta, and M.L. Soffa. “A methodology for controlling the size of a test suite. ACM Transactions on Software Engineering and Methodology”.
[18] Nicolas Frechette, “Regression Test Reduction for Object-Oriented Software: A Control Call Graph Based Technique and Associated Tool” , Hindawi Publishing Corporation ISRN Software Engineering Volume 2013, Article ID 420394, 10 pages
[19] P.A Brown and D. Hoffman. “The application of module regression testing at TRIUMF. Nuclear Instruments and Methods in Pysics Research”, Section A, . A293(1-2):377-381, August 1990.
[20] Prof. A. Ananda Rao and Kiran Kumar J “An Approach to Cost Effective Regression Testing in Black-BoxTesting Environment “IJCSI international journal of computer science issues vol.8 issue 3,No. 1 may 2011
[21] Regression Test Selection by Exclusion ,Durham E-Theses, Durham University.
[22] R. Lewis, D.w. Beck, and J.Hartmann. “Assay – a tool to support regression testing”. In ESEC’ 89.2nd European Software Engineering Conference Proceedings, pages 487-496,
[23] S. Elbaum, A. G. Malishevsky, and G. Rothermel. “Test case prioritization: A family of empirical studies.” IEEE Transactions on Software Engineering, 28(2):159–182,February 2002.
[24] Swarnendu Biswas , “Regression Test Selection Techniques: A Survey” , Informatica 35 (2011) 289–321 289
[25] http://www.chartgo.com
[26] Xuan Lin . “Regression Testing in Research And Practice”, University of Nebraska, Lincoln1-402-472-4058
[27] Yu-Chi Huang “A history-based cost-cognizant test case
![Figure 1: Comparison between Test case prioritization approach and adaptive approach.[3]](https://thumb-us.123doks.com/thumbv2/123dok_us/7856282.1303020/2.595.80.260.245.457/figure-comparison-test-case-prioritization-approach-adaptive-approach.webp)