Determination of Cellular Strains by Combined Atomic Force Microscopy
and Finite Element Modeling
Guillaume T. Charras and Mike A. Horton
The Bone and Mineral Centre, The Rayne Institute, Department of Medicine, University College London, London WC1E 6JJ, United Kingdom
ABSTRACT Many organs adapt to their mechanical environment as a result of physiological change or disease. Cells are both the detectors and effectors of this process. Though many studies have been performed in vitro to investigate the mechanisms of detection and adaptation to mechanical strains, the cellular strains remain unknown and results from different stimulation techniques cannot be compared. By combining experimental determination of cell profiles and elasticities by atomic force microscopy with finite element modeling and computational fluid dynamics, we report the cellular strain distributions exerted by common whole-cell straining techniques and from micromanipulation techniques, hence enabling their comparison. Using data from our own analyses and experiments performed by others, we examine the threshold of activation for different signal transduction processes and the strain components that they may detect. We show that modulating cell elasticity, by increasing the F-actin content of the cytoskeleton, or cellular Poisson ratio are good strategies to resist fluid shear or hydrostatic pressure. We report that stray fluid flow in some substrate-stretch systems elicits significant cellular strains. In conclusion, this technique shows promise in furthering our understanding of the interplay among mechanical forces, strain detection, gene expression, and cellular adaptation in physiology and disease.
INTRODUCTION
Many organs adapt to their mechanical environment: new
bone is synthesized in response to high exercise regimen
(Rubin and Lanyon, 1984), cardiac and vascular smooth
muscle adapt to pump pressure (Xu, 2000), and skeletal
muscle adapts to exercise levels (Russell et al., 2000). The
detection and adaptation to mechanical strain are performed
by the cells constituting these organs.
Many experiments in vitro have highlighted cellular
de-tection and adaptation to mechanical stimuli using a variety
of devices to apply mechanical stimulation: endothelial cells
submitted to fluid flow for 24 h align with the direction of
flow (Girard and Nerem, 1993), and steady and oscillating
fluid shear stress can elicit calcium transients in a variety of
cell types (Hung et al., 1996); cells submitted to substrate
stretch realign perpendicular to the direction of strain
(Haya-kawa et al., 2001); chondrocytes submitted to intermittent
hydrostatic pressure increase proteoglycan synthesis
(Jor-tikka et al., 2000); osteoblasts increase their intracellular
calcium concentration when subjected to micropipette
pok-ing or pullpok-ing via magnetic microbeads (Xia and Ferrier,
1992; Glogauer et al., 1995); and endothelial cells increase
gene expression of endothelin-1 when subjected to
mi-crobead twisting (Chen et al., 2001). Methods of applying
mechanical stimulation can be broadly divided into two
categories: those that apply stimulation over the whole cell
(substrate stretch, fluid shear, intermittent hydrostatic
pres-sure), and those that stimulate only a small part of the cell
body (microbead pulling, microbead twisting, micropipette
poking). Results obtained with one straining system are
difficult to compare to those obtained with another. Indeed,
cells are most likely to detect deformations applied onto
their structure or, in engineering terms, strain (deformation
per unit length). Knowing the strain distributions on cell
surfaces would enable results from different straining
tech-niques to be compared to one another, and their
physiolog-ical consequences to be analyzed.
Common engineering techniques such as computational
fluid dynamics (CFD) or finite element modeling (FEM)
can be used to compute the shear stresses resulting from
fluid flow or the strain distributions due to mechanical
stimulation. CFD enables velocity and pressure
distribu-tions generated by a fluid flowing over a surface to be
determined and, therefore, shear stress distribution can be
determined. CFD has been utilized with success to
investi-gate the flow of blood through arteries and their bifurcations
(Long et al., 2001). Barbee et al. (1995) calculated the shear
stresses due to fluid flow over an endothelial cell monolayer
whose topography had been acquired using atomic force
microscopy (AFM). Used in conjunction with FEM, this can
yield the cellular strains elicited by fluid shear stress.
In-deed, FEM allows the strain distribution due to a given set
of loading and boundary conditions applied onto a structure
whose material properties are known to be determined.
FEM has been applied with success to modeling and
deter-mining the strain distributions within whole organs such as
bone (van Rietbergen et al., 1999), cartilage (Gu et al.,
1997), or the arterial wall (for a review see Simon et al.
(1993)), but has seldom been applied to individual cells due
to lack of precise data on cellular material properties or
shape. Riemer-McReady and Hollister (1997) modeled an
osteocyte embedded within its lacuna to find the strains
Submitted January 14, 2002, and accepted for publication March 4, 2002.Address reprint requests to Dr. Mike Horton, 5 University Street, London WC1E 6JJ, UK. Tel.: 44-207-679-6169; Fax: 44-207-679-6219; E-mail: [email protected].
applied to the cell by a uniform compression of the matrix
in which it was embedded. Guilak and Mow (2000) and Wu
and Herzog (2000) modeled a chondrocyte embedded within a
cartilaginous matrix. In all three cases the cells were modeled
as spheres with homogenous properties, hence ignoring
poten-tial inhomogeneities in material properties or topology. Other
finite element models have concentrated on predicting cellular
material properties from the cytoskeletal structure (Hansen et
al., 1996), predicting the rearrangement of the cytoskeleton
(Picart et al., 2000), or the evolution of the cell shape in
response to micropipette aspiration (Drury and Dembo, 1999).
Although many methods exist to measure the bulk cellular
material properties, only AFM enables the three-dimensional
profile of cell surfaces to be acquired at high resolution
to-gether with their material property distribution (for a review
see Radmacher (1997)).
In this study we combined AFM with FEM and CFD to
calculate the strain distributions resulting from common
whole-cell mechanical stimulation techniques.
Experimen-tally acquired cell profiles and material property maps
ac-quired by AFM were converted into three-dimensional
fi-nite element models. Different sets of boundary and loading
conditions were applied to the cell models to simulate
straining experiments (substrate stretch, fluid shear, and
intermittent hydrostatic pressure). Common
micromanipu-lation experiments (microbead pulling and twisting,
mi-cropipette poking) were modeled on a small subcellular
volume and strain distributions were calculated to provide a
comparison to the whole-cell straining experiments.
Cellu-lar adaptation to mechanical stresses was simulated by
increasing the elastic modulus of the cells and examining its
effect on the strain distributions. The different parameters
pertaining to the stimulation method were varied and their
effect on the strain distributions was examined. In addition,
we used these models to calculate the strain magnitudes
resulting from experiments by other groups and compared
the strain levels needed to trigger the reported detection
mechanisms and downstream cellular responses.
In conclusion, we report for the first time the application
of AFM in conjunction with FEM and CFD to calculate the
strain distributions in cells resulting from common methods
of mechanical stimulation. The knowledge of these strain
distributions will enable different straining experiments to
be compared to each other. Moreover, these data should aid
our understanding of whether strains induced by commonly
used straining techniques are detected via different
intracel-lular signaling pathways.
MATERIALS AND METHODS
Experimental data
Cell culture
Osteoblasts were isolated from the long bones of neonatal rats by mechan-ical disaggregation and cultured for 72 h at 37°C in an atmosphere of 5%
CO2in air in DMEM (Gibco Life Technologies, Paisley, UK)
supple-mented with 10% FCS, 2% glutamine, 2% penicillin streptomycin, 2% 1 M HEPES, pH 7.0.
Immunostaining and confocal microscopy
Immunostaining was performed as described in Nesbitt and Horton (1997). Briefly, the cells were fixed in a PBS solution containing 2% formaldehyde and 0.1% glutaraldehyde, and permeabilized in ice-cold Triton X-100 buffer for 5 min at 4°C. They were then incubated with monoclonal anti-paxillin (Transduction Laboratories, Lexington, KY), a focal contact protein, for 30 min, FITC-labeled goat anti-mouse Ig antibody (Dako, Denmark) for 30 min, and rhodamine-phalloidin (Molecular Probes Eu-rope, Leiden, The Netherlands) for 30 min. All coverslips were imaged with a 100⫻ oil-immersion objective on a Leica confocal microscope running TCS NT (Leica, Bensheim, Germany). Fluorescent images were sequentially collected in 0.4-m steps with emission wavelengths of 488 and 568 nm for the FITC and TRITC fluorophores, respectively. The images were then post-processed using Imaris software (Bitplane Ag, Zu¨rich, Switzerland) on an SGI O2workstation (SGI, Mountain View,
CA).
Atomic force microscopy
A Thermomicroscopes Explorer (Thermomicroscopes, Sunnyvale, CA) inter-faced onto an inverted microscope (Nikon Diaphot 300, Nikon UK, Kingston, UK) was used to acquire the material properties of the cells (Lehenkari et al., 2000). The measurements were carried out using soft V-shaped cantilevers with pyramidal tips (k⫽0.032 N䡠m⫺1, model 1520, Thermomicroscopes) and
these were calibrated in air before experimentation.
Osteoblastic cells cultured on glass coverslips were transferred to the AFM sample holder and examined in physiological buffer (127 mM NaCl, 5 mM KCl, 2 mM MgCl2, 0.5 mM Na2H PO4, 2 mM CaCl2, 5 mM
NaHCO3, 10 mM glucose, 10 mM HEPES, 0.1% BSA adjusted to pH 7.4).
For each cell, force-distances curves were collected at points on a 50⫻50 or 100⫻100 grid. The approach speed used for the force-distance curves was 5m䡠s⫺1to minimize contributions of cellular viscoelasticity to the
estimated cellular elasticity (A-Hassan et al., 1998).
Material property measurement
Cellular material properties were evaluated as described in Radmacher (1997). Briefly, the cell was assumed to be a homogenous half space and the tip conical. The force F needed to produce an indention of depth␦in a half-plane with an elastic modulus E is (Johnson, 1985):
F
conical⫽
2
E
共
1
⫺
2兲
tan
共␣兲
␦
2(1)
With␣the opening angle of the conical tip andthe local Poisson ratio. Knowing the cantilever stiffness and by fitting the theoretical curve to the experimental data, the elastic modulus can be deduced (Radmacher, 1997). The cellular Poisson ratio was assumed to be 0.3, in line with experimental measurements in live cells (0.25⫾ 0.05, Maniotis et al., 1997). It is necessary to choose a value of the Poisson ratio, as experimentally acquired force-distance curves fitted with Eq. 1 cannot yield both the cellular elasticity and Poisson ratio. A custom-written program running under Pv-Wave (Visual Numerics, Boulder, CO) on an SGI O2workstation was
used to fit the force-distance curves automatically.
The spatial resolution of the material property maps could be estimated by calculating the diameter of the tip-cell contact area. Using Eq. 1, one can find␦and, assuming that the indentation is cone-shaped, the diameter of contact is d⫽2␦tan(␣). For␣⫽30°, E⫽1 kPa, F⫽1 nN,⫽0.3, we find d⫽ 1.04 m. Hence, 100 ⫻ 100 grids, which sample material
properties every micrometer, are the highest resolution that can be attained without excessive spatial overlap in measurements.
Numerical modeling for whole-cell
mechanical models
The AFM scans of 10 osteoblasts were converted into three-dimensional finite element models incorporating the experimentally measured elastici-ties and topographies using a custom-written program running under Pv-Wave.
Generation of whole-cell models
and substrate were presumed to be uniformly bound along their contact area rather than in a discrete number of points representing the cellular focal adhesion complexes (Fig. 1 A). The cells and the substrate were modeled with eight-noded parametric volumic elements. Because of the large number of different elastic moduli within a cell, the cellular distri-butions were grouped into 10 material property collectors with the follow-ing elasticities:
E
i⫽
E
max⫺
E
min10
䡠
冉
i
⫹
1
2
冊
,
i
⫽
0, . . . , 9
(2)
With Emaxand Eminthe maximum and minimum elasticities of the cellmodeled.
Physical model
As we were interested only in the static solutions for whole-cell strains, all materials were assumed to be linear elastic and isotropic (Zhu et al., 2000). Cell and substrate had a Poisson ratio of 0.3 (Maniotis et al., 1997). Appropriate boundary conditions and forces were applied to the models to simulate substrate stretch or intermittent hydrostatic pressure.
The linear elastic continuum mechanics equations (Timoshenko and Goodier, 1970) were then solved to find the strain distributions exerted on the cells. In its simplest expression, engineering strain⑀can be defined as the length variation dl per unit length l (⑀⫽dl/l). Engineering strain is usually expressed in percent variation of length or microstrain (⑀) with 1% strain⫽0.01⑀⫽10,000⑀. All of the finite element calculations were carried out with CAST3M, a general-purpose finite element solver with an integrated pre- and post-processor (CAST3M, Commissariat a` l’Energie Atomique, Saclay, France, [email protected]., available free for universities) and were run either on an SGI O2or a standard PC.
Boundary conditions
Substrate stretch. For the substrate stretch simulations, a displacement equivalent to 0.1% stretch in the x-direction was applied to one end of the substrate and the other side was constrained in the x-direction. The sides running parallel to the x-direction were constrained in the y-direction. The underside of the substrate was constrained in the z-direction (All boundary conditions are represented in Fig. 2 A).
To assess the effect of the cellular Poisson ratio on the strain magnitude,
was varied, for the whole mesh, between 0.2 and 0.5 while applying a stretch of 0.1% along the x axis. To assess the effect of stretch direction, the simulated direction of stretch was varied and had angles of 0°, 30°, 45°, 60°, and 90° with the x axis, while keeping stretch magnitude and Poisson ratio constant. These analyses were carried out on one osteoblast model only, as the strain distributions for the other cells would vary similarly due to the linear elastic nature of the mechanical model.
Intermittent hydrostatic pressure. For the intermittent hydrostatic pres-sure experiments, the underside of the substrate was fully constrained and a hydrostatic pressure of 5 Pa was applied to the top surface (All boundary conditions are represented in Fig. 3 A). To assess the effect of the Poisson ratio on cellular strain distributions, it was varied, for the whole mesh, between 0.2 and 0.5 while keeping the pressure constant. This analysis was carried out on one cell model only.
Generation of osteocyte models
The material properties of osteocytes were assumed to be the same as those of osteoblasts. As osteocytes and their cavities are ellipsoidal (Marotti et al., 1992), we modeled only half of the cell-cavity complex, thereby assuming that the other half of the cell was perfectly identical. To simulate that osteocytes were embedded in the bone matrix, the cell models were covered by a layer of matrix elements forming a brick with a “mold” of the
cell on the underside. The cell and the matrix were assumed to be uni-formly bound along their surface of contact. The underside of this model was constrained in the z-direction. A displacement equivalent to 0.1% compression in the x-direction was applied to one end of the block of matrix and the other side was constrained in the x-direction. The sides running parallel to the x-direction were constrained in the y-direction. The bone matrix was assumed to have an elasticity of 4 GPa, in agreement with experimentally measured values (Mente and Lewis, 1989).
Numerical modeling for fluid shear simulations
To examine the strain distributions resulting from fluid flow on cells, the calculations had to be performed in two distinct steps. First, a CFD model had to be generated to calculate the flow lines and shear stresses resulting from flow over the cellular profile. Second, an FE model of the cell was generated and the shear stresses from the CFD simulation were applied to the mechanical model. The strain distribution resulting from these could be calculated. As the cellular deformations were small (⬍0.1%), we assumed that the cellular deformations did not significantly affect the flow lines around the cell profile, and hence we did not need to iterate the process.
Generation of the models
For the fluid flow simulations, the material property distributions and topographies were reduced to a 25⫻25 grid to reduce calculation time and were converted into a three-dimensional finite element model. An entrance and an exit, 10m wide, were added to reduce transitory effects.
First, a CFD model of the cell and substrate surface was created with eight-noded linear volumic fluid flow elements (Fig. 4 A). The CFD model had a height of 16m, which was over fourfold greater than the average height perturbation introduced by the cell profile.
As a second step, an FEM model of the cell was created with the material properties and the topographies obtained from experimental mea-surements (Fig. 4 B). The substrate was two elements thick and the cellular material was one element thick.
Computational fluid dynamics: physical model and boundary conditions
The cell surface was subjected to a laminar flow of an incompressible viscous fluid with a parabolic profile (Fig. 4 A). We assumed that the flow on the top surface of the model was not significantly perturbed by the cell profile and therefore imposed a constant velocity umax. We assumed that the cell did not
significantly perturb the flow in the transverse horizontal direction and im-posed a condition of no transverse flow on the side surfaces. The velocity on the cell-substrate surface was imposed to be 0 (all boundary conditions are represented in Fig. 4 A). The CFD code (CAST3M) solved the Navier-Stokes equations (Currie, 1993) using a finite-element approach and output the velocities and pressures for each element of the CFD model:
Dv
Dt
⫽
⫺ⵜ
p
⫹
ⵜ
2v
(3)
ⵜ
䡠
v
⫽
0
(4)
The shear stresses tensor and shear stresses were then calculated as follows (Currie, 1993):
ij⫽
⫺
p
␦
ij⫹
冉
⭸
v
i⭸x
j⫹
⭸
v
j⭸x
i冊
(5)
i⫽
冘
j⫽x,y,z
ij䡠
e
i⫽
˜
䡠
e
i(6)
With␦ijthe Kronecker delta,the density of the fluid, vithe velocity
of the fluid flow in the i direction,ijthe element of the shear tensor
in position ij,ithe resulting shear stress vector in the i direction, eithe
directing vector i of the orthonormal base of vectors, and the
cinematic viscosity of the fluid;andwere assumed to be the same as for water (respectively 1000 kg䡠m⫺3and 10⫺3N䡠s䡠m⫺2); u
maxwas
adjusted to give rise to a shear stress of 5 Pa (50 dyn䡠cm⫺2) on a flat
substrate and was 0.046 m䡠s⫺1.
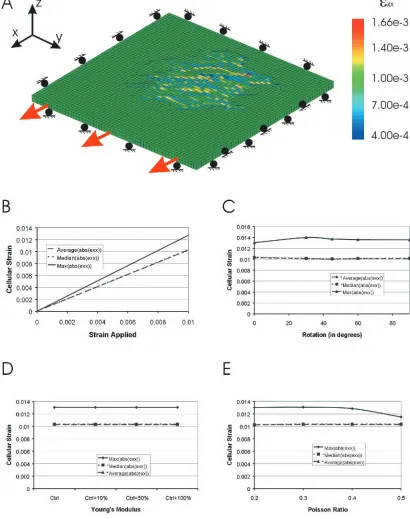
FIGURE 2 The effect of substrate stretch. (A) The distribution of⑀xxon the cell and substrate surface for a 0.1% stretch. The red arrows indicate
the directions of stretch and the balls indicate a sliding boundary condition. One grid division is 2m in length. (B) Evolution of the maximum, median, and average cellular strains for commonly used substrate stretches. These evolutions are averaged over 10 cells. (C) The effect of the direction of stretch on the cellular strains (⑀11) in one cell. The direction is expressed by its angle with the x axis. (D) The effect of increasing
elasticities on cellular strains (⑀xx) for a fixed stretch of 0.1% in one cell. (E) The evolution of cellular strains (⑀xx) with cellular Poisson ratio for
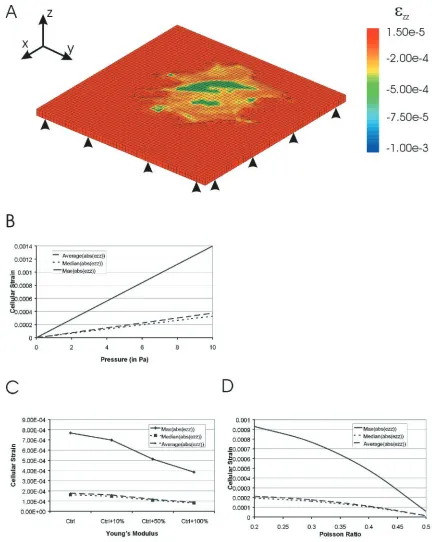
FIGURE 3 The effect of hydrostatic pressure. (A) The distribution of⑀zzon the cell and substrate for a 5 Pa hydrostatic pressure. Black triangles indicate where
the substrate was fully constrained. Cellular strains are maximal in the nuclear area. One grid division is 2m in length. (B) The evolution of maximum, average, and median vertical strains as a function of pressure. These evolutions are averaged over 10 cells. (C) The evolution of cellular strains (⑀zz) with increasing Young’s
modulus for a pressure of 5 Pa in one cell. (D) The effect of the Poisson ratio on cellular strains (⑀zz) for a pressure of 5 Pa in one cell.
FIGURE 4 The effect of fluid shear. (A) The shear stress resultant in the z-direction (z) for a nominal 5 Pa shear stress on a flat substrate. The shear stresses
are tensile and lower upstream and higher downstream. The imposed parabolic flow profile is shown at the entry and the boundary conditions are indicated on the graph. (B) The vertical strain distribution (⑀zz) for a cell submitted to fluid shear stresses. Black triangles indicate where the substrate was fully constrained.
The cellular strains are maximal downstream from the cell apex and in the cellular region. In A and B, the arrow indicates the direction of flow. (C) The maximal, average, and median vertical cellular strains elicited by commonly used values of shear stress averaged over 10 cells. (D) The evolution of cellular strain (⑀zz) with
Young’s modulus for a shear stress of 5 Pa in one cell. The experimental data were fitted with a power-law (r2⬎0.99). (E) The effect of cell height on cellular
Finite element modeling: physical model and boundary conditions
All materials were assumed to be linear elastic and isotropic. The Poisson ratio was assumed to be 0.3. The model was fully constrained on the bottom surface and the shear stresses derived from the CFD calculation were multiplied by the surface normals and imposed onto the surface nodes (Fig. 4 B).
Variation of the physical parameters
To assess the effect of the cinematic viscosityon the cellular strains, its value was varied between 5⫻10⫺4and 4⫻10⫺3N䡠s䡠m⫺2while keeping
all other parameters constant. The effect of cell height on cellular strain was assessed by varying it between 50 and 200% of the original height, all other parameters being constant. Finally, the influence of the cellular Poisson ratio was evaluated by varying it, for the whole mesh, between 0.2 and 0.5 while keeping the other variables constant. These analyses were only performed for one cell model, as the other cell models would show identical trends.
Numerical modeling for micromanipulation
models
Micromanipulation techniques apply mechanical stimuli only to small areas of the cell inducing large local strains. Therefore, finer meshes are needed to calculate the strain distributions with reasonable accuracy. Mod-eling the whole cell with a suitable mesh refinement would be unpractical, as the memory space and calculation time needed become inordinate.
Based on our experience in modeling cellular indentation by a spherical AFM tip (Charras et al., 2001), we decided to model only a small volume of the cell and assume that the material was isotropic and linear elastic. The Young’s modulus was chosen to be 1 kPa, the lower value for cellular material properties, hence giving an upper bound of the cellular strains. The Poisson ratio was chosen to be 0.3 (Maniotis et al., 1997).
Magnetic microbead pulling
In magnetic microbead pulling experiments, ferromagnetic beads coated with collagen are sprinkled over a cell layer and left to settle for 30 min. The collagen-coated beads bind to the cells via integrin cell adhesion receptors and the cells are washed several times to remove unbound beads. During the experiment a magnetic field is applied to the cells and the microbeads are displaced vertically, pulling the cell with a force of 4 pN over the area of contact (Glogauer and Ferrier, 1998).
To determine the area of contact of the magnetic microbeads with the cell surface, we assumed that when the microbeads contact the cells they indent the cellular material with a force Fwequal to their weight minus the
buoyancy force, thus creating an indentation of radius a (Johnson, 1985).
F
w⫽
共
Fe3O4⫺
H2O兲
䡠
4 3
R
3
䡠
g
(7)
a
⫽
冉
3
4
F
wR
共
1
⫺
2兲
E
冊
1/3
(8)
With R the bead radius,the Poisson ratio, E the elastic modulus, g the universal gravitational constant (9.81 kg䡠m䡠s⫺2),
Fe3O4the volumic mass
of magnetite (4897 kg䡠m⫺3), and
H2Othe volumic mass of water (10 3
kg䡠m⫺3). The radius of the beads was chosen to be 2m (Glogauer and
Ferrier, 1998) yielding a radius of contact of 0.12m.
Taking the symmetries of the problem into account, only one-quarter of the space was modeled (Fig. 5 A). A box 2 m long in the x- and y-directions and 3m thick was meshed with 20-noded parametric volu-mic elements with a higher density in the area of contact (shown in green in Fig. 5 A), and particularly at the boundary between the tethered and untethered region. The model was constrained in displacement in the z-direction at its base and in the x- and directions, respectively, on the y-and x-sides in which the pulling was applied (Fig. 5 A). The other sides were left free. To simulate magnetic pulling, a uniform force was applied to the top surface nodes in the area of contact. The area of contact was constrained in the x- and y-directions to simulate integrin linkages between the cell surface and the bead. The experimentally controllable parameters are the force applied (through the magnetic field), and the radius of the microbeads.
The importance of the Poisson ratio was investigated by varying it, for the whole mesh, between 0.2 and 0.5, recalculating the radius of indenta-tion accordingly and solving for the strain distribuindenta-tion with the new Poisson ratio with E⫽1 kPa and F⫽4 pN. The total force applied to the bead was varied between 2 and 20 pN, and the cellular strains resulting were calculated with E⫽1 kPa and⫽0.3.
Microbead twisting
During microbead twisting experiments the ferromagnetic beads are teth-ered to the cells following a similar protocol as for microbead pulling, but are coated with RGD, an integrin receptor agonist (Wang and Ingber, 1994). The beads are then magnetized using a large magnetic pulse and a much smaller magnetic field is used to make them rotate and apply a torque onto the cell cytoskeleton via integrin receptors (Wang and Ingber, 1994). The area of contact of the beads with the cell surface was calculated as for magnetic bead pulling. The problem only has one plane of symmetry and accordingly, we modeled one half-space (Fig. 6 A). A 4m⫻2m box in the x- and y-directions and 3m thick was meshed with 20-noded parametric volumic elements with a higher density in the area of contact (shown in green in Fig. 6 A) and particularly at the boundary between the region in contact and the free region. The model was constrained in displacement in the z-direction at its base, in the y-direction on the plane of symmetry, and in the x- and y-directions, respectively, on the y- and x-sides on the other vertical surfaces (Fig. 6 A). To simulate the magnetic twisting, the nodes on the surface of contact were rotated by an angle␣around the y axis of the contact disk. The force and pressure applied could be calculated by extracting the resultant of this imposed displacement. The area of contact was constrained in the x- and y-directions to simulate integrin linkages between the cell surface and the bead. The read-out variable for these experiments is the angle of rotation and the control is effected via the pressure applied. Wang and Ingber (1994) report a maxi-mal pressure of 4 Pa applied on the area of contact.
The importance of the Poisson ratio was investigated by varying it, for the whole mesh, between 0.2 and 0.5, recalculating the radius of
indenta-FIGURE 5 The effect of microbead pulling. (A) The cellular deformation amplified fourfold resulting from microbead pulling for a 4 pN force. The microbead is tethered on the top surface in the region in green. The red arrow indicates the direction of bead movement. Black triangles indicate where the substrate was fully constrained. The balls indicate a sliding boundary condition. (B) The radial strain distribution (⑀rr) on the top surface resulting from
microbead pulling. High tensile strains are present on the borders of the tethered region. (C) The evolution of cellular strains as a function of cellular elasticity for a force of 4 pN. The results were fit with a power-law (r2⬎0.95 except “⑀
rrmin”). (D) The evolution of cellular strains with the Poisson
FIGURE 6 The effect of microbead twisting. (A) The cellular deformation amplified twofold resulting from microbead twisting for a 4 Pa pressure. The microbead is tethered on the top surface in the region in green. The red arrows indicate the movement of the borders of the tethered region. Black triangles indicate where the substrate was fully constrained. The balls indicate a sliding boundary condition. (B) The strain distributions (⑀xx) resulting from
microbead twisting. High tensile strains are present on either side of the tethered region. (C) The evolution of cellular strains with the angle of twist. (D) The evolution of cellular strains with the Poisson ratio for a pressure of 4 Pa. (E) The angle of twist as a function of the cellular Young’s modulus for a pressure of 4 Pa. The experimental results were fit with a power-law (r2⬎0.99). (F) The evolution of cellular strains as a function of cellular elasticity.
The results were fit with a power-law (r2⬎0.95).
tion accordingly and solving for the strain distribution with the new Poisson ratio with E⫽1 kPa and p⫽4 Pa. The rotation applied to the bead was varied between 5° and 40°, and the resulting cellular strains were calculated with E⫽1 kPa and⫽0.3. The effect of the radius of contact was assessed by varying it between 0.1 and 0.6m with p⫽4 Pa, E⫽1 kPa, and⫽0.3.
Micropipette poking
Micropipette poking consists of lightly indenting the cell surface with a blunt micropipette. We assumed that this was similar to indenting the cell surface with a rigid spherical indentor with a radius of 1.5–3m.
This experiment was modeled similarly to cellular indentation by a glass sphere using AFM (Charras et al., 2001). Taking the symmetries of the problem into account, only one-quarter of the space was modeled. A box 15m in length in the x- and y-directions and 4m thick was meshed with 20-noded parametric volumic elements, with a higher density of elements in the area of indentation and particularly at the boundary between the indented (shown in green in Fig. 7 A) and the free regions. The model was constrained in displacement in the z-direction at its base and in the x- and y-directions, respectively, on the y- and x-sides in which the indentation was performed (Fig. 7 A). The other sides were left free. The cellular material was assumed to be linear elastic and isotropic. As the main control in this system is the depth of indentation␦, we used this as an input parameter in our calculations rather than applied force.
The importance of the Poisson ratio was investigated by varying it, for the whole mesh, between 0.2 and 0.5, recalculating the radius of indenta-tion accordingly and solving for the strain distribuindenta-tion with the new Poisson ratio with E⫽1 kPa,␦⫽1m, and R⫽3m. The depth of indentation was varied between 0.5 and 1.5m and the cellular strains resulting calculated with E⫽1 kPa,⫽0.3, and R⫽3m. The radius of the pipette was varied between 1 and 3m with E⫽1 kPa,⫽0.3, and␦⫽0.5m.
Sensitivity of mechano-detection mechanisms
To investigate the sensitivity of the different mechano-detection mecha-nisms, we predicted the cellular strains used in mechanical stimulation studies by our and other groups, in which the detection mechanism was examined (Table 5). The strains were calculated as previously described assuming that all cell types have similar elasticities (reviewed in Lehenkari et al., 1999) and using E⫽1 kPa for the micromanipulation studies.
Adaptation to mechanical strain
To examine the efficiency of increasing cellular elasticity to adapt to sustained mechanical strain, we changed the cellular material properties and examined the effect on cellular strain distributions. For whole cells, the material properties were increased by a given percentage. For the micro-manipulation models of microbead pulling and twisting the elasticity was varied between 0.5 and 10 kPa. The effects of cellular elasticity on strain distributions due to micropipette poking were not assessed, as this tech-nique offers no control over the force applied. However, a comparable study has been performed for AFM-indentation with spherical tips in Charras et al. (2001).
Cellular strain resulting from stray fluid flow
Based on results from studies by Schaffer et al. (1994) giving the substrate strains in a variety of stretching systems and Brown et al. (1998) giving the stresses resulting from stray fluid flow in those systems, we compared the cellular strains due to the intended stimulation (stretch) and those due to the unintended stimulation (fluid flow) using our FEM and CFD results. The
fluid shear stresses induced by the three systems studied were two orders of magnitude lower than those commonly used to mechanically stimulate cells (2–5 Pa), and hence we ignored them. However, the fluid normal stresses reached significant magnitudes (up to 75 Pa). As cells are very close to being a flat surface, we approximated the normal stresses due to fluid flow by a hydrostatic pressure of similar magnitude.
Statistics and curve-fitting
Average, maximal, and median strains were compared with a Student’s t-test and the results were deemed significant for p⬍0.05. All curve-fitting was performed using Kaleidagraph (Synergy Software, Reading, PA) on a PC.
RESULTS
Experimentally measured material properties
of osteoblasts
Topography and material properties (Fig. 1, B and D) were
acquired using AFM. The cell was clearly identifiable as a
softer area on a hard substrate (Fig. 1 D). The cellular
elasticities varied between 1 kPa in the nuclear area and 100
kPa in the cytoplasmic skirt, and did not correlate with cell
height (Fig. 1, B and D). Stress fibers could clearly be seen
as “stiffer lines” spanning the cell from side to side (Fig. 1
D); these correlate with features in the AFM phase image
(Fig. 1 C) and show a distribution similar to actin stress
bundles identified with rhodamine-phalloidin staining (Fig.
1 A). The cellular elasticity frequency distribution for the 10
cells used fitted a Gaussian curve centered on 14 kPa (Fig.
1 E). Finite element models of the cells were created (for
example, in Fig. 1 F from data in Fig. 1, B and D).
Strain distributions and magnitudes
Whole-cell models
Substrate stretch produced maximal strains along the axis of
stretch. The strain distributions were very homogenous
along the x axis with average and median absolute strains of
1030
⑀
, and maximal absolute strains of 1270
⑀
(Table
1). Strains in the y- and z-directions were significantly lower
than in the x-direction. Most of the cellular strains were
close to the imposed stretch and higher strains were situated
in the vicinity of stress fibers (Fig. 2 A). The evolution of
maximum, median, and average absolute strains (averaged
over 10 cells) could be predicted for commonly used values
of substrate stretch (Fig. 2 B).
av-FIGURE 7 The effect of micropipette poking. (A) The cellular deformation amplified twofold resulting from micropipette poking for a 0.5m indentation. The micropipette is in contact with the top surface in the region in green. The red arrow indicates the direction of force application. Black triangles indicate where the substrate was fully constrained. The balls indicate a sliding boundary condition. (B) The radial strain distribution (⑀rr) resulting from micropipette poking. High
tensile strains are present on the border of the indented region. (C) The vertical strain distribution (⑀zz) resulting from micropipette poking. High compressive strains
are present under the area of indentation. (D) The evolution of cellular strains as a function indentation depth for a pipette radius of 3m. (E) The evolution of cellular strains with the Poisson ratio for a pipette radius of 3m. (F) The evolution of cellular strains with pipette radius.
erage absolute strains (averaged over 10 cells) could be
predicted for physiologically relevant pressures (Fig. 3 B).
Values for higher hydrostatic pressures used in some setups
can be extrapolated from the graph (Fig. 3 B). A pressure of
1 kPa would apply maximal vertical strains (
⑀
zz) of up to
14% and average vertical strains of 3.7%.
Fluid shear produced maximal strains in the vertical
direction (Table 1). Maximal strains were 10-fold higher
than average or median strains, pointing to a heterogeneous
strain distribution (Table 1 and Fig. 4 B). The vertical fluid
shear stresses (
z, Fig. 4 A) were lower upstream, where
pressure build-up counters the traction force due to shear
stresses, and larger downstream, where shear stresses and
pressure have additive effects. The vertical cellular strains
(Fig. 4 B) were tensile and maximal downstream from the
cell apex, in areas with a low elastic modulus that coincided
with the location of the nucleus. Maximal, average, and
median strains (averaged over 10 cells) could be calculated
for commonly used values of shear stress (Fig. 4 C).
The maximal strains exerted by the three modes of
stim-ulation were close to one another with a 0.1% stretch
producing maximal absolute strains of 1270
⑀
, a 5 Pa
hydrostatic pressure producing maximal absolute strains of
700
⑀
, and a 5 Pa shear stress producing maximal absolute
strains of 1080
⑀
(Table 1). Fluid flow and hydrostatic
pressure exerted significantly different maximum and
me-dian vertical strains (p
⫽
0.04 and p
⫽
0.01), but not
average vertical strains (p
⫽
0.70). Maximal absolute
ver-tical strains due to fluid flow were significantly lower than
the maximal absolute horizontal strains produced by
sub-strate stretch (p
⬍
0.001).
Micromanipulation models
For commonly used values of the stimuli and an elasticity of
1 kPa, the micromanipulation techniques applied strains in
excess of 5%, which was on average one order of magnitude
higher than those applied by whole-cell techniques (Tables
1 and 2). The radial strain distribution (
⑀
rr) for microbead
pulling (Fig. 5 B) showed the presence of high tensile and
short-range surface strains at the border between the
region tethered to the bead and the free region (Fig. 5 A).
The cellular strains increased linearly with applied force
(Fig. 5 E). The maximal vertical strains were the largest
strain component, followed by the maximal radial strains
(Fig. 5 E).
The horizontal strain distribution (
⑀
xx) for microbead
twisting (Fig. 6 B) showed the presence of high tensile
strains on the surface on either side of the border between
the region where the bead is bound to the cell and the free
region (Fig. 6 A). The cellular strains increased
quasi-linearly with increasing angular motion (Fig. 6 C). Maximal
and minimal values for each strain component were of
similar magnitude (Fig. 6 C). The bead radius, and hence the
TABLE 1 Strain magnitudes resulting from whole-cell mechanical stimulation
Stimulation
Average (abs(xx))
(in)
Average (abs(yy))
(in)
Average (abs(zz))
(in)
Stretch (0.1%) 1030⫾1.1 300⫾1.1 308⫾0.95
Hydrostatic pressure (5 Pa) 2.20⫾0.69 2.14⫾0.84 187⫾45
Fluid flow (5 Pa) 2.19⫾0.9 1.59⫾0.6 199⫾78
Median (abs(xx)) Median (abs(yy)) Median (abs(zz))
Stretch (0.1%) 1030⫾23 307⫾7.5 309⫾9.2
Hydrostatic pressure (5 Pa) 0.002⫾0.001 0.002⫾0.001 164⫾63
Fluid flow (5 Pa) 0.001⫾0.001 0.001⫾0.0006 92⫾38.2
Max (abs(xx)) Max (abs(yy)) Max (abs(zz))
Stretch (0.1%) 1270⫾26 366⫾19 373⫾16
Hydrostatic pressure (5 Pa) 44.3⫾15 39.2⫾20 699⫾140
Fluid flow (5 Pa) 48.9⫾23.4 35.7⫾19.4 1080⫾48
All values were averaged over the 10 cell models. Average, median, and maximum absolute strains are given for the diagonal elements of the strain tensor.
TABLE 2 Strain magnitudes resulting from micromanipulation
Stimulation Method
rr/xx tt/yy zz
min (%) max (%) min (%) max (%) min (%) max (%)
Micropipette poking, R⫽3m,␦⫽0.5m ⫺7.5 8.7 ⫺8.8 5.0 ⫺24 0.94
Bead pulling, E⫽1 kPa, F⫽4 pN ⫺1.0 2.1 ⫺0.74 0.6 ⫺0.19 5.7
Bead twisting, E⫽1 kPa, p⫽4 Pa ⫺1.5 1.4 ⫺0.54 0.58 ⫺7.3 7.3
The parameters pertaining to each study are given in the table.rrandttare given for micropipette poking and microbead pulling, whereasxxandyy
radius of indentation, only had a marginal effect on cellular
strains (data not shown).
The radial strain distribution (
⑀
rr) (Fig. 7 B) for
micropi-pette poking showed a large tensile component on the
surface at the border between the indented and free region
(Fig. 7 A). The vertical strain distribution (
⑀
zz) (Fig. 7 C)
showed a large compressive component under the indented
region. The cellular strains varied linearly with indentation
depth (Fig. 7 D).
Effect of material property changes
Whole-cell models
When substrate stretch was applied, a twofold increase in
the cellular elasticities had no influence on the strains
ex-erted on the cell (change
⬍
0.1%, Fig. 2 D). However, when
the cellular elasticities were increased twofold and
hydro-static pressure or fluid shear were applied, the cellular
strains were reduced by 50 and 33%, respectively (Figs. 3 C
and 4 D).
Micromanipulation models
For microbead pulling and twisting, all components of
cel-lular strain decreased dramatically with increasing elasticity
(Figs. 5 C and 6 F, respectively) for a fixed stimulus. These
decreases fitted well with a power-law (r
2⬎
0.95 except
“
⑀
zzmin” for microbead pulling).
In microbead pulling experiments the vertical
displace-ment of the bead for a force of 4 pN decreased from 21 nm
for E
⫽
0.5 kPa to 2.8 nm for E
⫽
10 kPa. The vertical
displacement as a function of elasticity fitted well with a
power-law (r
2⫽
0.99, Fig. 6 F).
During microbead twisting, the angular rotation of the
bead for a pressure of 4 Pa decreased from 12° for E
⫽
0.5
kPa to 1.5° for E
⫽
10 kPa. The angular motion as a
function of elasticity fitted well with a power-law (r
2⫽
0.99, Fig. 5 E).
Effect of Poisson ratio changes
Whole-cell models
When substrate stretch was applied, the Poisson ratio had
little effect on average or median strains.
⑀
xxwas reduced by
only 15% when
was changed from 0.2 to 0.5 (Fig. 2 E).
However, in models of hydrostatic pressure (Fig. 3 D) or
fluid shear (similar evolution to Fig. 3 D, data not shown),
the Poisson ratio was an important factor and it reduced the
maximal, median, and average maximal strains by 93%
when it was varied from 0.2 to 0.5. This is due to the
predominantly compressive nature of these mechanical
stimulations.
Micromanipulation models
The Poisson ratio had little influence on the order of
mag-nitude in microbead pulling experiments (Fig. 5 D). The
maximal radial and tangential strain decreased by 85%
when
was varied between 0.2 and 0.5. The two largest
strain components in absolute value “
⑀
zzmax” and “
⑀
rrmin”
varied by
⫺
56% and
⫹
74%, respectively, when
was
changed from 0.2 to 0.5.
The magnitude of strains elicited by micropipette poking
was not very sensitive to changes in Poisson ratio (Fig. 7 E).
The maximal radial strains (
⑀
rr) were reduced by a
maxi-mum of 40% and the maximal tangential strains (
⑀
tt) by 94%
when
was varied from 0.2 to 0.5. In microbead twisting
experiments (Fig. 6 D), the Poisson ratio had a dramatic
influence around
⫽
0.4 where all components of strain
were amplified to an order of magnitude above their value
for other values of
.
Effect of the direction of application of stimulus
In substrate stretch models, the stretch direction had no
effect on the maximal strain (
⑀
11along the direction of
stretch) introducing only a 7% variation in its magnitude
(Fig. 2 C). In fluid shear models, rotating the direction of
flow by 90° increased the maximal vertical strain (
⑀
zz) by
12% and reduced the average and median vertical strains by
5 and 8%, respectively (data not shown).
Effect of fluid flow parameters
The cellular strains varied linearly with the value of the
cinematic viscosity
(Fig. 4 E). Increasing cell height by
100% increased the maximal strains by only 7% (Fig. 4 F).
Osteocytes
Osteocytes embedded in a block of matrix compressed by
0.1% (1000
⑀) were submitted to maximal vertical strains
(⑀
zz) of up to 1% (10,000
⑀, Table 3). Hence, cellular
strains were amplified 10-fold compared to matrix strains.
Average and median vertical strains were 2-fold larger than
cellular strains in the direction of stretch (⑀
xx).
Cellular strain elicited by stray fluid flow
The cellular strains elicited by stray fluid flow induced
additional average cellular strains of up to 2810
⑀
(0.28%)
and maximal cellular strains of up to 10,500
⑀
(1.05%),
which represented respectively 13% and 39% of the strains
induced by substrate stretch (Flexercell system, Table 4).
The MIT system induced average additional strains of 4%
and maximal strains of 14% of the value imposed by
sub-strate stretch. The fluid flow-induced strains reached 1420
⑀
(0.14%) on average and a maximum of 5310
⑀
(0.53%)
in the Providence system.
DISCUSSION
In this paper we combine AFM measurements of elasticities
and profiles of live osteoblasts with CFD and FEM to
predict, for the first time, the cellular strain distributions
resulting from common whole-cell stimulation methods,
such as substrate stretch, intermittent hydrostatic pressure
application, or fluid shear. In addition, we give the strain
distributions resulting from mechanical stimulation by
cromanipulation techniques, such as microbead pulling,
mi-crobead twisting, or micropipette poking. In all cases we
examined the effect of the relevant mechanical parameters
on the strain distributions, and provide the magnitudes of
cellular strains for commonly used values of the control
parameters for each of the experimental conditions. We
have examined, for each experimental condition, whether
increasing cellular material properties may be a good
strat-egy for adapting to sustained mechanical strain, by
assess-ing the impact of this modification upon the cellular strain
distributions. By combining our modeling data with
exper-imental data from other groups (Table 5), we examine the
magnitudes of strains needed to activate different strain
detection mechanisms. We also underline the necessity to
design new substrate stretching devices that reduce stray
fluid flow. We believe that this work will help further our
understanding of cellular detection of, and adaptation to,
mechanical strain.
Cellular strain detection mechanisms
Cells can detect strains through a variety of mechanisms
that, as a first step, involve stretch-activated cation
chan-nels, integrin transmembrane receptors, G-proteins, or
ty-rosine kinases (Sachs and Morris, 1998; Gudi et al., 1998;
Banes et al., 1995; Malek and Izumo, 1996). The threshold
strain of activation and the strain component to which
they are sensitive may be different. We examined
exper-iments performed by other groups investigating the
mechanisms involved in the detection of mechanical
stimulation and calculated the strain distributions that
they applied (Table 5).
All of the micromanipulation techniques had both a high
radial tensile component (
⬎
1%) on the cell surface (Figs. 5
B, 6 B, 7 B), compatible with a membrane stretch detection
mechanism (Table 5). The large vertical component (
⬎
5%)
(tensile for microbead pulling, mixed for microbead
twist-ing, and compressive for micropipette prodding; Fig. 7 C)
could be detected by cytoskeleton-based mechanisms, such
as via tyrosine kinases (Glogauer et al., 1997; Chen et al.,
2001). Furthermore, most groups report inhibition of
cellu-lar reactions when exposed to stretch-activated channel
blocking agents, Gd
3⫹(Sachs and Morris, 1998), or
Gram-mostola spatulata venom (Suchyna et al., 2000). However,
the possibility that the high levels of strain applied by these
techniques over very small areas induce cell damage or
membrane rupture should not be excluded, especially in the
case of micropipette prodding.
Detection of mechanical stimuli in cells subjected to
intermittent hydrostatic pressure have been reported to
in-volve stretch-activated channels and integrins (Lee et al.,
2000). The magnitude of the in-plane strains resulting from
hydrostatic pressure was similar to that resulting from
mi-cromanipulation techniques, and hence the detection may be
mediated by stretch-activated channels.
Reported detection mechanisms for substrate stretch
are varied and are thought to involve stretch-activated
channels, tyrosine kinases, integrins, and the
cytoskele-TABLE 3 Strain magnitudes in an osteocyte embedded in the bone matrix
Osteocyte abs(xx) () abs(yy) () abs(zz) ()
Average 1100 300 2000
Median 1000 300 2000
Maximum 2400 800 10,000
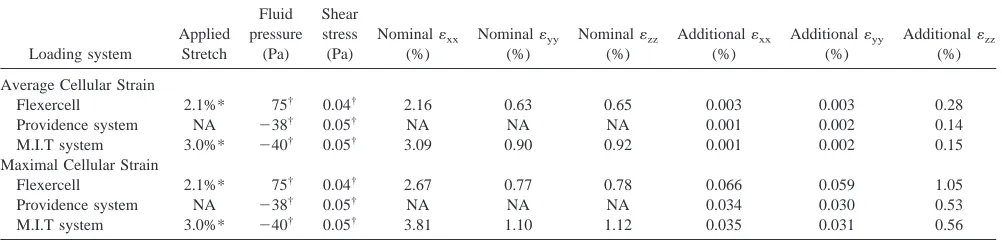
TABLE 4 Additional cellular strains induced by stray fluid flow in experimental substrate stretch systems
Loading system Applied Stretch Fluid pressure (Pa) Shear stress (Pa)
Nominalxx
(%)
Nominalyy
(%)
Nominalzz
(%)
Additionalxx
(%)
Additionalyy
(%)
Additionalzz
(%)
Average Cellular Strain
Flexercell 2.1%* 75† 0.04† 2.16 0.63 0.65 0.003 0.003 0.28
Providence system NA ⫺38† 0.05† NA NA NA 0.001 0.002 0.14
M.I.T system 3.0%* ⫺40† 0.05† 3.09 0.90 0.92 0.001 0.002 0.15
Maximal Cellular Strain
Flexercell 2.1%* 75† 0.04† 2.67 0.77 0.78 0.066 0.059 1.05
Providence system NA ⫺38† 0.05† NA NA NA 0.034 0.030 0.53
M.I.T system 3.0%* ⫺40† 0.05† 3.81 1.10 1.12 0.035 0.031 0.56
The nominal strains result from substrate stretch. The additional strains result from stray fluid flow. *From Schaffer et al. (1994).
ton (Table 5). FE models revealed that the cells were
subjected to strains close to those imposed on the
sub-strate (in agreement with experimental data by Caille et
al., 1998) and, for the experiments reported in Table 5
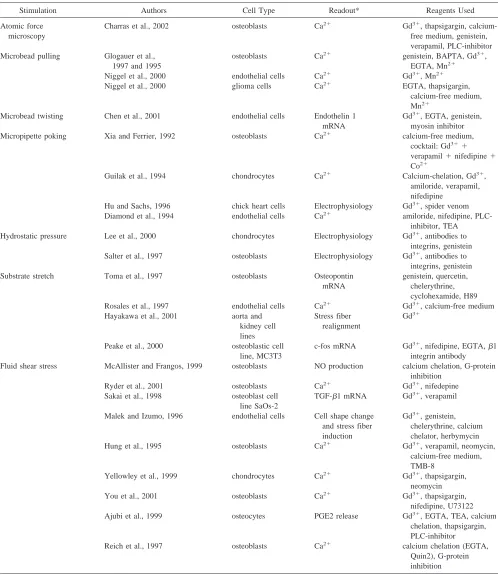
TABLE 5 Pathway for detection of mechanical strain and strain magnitudes applied
Stimulation Authors Cell Type Readout* Reagents Used
Atomic force microscopy
Charras et al., 2002 osteoblasts Ca2⫹ Gd3⫹, thapsigargin,
calcium-free medium, genistein, verapamil, PLC-inhibitor Microbead pulling Glogauer et al.,
1997 and 1995
osteoblasts Ca2⫹ genistein, BAPTA, Gd3⫹,
EGTA, Mn2⫹
Niggel et al., 2000 endothelial cells Ca2⫹ Gd3⫹, Mn2⫹
Niggel et al., 2000 glioma cells Ca2⫹ EGTA, thapsigargin,
calcium-free medium, Mn2⫹
Microbead twisting Chen et al., 2001 endothelial cells Endothelin 1 mRNA
Gd3⫹, EGTA, genistein,
myosin inhibitor Micropipette poking Xia and Ferrier, 1992 osteoblasts Ca2⫹ calcium-free medium,
cocktail: Gd3⫹⫹
verapamil⫹nifedipine⫹ Co2⫹
Guilak et al., 1994 chondrocytes Ca2⫹ Calcium-chelation, Gd3⫹,
amiloride, verapamil, nifedipine
Hu and Sachs, 1996 chick heart cells Electrophysiology Gd3⫹, spider venom
Diamond et al., 1994 endothelial cells Ca2⫹ amiloride, nifedipine,
PLC-inhibitor, TEA Hydrostatic pressure Lee et al., 2000 chondrocytes Electrophysiology Gd3⫹, antibodies to
integrins, genistein Salter et al., 1997 osteoblasts Electrophysiology Gd3⫹, antibodies to
integrins, genistein Substrate stretch Toma et al., 1997 osteoblasts Osteopontin
mRNA
genistein, quercetin, chelerythrine, cyclohexamide, H89 Rosales et al., 1997 endothelial cells Ca2⫹ Gd3⫹, calcium-free medium
Hayakawa et al., 2001 aorta and kidney cell lines
Stress fiber realignment
Gd3⫹
Peake et al., 2000 osteoblastic cell line, MC3T3
c-fos mRNA Gd3⫹, nifedipine, EGTA,1
integrin antibody Fluid shear stress McAllister and Frangos, 1999 osteoblasts NO production calcium chelation, G-protein
inhibition Ryder et al., 2001 osteoblasts Ca2⫹ Gd3⫹, nifedepine
Sakai et al., 1998 osteoblast cell line SaOs-2
TGF-1 mRNA Gd3⫹, verapamil
Malek and Izumo, 1996 endothelial cells Cell shape change and stress fiber induction
Gd3⫹, genistein,
chelerythrine, calcium chelator, herbymycin Hung et al., 1995 osteoblasts Ca2⫹ Gd3⫹, verapamil, neomycin,
calcium-free medium, TMB-8
Yellowley et al., 1999 chondrocytes Ca2⫹ Gd3⫹, thapsigargin,
neomycin You et al., 2001 osteoblasts Ca2⫹ Gd3⫹, thapsigargin,
nifedipine, U73122 Ajubi et al., 1999 osteocytes PGE2 release Gd3⫹, EGTA, TEA, calcium
chelation, thapsigargin, PLC-inhibitor Reich et al., 1997 osteoblasts Ca2⫹ calcium chelation (EGTA,
Quin2), G-protein inhibition *Readout gives the parameter on which the effects of inhibitors is tested.
†Abbreviations: SAC, stretch activated channels; TK, tyrosine kinases; PLC, phospholipase C; IP3, inositol-1,4,5-triphosphate; PKA, protein kinase A;
VACC, voltage activated calcium channel; PGE2, prostaglandin E2; NO, nitric oxide.
(except Peake et al., 2000), the strain magnitude was
similar to that detected by stretch-activated channels or
tyrosine kinases in micromanipulation experiments.
Fur-thermore, recent studies point toward the detection of
substrate stretch through mechano-sensitive channels
ac-tivated by intercellular tension applied through
adherens-junctions (Ko et al., 2001). In contrast, some experiments
report effects of substrate stretch on osteoblasts for low
Intracellular pathway† Stimulus Subtype Max(xx/rr) Max(yy/tt) Max(zz)SAC and IP3 F⬎10 nN 3% 3% 9%
SAC and TK F⫽4 pN 2% 0.60% 5.00%
SAC F⫽4 pN 2% 0.60% 5.00%
IP3, SAC 2% 0.60% 5.00%
SAC, TK and cytoskeletal tension
p⫽2 Pa 0.70% 0.25% 3.60%
SAC and VACCs NA ⬎8% ⬎8% ⬎24%
SAC ␦⫽1–2 um 21% 12% 47%
SAC ␦⫽3.8 um rounded cell ⬎21% ⬎12% ⬎47%
PLC NA ⬎8% ⬎8% ⬎24%
SAC and integrins p⫽13 kPa intermittent 11% 10% 182%
SAC and integrins p⫽13 kPa intermittent 11% 10% 182%
TK, PKA, cytoskeleton xx⫽1.3% uniform biaxial, flexercell 1.30% 1.30% ?
SAC and IP3 xx⫽10% uniform biaxial, flexercell 10% ? ?
SAC and cytoskeleton xx⫽20% uniaxial 20%
SAC, VACCs and integrins
xx⫽0.1% 4 point bending 0.10%
G-protein and extracellular Ca
⫽2.6 Pa steady 25 18 520
SAC and VACCs ⫽2.5 Pa steady 24 17 500
SAC and VACCs ⫽2 Pa steady 19 13 400
TK, PLC ⫽2 Pa steady 19 13 400
SAC and PLC ⫽3.5 Pa steady 34 24 700
PLC and G-protein ⫽2 Pa oscillatory 19 13 400
IP3 and VACCs ⫽2 Pa oscillatory 19 13 400
SAC, VACCs and PLC ⫽0.7⫾0.3 pulsating 9.6 6.8 200
G-proteins, extracellular calcium