or head) for measuring the motion of these segments during quite stance (Liu, Zhang, & Lockhart, 2012). Even though IMUs are already being used experimen-tally for measuring movements of the head and trunk, no studies have been found which would use IMUs to measure and evaluate the behavior of the segments of the appendicular skeleton during quiet stance. Spon-taneous movements of the extremity in rest or during postural activity called physiological tremor (PT) can be measured by IMUs. It is apparent, that measuring segments of the appendicular skeleton may contribute to the indication of condition of musculoskeletal or nervous system. Physiological tremor is not apparent to the naked eye and does not interfere with the activities of daily life. On the other hand, enhanced physiologi-cal tremor can disturb voluntary movements and has to be distinguished from essential, metabolic tremor or tremor due to the Parkinson’s disease. Clinical and
Introduction
Movements of body segments during stance tasks can indicate the condition of the musculoskeletal or nerv-ous system (e.g., Duclos, Nadeau, & Lecours, 2008). Romberg’s test has become standard in the evalua-tion of spontaneous movements during quiet standing (Khasnis & Gokula, 2003). Recently, also less expen-sive inertial measurement units (IMU), which repre-sent electronic devices based on the accelerometers and gyroscopes, were used for high-accuracy measure-ment of human body segmeasure-ments during quiet stance, instead of commonly used posturography platforms (Mancini et al., 2012). In the past, sensing units were placed on segments of the axial skeleton (i.e. trunk
* Address for correspondence: Petr Volf, Department of Bio-medical Technology, Faculty of BioBio-medical Engineering, Czech Technical University in Prague, nám. Sítná 3105, 272 01 Klad-no, Czech Republic. E-mail: [email protected]
The application of accelerometers to measure movements of upper limbs: Pilot study
Patrik Kutilek
1,2, Petr Volf
1,*, Rudolf Cerny
3, and Jan Hejda
11Faculty of Biomedical Engineering, Czech Technical University in Prague, Kladno, Czech Republic; 2General
Univer-sity Hospital – 1st Faculty of Medicine, Charles University in Prague, Prague, Czech Republic; and 3University Hospital
Motol – 2nd Faculty of Medicine, Charles University in Prague, Prague, Czech Republic
Copyright: © 2017 P. Kutilek et al. This is an open access article licensed under the Creative Commons Attribution License (http://creativecommons.org/licenses/by/4.0/).
Background: Even though inertial measurement units (IMU) are already being used experimentally for evaluating movements of segment of the axial skeleton, no studies have been found which have used IMUs to measure the behavior of the segments of upper limbs during quiet stance. Objective: The objective is to design a suitable applica-tion of IMUs to measure movements of the upper extremities in Romberg’s test and analyze spontaneous arm move-ments. Second aim is to identify possible discrepancies between the dominant and non-dominant arm movemove-ments.
Methods: The dominant and non-dominant upper limb of each participant was identified. Then, the movements of both upper limbs were measured by the Xsens system equipped with MTx motion trackers during the quiet stance on a firm surface with eyes open (EO) and eyes closed (EC). The measured data was used to calculate the medians and maximums of the superior-inferior, medio-lateral and anterior-posterior acceleration. Also, tremor intensity was calculated to quantitatively evaluate the measured data. Results: The comparison of values of maximal accelerations of the dominant and non-dominant arms showed significant difference between the arms during EC conditions. The comparison of values of median accelerations of the dominant and non-dominant arms showed significant differ-ences between the acceleration of arms in medio-lateral direction during EO and EC conditions. In all cases, values of maximal and median accelerations and values of tremor intensity of the dominant limb strongly correlated with val-ues on the non-dominant limb. Conclusions: Findings suggest possible usefulness of the designed application of IMUs and evaluation methods for their use in Romberg’s test in clinical practice for evaluation of upper limb movements.
biomechanical characteristics of different tremor types are important for correct diagnose (Louis, 2005).
The first objective of this work is to design a suit-able application of inexpensive accelerometers to mea-sure movements of the upper extremities during stance tasks, design quantitative methods of data analysis and test their application on healthy subjects.
The second aim of the study is, by measuring healthy subjects, to identify discrepancies between the movements of dominant and non-dominant upper arm in anatomical axes. Thus, the research question is whether there are also measurable tremors in healthy population, and if tremors are different for the domi-nant and non-domidomi-nant upper limb.
Methods
Test procedure and participants
The set of data to test the applicability of the IMUs for measuring human arm motion during quiet stance was measured on the sample of fourteen volunteers aged 22 (SD 0.5) years; body weight 71 (SD 12) kg; height 176 (SD 8) cm were recruited from students (healthy subjects) of the Czech Technical University in Prague. The Edinburgh Handedness Inventory was used to assess the dominance of a person’s right or left upper limb (e.g. Oldfield, 1971). In the study, there was one weak left-hander (handedness 9%) and thirteen right-handers (from weak [11%] to strong handedness [100%]) among the subjects. The mean handedness score of the group was 49% (SD 31%). The diagnostic evaluation included a detailed disease history, and an informed consent was obtained from each subject. The study was performed in accordance with the Helsinki Declaration. The study protocol was approved by the local Ethics Committee of the Faculty of Biomedical Engineering of the Czech Technical University (CTU) in Prague. The subjects were chosen for measurement randomly, and on different days.
Test procedure and measurement equipment
Xbus Master (Xsens Technologies B.V., Enschede, Netherlands), a lightweight (330 g) and portable device using MTx units for orientation and accelera-tion measurement of body segments (see Figure 1), was used for measurement of dominant and non-dominant upper arm movements. An MTx unit with an embedded accelerometer and gyroscope represents an accurate IMU measuring drift-free 3-D orientation and 3-D acceleration (Kutílek, Socha, Čakrt, Schlenker, & Bizovská, 2015). The MTx unit was set up in a way that one axis of the coordinate system of the MTx unit was parallel to the anterior-posterior axis, i.e. symmetry axis
of the fixed stationary platform on which the partici-pants stood, and the other two axes were perpendicular to the anterior-posterior axis (i.e. symmetry axis of the platform) with respect to the direction of the Earth’s gravity, i.e. superior-inferior axis was co-linear with the direction of gravity. IMU collected acceleration data at a sampling rate of 50 Hz. Bias stability of the acceler-ometer is 0.02 m ⋅ s–2, full scale (standard) is ±17 m ⋅ s–2, linearity is 0.05% of full scale, scale factor stability is 0.05% and noise density is 0.001 m ⋅ s–2 ⋅ Hz–0.5. Orienta-tion performance of gyroscopes is: angular resoluOrienta-tion 0.05°, static accuracy < 0.5°, dynamic accuracy 2°.
After the adjustment, MTx units were placed on the subject’s upper extremities in compliance with studies by Rodríguez et al. (2010) and Stirling, Hesami, Ritz, Adistambha, and Naghdy (2010), and in accordance with the MoCap system manufacturer recommenda-tion. Two MTx units were placed on dorsal sides of upper arms close to centers of mass of segments with-out depriving motion of upper extremities or trunk.
The data, i.e. the three Euler angles (roll [Φ], yaw [Ψ], pitch [Θ]) (Allum, Nijhuis, & Carpenter, 2008; Aw, Halmagyi, Black, Curthoys, Yavor, & Todd, 1998; Findling et al., 2011) and three orthogonal accelera-tions (aSx, aSy, aSz) in the accelerometer coordinate sys-tem (Kennie & Petrie, 2010) were measured by a MTx unit placed on the upper arms while subjects were per-forming a quiet stance on a fixed stationary platform. Conventions of Euler angles are described in studies by Allum et al. (2008), Findling et al. (2011) and Osler and Reynolds (2012). The three accelerations mea-sured by the accelerometer of MTx unit are described
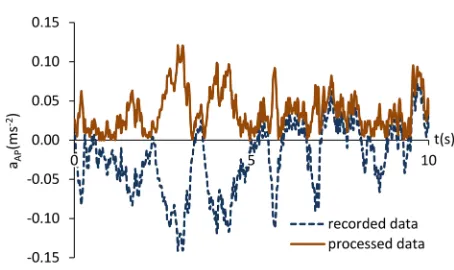
(median value of the acceleration is not zero), there-fore offset correction is used. The median value of the recorded acceleration is used to shift the baseline at the zero (i.e. the baseline constantly remains at the zero line). Although the mean value and/or median value are close to zero or are zero because of the high number of sample points, the offset correction is used in data processing. Rectification involved the transfor-mation of the signal into only positive deflections, i.e. the negative peaks were “moved up” to plus (Konrad, 2005), see Figure 2. Then, the processed signal was used to calculate the medians, (cf. Hogg & Craig, 1995), of the modified values of the superior-inferior acceleration (aSImed), medio-lateral acceleration (aMLmed) and anterior-posterior acceleration (aAPmed) in accor-dance with the study by Schubert et al. (2012), as an alternative to the calculation of the mean values of the measured data.
Also, the tremor intensity (TI) of the accelerations was used to quantitatively evaluate the measured data. Tremor intensity is the root mean square of accelera-tion recorded in the specific band (Papapetropoulos et al., 2010). We used a band of 1 to 15 Hz, same as Machowska-Majchrzak, Pierzchała, Pietraszek, and Łabuz-Roszak (2011) and Machowska-Majchrzak, Pierzchała, Pietraszek, Łabuz-Roszak, and Bartman (2012). Fast Fourier Transform (FFT) implemented in the MatLab software (Version R2010b; Math-works, Natick, MA, USA) was used to determine the distribution of the tremor in the frequency band. TI is measured in m ⋅ s–2; and larger values are indicative of more intense tremor (Papapetropoulos et al., 2010). A custom-designed MatLab program based on the func-tions of the MatLab software was used to calculate the
aAPmax, aMLmax, aSImax, aAPmed, aMLmed, aSImed, TIAP, TIML and
TISI. in detail by Altun and Barshan (2012) and Gil-Agudo
et al. (2013).
The movements of both upper arms (dominant and non-dominant) were measured by the Xsens system during the quiet stance (i.e. Romberg’s test) on a firm surface (FiS) with eyes open (EO) and eyes closed (EC) (e.g., Honegger, Van Spijker, & Allum, 2012). The subject’s bare feet were positioned next to each other, splayed at an angle of 30°, arms always in a hang-ing position. The tasks included standhang-ing on both feet for at least 60 seconds (Zadnikar & Rugelj, 2011).
Method of data processing
Three orthogonal accelerations and three Euler angles were recorded continuously during trials. This way, a set of instantaneous values were obtained by both MTx units placed on upper arms. The instantaneous values of the three Euler angles and three accelera-tions in the accelerometer coordinate system of each MTx unit were used to calculate the accelerations in the global reference system and then in the anatomical coordinate frame. The calculation is based on the rota-tional matrices. The first rotation matrix RGSi rotates an acceleration vector aSi= (aSxi aSyi aSzi)T of instantaneous (i) accelerations in the sensor co-ordinate system (S) to the global (G) reference system aGi = RGSi ⋅ aSi, where the matrix RGSi is described in detail in (Ying & Kim, 2002). The acceleration vector aGi= (aGxi aGyi aGzi)T of the instantaneous accelerations in the global reference system is then rotated to the anatomical (A) coordinate frame aAi = RAG ⋅ aGi, (Brinckmann, Frobin, & Leivseth, 2002). The second rotation matrix RAG is obtained during the calibration process of the MTx unit. The calibration method and the application of the rotation matrix are described in detail in Melecky et al. (2016). The calculated acceleration vector aAi= (aAPi aMLi aSIi)T of the instantaneous accelerations represents the supe-rior-inferior (SI) acceleration (aSIi), medio-lateral (ML) acceleration (aMLi) and anterior-posterior (AP) acceler-ation (aAPi). Acceleration is recorded continuously dur-ing measurements. For quantitative evaluation of the data, the maximal measured values of the accelerations
aAPmax = max(aAP1, … , aAPn), aMLmax = max(aML1, … , aMLn),
aSImax = max(aSI1, … , aSIn) were used in accordance with the study by Schubert, Kirchner, Schmidtbleicher, and Haas (2012). The n is the number of sample points (Kutílek et al., 2015).
Since the mean value and/or median value of the data record is not equal to zero and the signal contains both positive and negative values, the offset correction and rectification of the recorded and calculated accel-erations was used in the data record for further evalua-tion. The baseline of the data record is usually shifted away from the true zero line of recorded accelerations
Statistical analysis
After calculating the maximal measured values of accelerations and medians of measured values of accelerations, the data from the two MTx units were divided into two sets; one group included accelerations measured on the dominant upper limb, and the second group included accelerations measured on the non-dominant upper limb. Also, the data sets were divided into data subsets according to whether the subjects were standing with EO or EC. The Jarque-Bera test was used to test the normal distribution of calculated median accelerations and maximal accelerations in the data subsets. The median (Med), minimum (Min), maximum (Max), the first quartile (Q1) and the third quartile (Q3) of the accelerations were then calculated. The first quartile is defined as the middle number between the smallest number and the median of the data set. The third quartile is the middle value between the median and the highest value of the data set. These indicators are provided because of the statistical pre-sentation of the results and possible future use. Also, the Wilcoxon test was used to assess the significance of the differences between the results of measurements on the dominant and non-dominant arms; and differences between the results of measurements with EO and EC. The significance level was set at .05. In addition, effect sizes (Cohen’s d) (Cohen, 1988), which consider the difference between the two groups of data, were calcu-lated in accordance with studies by Coolican (1990) and Fritz, Morris, and Richler (2012).
Also, the Spearman’s rank correlation coefficient between the data subsets were calculated to study the relations between the data measured on the dominant upper limb and the data measured on the non-dominant
upper limb; relations between the superior-inferior accelerations, medio-lateral accelerations and anterior-posterior acceleration; and relations between the data measured on subjects with EO and EC. The statistical analysis was performed using MatLab software.
Results
Jarque-Bera test did not show normal distribution of data in most sets of data. Then, the statistical data were used to illustrate the differences between the move-ments of the dominant and non-dominant arms of subjects standing with EO and EC. The following plots (Figure 3, Figure 4 and Figure 5) display the Min, Max, Med, Q1, and Q3 for the calculated values of maximum and median accelerations.
Comparing dominant and non-dominant upper limb dur-ing quiet stance trials
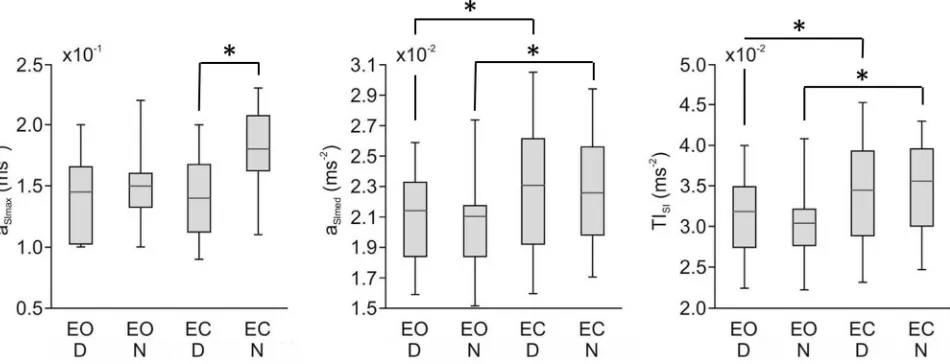
The comparison of values of maximal accelerations of the dominant and non-dominant arm found significant differences between the data measured on subjects with EC, see Table 1. The comparison of values of maximal accelerations of the same arm measured during stand-ing with EO or EC found significant differences only when measuring the non-dominant arm of subjects standing with EC, see Table 1.
The comparison of values of median accelerations of the dominant and non-dominant arm found signifi-cant differences between the data for accelerations in ML direction measured on subjects with EO and EC, see Table 1. In almost all cases, the comparison of val-ues of median accelerations of the same arm measured
during stand with EO or EC found significant differ-ences when measuring non-dominant arms of subjects standing with EC, see Table 1.
The comparison of values of tremor intensity of the dominant and non-dominant arm did not find sig-nificant differences between the data. In all cases, the comparison of values of tremor intensities of the same arm measured during standing with EO or EC found significant differences, see Table 1.
In all cases of the comparison of the groups of data, the effect sizes were moderate to large, i.e. calculated values were greater than 0.4 in all cases. The differ-ences between groups of data were identified as statisti-cally significant.
Correlation between values on the dominant and non-dominant arms
In all cases of the comparison of values of maximal accelerations of the dominant and non-dominant arm, the Spearman’s rank correlation coefficient indicates a strong correlation (a value is considered as strong if greater than .60), i.e. strong positive relationship, between the movements of the dominant and non-dominant arm, see Table 2.
In the cases of the comparison of values of median accelerations of the dominant and non-dominant arm in SI direction, the Spearman’s rank correlation coef-ficient indicates strong correlation. Medians of accel-erations of the dominant and non-dominant arm in
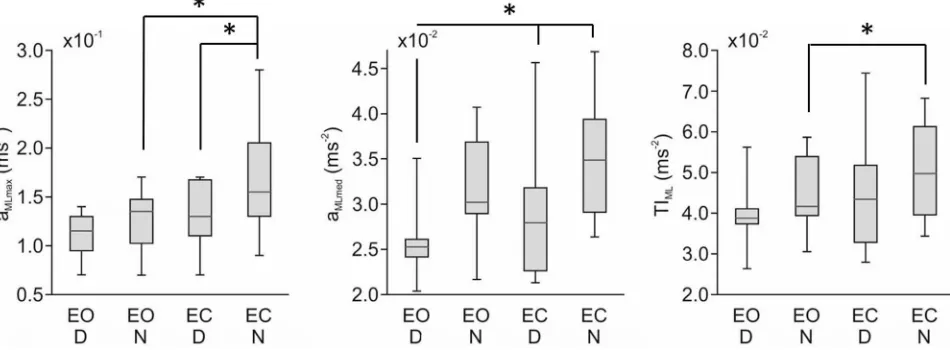
Figure 4. Comparison of maximum (max) and median (med) anterior-posterior accelerations and tremor intensity (TI) of anterior-posterior acceleration of dominant (D) and non-dominant (N) upper arms of subjects standing with eyes open (EO) and eyes closed (EC). *statistically significant difference.
ML direction have a weak or moderate correlation. In the case of the median accelerations in AP direction, the stronger correlation is evident only when subjects standing with EO, see Table 2.
In the cases of the comparison of values of tremor intensity of the dominant and non-dominant arm in SI and AP direction, the Spearman’s rank correla-tion coefficient indicates a strong correlacorrela-tion. Tremor intensities of the dominant and non-dominant arm in ML direction have strong or moderate correlation, see Table 2.
Correlation between the superior-inferior, medio-lateral and anterior-posterior accelerations
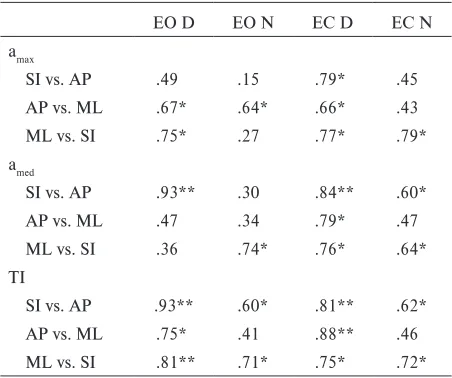
In almost all cases of the comparison of values of maxi-mal accelerations of the dominant upper arm in the SI, AP and ML direction, the Spearman’s rank correlation coefficient indicates a moderate or strong correlation, i.e. positive relationship, between the three accelera-tions, see Table 3. In only two cases of the comparison of values of maximal accelerations of the non-dominant upper arm in the SI, AP and ML direction, the Spear-man’s rank correlation coefficient do not indicate sig-nificant correlation between the accelerations in the SI, AP or ML direction.
In almost all cases of the comparison of values of median accelerations of the dominant upper arm in the SI, AP and ML direction, the Spearman’s rank cor-relation coefficient indicates a significant corcor-relation between the three accelerations, see Table 3. Also, in only two cases of the comparison of values of median Table 1
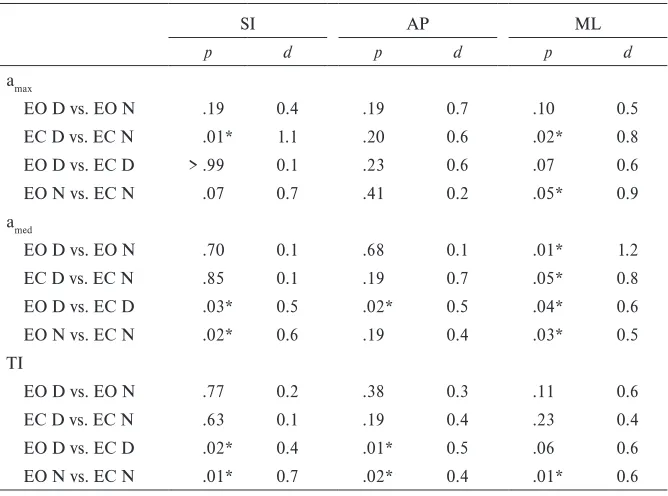
The calculated p-values from the Wilcoxon test and Cohen’s d to assess the differences between the results of measurements of dominant and non-dominant arm, and mea-surements with EO and EC
SI AP ML
p d p d p d
amax
EO D vs. EO N .19 0.4 .19 0.7 .10 0.5
EC D vs. EC N .01* 1.1 .20 0.6 .02* 0.8
EO D vs. EC D > .99 0.1 .23 0.6 .07 0.6
EO N vs. EC N .07 0.7 .41 0.2 .05* 0.9
amed
EO D vs. EO N .70 0.1 .68 0.1 .01* 1.2
EC D vs. EC N .85 0.1 .19 0.7 .05* 0.8
EO D vs. EC D .03* 0.5 .02* 0.5 .04* 0.6
EO N vs. EC N .02* 0.6 .19 0.4 .03* 0.5
TI
EO D vs. EO N .77 0.2 .38 0.3 .11 0.6
EC D vs. EC N .63 0.1 .19 0.4 .23 0.4
EO D vs. EC D .02* 0.4 .01* 0.5 .06 0.6
EO N vs. EC N .01* 0.7 .02* 0.4 .01* 0.6
Note. SI = superior-inferior direction; AP = anterior-posterior direction; ML = medio-lateral direction; D = dominant upper arm; N = non-dominant upper arm; EO = eyes open; EC = eyes closed. *significant difference.
Table 2
Spearman’s rank correlation coefficients between the data measured on dominant and on non-dominant upper limb
SI AP ML
amax
EO D vs. EO N .62* .68* .72*
EC D vs. EC N .67* .74* .65*
amed
EO D vs. EO N .69* .47 .23
EC D vs. EC N .85** .79* .47
TI
EO D vs. EO N .79* .83** .52
EC D vs. EC N .81** .71* .71*
accelerations of the non-dominant upper arm in the SI, AP and ML direction, the Spearman’s rank correlation coefficient does not indicate any moderate or strong correlation between the three accelerations.
In all cases of the comparison of values of tremor intensity of the dominant upper arm in the SI, AP and ML direction, the Spearman’s rank correlation coef-ficient indicates a significant correlation between the three tremor intensities, see Table 3. Also, in all cases of the comparison of values of tremor intensity of the non-dominant upper arm in the SI, AP and ML direc-tion, the Spearman’s rank correlation coefficient indi-cates significant correlation between the three tremor intensities.
Discussion
This study proposed and tested the application of IMUs for measuring spontaneous arm movements while performing a quiet stance. Significant differences in movements of dominant and non-dominant limbs were found using accelerometers in all anatomical axes. Tremors can have generally two sources – oscil-lations driven by mechanical properties of the limb in the corresponding resonance frequency and central oscillatory component, which synchronizes the motor units’ activity of muscles responsible for the segment movements. Several studies have documented that the
PT in the upper extremity is largely driven by the limb mechanics enhanced by stretch reflex oscillation, but with minimal central influences (Elble, 2003; Raeth-jen et al., 2004; RaethRaeth-jen, Pawlas, Lindemann, Wenzel-burger, & Deuschl, 2000). In line with this, Carignan, Daneault, and Duval (2012) have found that tremors of all segments are highly correlated and driven by the angular displacement in the shoulder joint.
There are only few data available about spontane-ous movements of arms at rest, our results thus rep-resent a pilot set, using modern technique, for further studies (Marsden, 1984). High correlation of tremor intensity between both arms is well documented fea-ture of PT, it shows its common source of oscillation in both extremities. On the contrary, for pathological tremors is typical poor correlation consistent with several central oscillators working in separate loops for each extremity (O’Suilleabhain & Matsumoto, 1998).
The main applicable findings of this study include significant differences of median accelerations (medio-lateral plane) between the dominant and non-dominant upper extremities and between accelerations measured with closed versus open eyes. Less apparent were the differences between the dominant and non-dominant upper extremity and between values measured with closed versus open eyes when parameters of tremor intensity and maximal accelerations were considered, see Table 1. Higher acceleration and higher tremor intensity were recorded on the non-dominant extremity and with closed eyes compared to the open eyes condi-tion. According to the study of Raethjen et al. (2000), side differences in the movements were not age, gen-der and laterality dependent, but the differences were explained by the segment weight and dimensions (i.e. sex differences are indirect consequence of weight alteration). Effects of laterality, observed in our sub-jects, could be explained by differences in arm weight between dominant and non-dominant extremity as mentioned in Raethjen et al. (2000). Side differences between dominant versus non-dominant arm weight can amount up to about 4.8% (Clauser, McConville, & Young, 1969). Side differences in the grip and elbow strength due to differences in muscle mass were found by Aoki and Demura (2008). Thus, a possible expla-nation could be that a lighter, non-dominant extrem-ity trembles more. Only a few notions on the tremor correlation with upper limb laterality are found in the literature, e.g. Machowska-Majchrzak et al. (2011) stated that the essential tremor was more intense in the non-dominant extremity in 62% of patients. On the other hand, no correlation of upper limb movement in walking with laterality was found (Kuhtz-Buschbeck, Brockmann, Gilster, Koch, & Stolze, 2008).
Table 3
Spearman’s rank correlation coefficients between the superior-inferior, medio-lateral and anterior-posterior accelerations
EO D EO N EC D EC N
amax
SI vs. AP .49 .15 .79* .45
AP vs. ML .67* .64* .66* .43
ML vs. SI .75* .27 .77* .79*
amed
SI vs. AP .93** .30 .84** .60*
AP vs. ML .47 .34 .79* .47
ML vs. SI .36 .74* .76* .64*
TI
SI vs. AP .93** .60* .81** .62*
AP vs. ML .75* .41 .88** .46
ML vs. SI .81** .71* .75* .72*
The statistically significant difference of the tremor intensity between open and closed eyes conditions is difficult to explain and no relevant literature citations are known. One possible explanation could be that it takes more effort to attain proper posture in space without visual control. For this reason, muscle activity increases and central oscillations are added to the pure mechanical oscillations of the undisturbed stand. This hypothesis could be easily tested by EMG recording of the trembling segments in the future. However, in the case of using accelerometers, the significant difference proved the importance and necessity to take the type of stance task into account, since the results differed between tested conditions. This concludes that compli-cating stance task by reducing the visual perception, enhances the differences in arm movements.
Methods based on the calculation of the median and finding the maxima of measured values of accel-erations are easy to interpret for medical personnel, and therefore mentioned indicators were used. These methods are commonly used for the evaluation of center of pressure (CoP) movement during quiet standing, and therefore the parameters are also used for the evaluation of movement of arms during quiet standing. Median and maxima of measured values are parameters of time-domain analysis. As a method of frequency-domain analysis, tremor intensity was cho-sen for the assessment of the movement of the upper limbs. The method was chosen as a promising one and because this parameter has not been used before for evaluating the movement of upper limbs during quiet standing. Therefore application of the parameter is an original evaluation procedure of upper limb movement.
There are potential limitations to our study. The main weakness of this study is a small number of subjects, which makes small numbers error possible. Clearly, this study needs to be replicated using a larger sample. Furthermore, measurement during postural load and on several segments of the upper extremity should be included in the future experiments.
However, to test the basic attributes of the appli-cation of IMU and quantitative methods proposed for the study of spontaneous arm movements in this preliminary study, a sample of fourteen subjects seems sufficient, just as it was in similar works focused on the spontaneous movements evaluation published by Diener et al. (1992).
Conclusions
The results pointed to significant differences between movements of the dominant and non-dominant arms during quiet stance with eyes open and eyes closed in a
few cases. The results set up pilot values for spontane-ous arm movements in rest, without postural load in a group of healthy controls. The designed methods and medical findings may facilitate a wider use of IMUs and evaluation of spontaneous upper extremity move-ments in medical practice in the future.
Acknowledgment
This work was done in the framework of research proj-ect SGS16/109/OHK4/1T/17 of CTU in Prague. The authors would also like to thank Pavel Smrcka, Karel Hana, Vladimir Socha and Stanislav Kusmirek for the supporting our research and preparation of format of our manuscript.
Conflict of interest
There were no conflicts of interest.
References
Allum, J. H., Nijhuis, L. B. O., & Carpenter, M. G. (2008). Differences in coding provided by proprioceptive and ves-tibular sensory signals may contribute to lateral instability in vestibular loss subjects. Experimental Brain Research, 184, 391–410.
Altun, K., & Barshan, B. (2012). Pedestrian dead reckoning employing simultaneous activity recognition cues. Mea-surement Science and Technology, 23, 025103.
Aoki, H., & Demura, S. (2008). Characteristics and lateral dominance of hand grip and elbow flexion powers in young male adults. Journal of Physiological Anthropology, 27, 201–206.
Aw, S. T., Halmagyi, G. M., Black, R. A., Curthoys, I. S., Yavor, R. A., & Todd, M. J. (1998). Head impulses reveal loss of individual semicircular canal function. Journal of Vestibular Research: Equilibrium & Orientation, 9, 173–180. Brinckmann, P., Frobin, W., & Leivseth, G. (2002). Mus-culoskeletal biomechanics. Stuttgart, Germany: Georg Thieme Verlag.
Carignan, B., Daneault, J. F., & Duval, C. (2012). The orga-nization of upper limb physiological tremor. European Journal of Applied Physiology, 112, 1269–1284.
Clauser, C. E., McConville, J. T., & Young, J. W. (1969). Weight, volume, and center of mass of segments of the human body [AMRL Technical Report]. Wright-Patterson Air Force Base, OH: Air Force Systems Command, Aerospace Medical Division.
Cohen, J. (1988). Statistical power analysis for the behavioral sciences. Hillsdale, NJ: Lawrence Erlbaum.
Diener, H. C., Dichgans, J., Guschlbauer, B., Bacher, M., Rapp, H., & Klockgether, T. (1992). The coordination of posture and voluntary movement in patients with cerebel-lar dysfunction. Movement Disorders, 7, 14–22.
Duclos, C., Nadeau, S., & Lecours, J. (2008). Lateral trunk displacement and stability during sit-to-stand transfer in relation to foot placement in patients with hemiparesis. Neurorehabilitation and Neural Repair, 22, 715–722. Elble, R. J. (2003). Characteristics of physiologic tremor in
young and elderly adults. Clinical Neurophysiology, 114, 624–635.
Findling, O., Sellner, J., Meier, N., Allum, J. H., Vibert, D., Lienert, C., & Mattle, H. P. (2011). Trunk sway in mildly disabled multiple sclerosis patients with and without balance impairment. Experimental Brain Research, 213, 363–370.
Fritz, C. O., Morris, P. E., & Richler, J. J. (2012). Effect size estimates: Current use, calculations, and interpretation. Journal of Experimental Psychology: General, 141, 2. Gil-Agudo, Á., de Los Reyes-Guzman, A.,
Dimbwadyo-Ter-rer, I., Peñasco-Martín, B., Bernal-Sahún, A., López-Mon-teagudo, P., ... Pons, J. L. (2013). A novel motion tracking system for evaluation of functional rehabilitation of the upper limbs. Neural Regeneration Research, 8, 1773–1782. Hogg, R. V., & Craig, A. T. (1995). Introduction to
mathemati-cal statistics (5th ed.). New York, NY: Macmillan. Honegger, F., Van Spijker, G. J., & Allum, J. H. J. (2012).
Coordination of the head with respect to the trunk and pelvis in the roll and pitch planes during quiet stance. Neu-roscience, 213, 62–71.
Kennie, T. J., & Petrie, G. (2010). Engineering surveying tech-nology. Boca Raton, FL: CRC Press.
Khasnis, A., & Gokula, R. M. (2003). Romberg’s test. Jour-nal of Postgraduate Medicine, 49, 169–172.
Konrad, P. (2005). The ABC of EMG. A practical introduc-tion to kinesiological electromyography. Scottsdale, AZ: Noraxon, Inc.
Kuhtz-Buschbeck, J. P., Brockmann, K., Gilster, R., Koch, A., & Stolze, H. (2008). Asymmetry of arm-swing not related to handedness. Gait & Posture, 27, 447–454. Kutílek, P., Socha, V., Čakrt, O., Schlenker, J., & Bizovská,
L. (2015). Trajectory length of pitch vs. roll: Technique for assessment of postural stability. Acta Gymnica, 45, 85–92. Louis, E. D. (2005). Essential tremor. Lancet Neurology, 4,
100–110.
Liu, J., Zhang, X., & Lockhart, T. E. (2012). Fall risk assess-ments based on postural and dynamic stability using inertial measurement unit. Safety and Health at Work, 3, 192–198.
Machowska-Majchrzak, A., Pierzchała, K., Pietraszek, S., & Łabuz-Roszak, B. (2011). Essential tremor-assessment of tremor accelerometric parameters’ symmetry and the rela-tionship between hand dominance and severity of tremor. Neurologia i Neurochirurgia Polska, 45, 121–127.
Machowska-Majchrzak, A., Pierzchała, K., Pietraszek, S., Łabuz-Roszak, B., & Bartman, W. (2012). The usefulness
of accelerometric registration with assessment of tremor parameters and their symmetry in differential diagnosis of parkinsonian, essential and cerebellar tremor. Neurologia i Neurochirurgia Polska, 46, 145–156.
Mancini, M., Salarian, A., Carlson-Kuhta, P., Zampieri, C., King, L., Chiari, L., & Horak, F. B. (2012). ISway: A sensi-tive, valid and reliable measure of postural control. Journal of NeuroEngineering and Rehabilitation, 9, 59.
Marsden, C. D. (1984). Origins of normal and pathological tremor. In L. J. Findley & R. Capildeo (Eds.), Movement disorders: Tremor (pp. 37–84). London, United Kingdom: Palgrave Macmillan UK.
Melecky, R., Socha, V., Kutilek, P., Hanakova, L., Takac, P., Schlenker, J., & Svoboda, Z. (2016). Quantification of trunk postural stability using convex polyhedron of the time-series accelerometer data. Journal of Healthcare Engi-neering, 2016, 1621562.
O’Suilleabhain, P. E., & Matsumoto, J. Y. (1998). Time-fre-quency analysis of tremors. Brain, 121, 2127–2134. Oldfield, R. C. (1971). The assessment and analysis of
hand-edness: The Edinburgh inventory. Neuropsychologia, 9, 97–113.
Osler, C. J., & Reynolds, R. F. (2012). Postural reorientation does not cause the locomotor after-effect following rotary locomotion. Experimental Brain Research, 220, 231–237. Papapetropoulos, S., Katzen, H. L., Scanlon, B. K., Guevara,
A., Singer, C., & Levin, B. E. (2010). Objective quanti-fication of neuromotor symptoms in Parkinson’s disease: Implementation of a portable, computerized measurement tool. Parkinson’s Disease, 2010, 760196.
Rodríguez, R., Costa, U., Torrent, M., Solana, J., Opisso, E., Cáceres, C., ... Gómez, E. J. (2010). Upper limb portable motion analysis system based on inertial technology for neurorehabilitation purposes. Sensors, 10, 10733–10751. Raethjen, J., Lauk, M., Köster, B., Fietzek, U., Friege, L.,
Timmer, J., … Deuschl, G. (2004). Tremor analysis in two normal cohorts. Clinical Neurophysiology, 115, 2151–2156. Raethjen, J., Pawlas, F., Lindemann, M., Wenzelburger, R.,
& Deuschl, G. (2000). Determinants of physiologic tremor in a large normal population. Clinical Neurophysiology, 111, 1825–1837.
Schubert, P., Kirchner, M., Schmidtbleicher, D., & Haas, C. T. (2012). About the structure of posturography: Sampling duration, parametrization, focus of attention (Part I). Jour-nal of Biomedical Science and Engineering, 5, 496–507. Stirling, D. A., Hesami, A. S., Ritz, C. H., Adistambha, K., &
Naghdy, F. (2010). Symbolic modelling of dynamic human motions. Rijeka, Croatia: InTech.
Ying, N., & Kim, W. (2002). Use of dual Euler angles to quantify the three-dimensional joint motion and its appli-cation to the ankle joint complex. Journal of Biomechanics, 35, 1647–1657.