
Supplementary materials
Synthesis of Reusable Silica Nanosphere-Supported Pt(IV) Complex for Formation of Disulfide Bonds in Peptides
Xiaonan Hou, Xiaowei Zhao, Yamei Zhang, Aiying Han, Shuying Huo*, and Shigang
Shen*
College of Chemistry and Environmental Science, Key Laboratory of Analytical
Science and Technology of Hebei Province, and MOE Key Laboratory of Medicinal
Chemistry and Molecular Diagnostics, Hebei University, Baoding 071002, Hebei
Province, P. R. China
1. TEM images of SiO2 and SiO2@TPEA.
2. Infrared spectra of pure SiO2and SiO2@TPEA.
3. Determination of Pt(IV) complex loading on SiO2@TPEA@Pt(IV)
Figure S1. TEM images of a) SiO2 and b) SiO2@TPEA.
2. Infrared spectra of pure SiO2and SiO2@TPEA
Figure S2. Infrared spectra of pure SiO2 (—) and SiO2@TPEA (—).
Figure S3. Absorbance at 330 nm for a series of reaction mixtures, in which the
concentration of trans-[PtCl2(en)2]2+ varied from 1.96 × 10⁻² mM to 0.118 mM and
2,5-dimethoxythiophenol was kept constant at 0.10 mM. The reaction medium was a
pH 4.5 buffer solution at 25 °C.
Figure S4. Calibration curve for the determination of Pt(IV) complex loading in the
4. Disulfide bond formation in peptides
4.1. HPLC and ESI-MS characterization of peptide 1
Peptide 1 was dissolved in a pH 4.5 buffer (1 mg/mL, 1.5 mL) and stirred at 25°C for
30 min. The mixture was then analyzed by an HPLC system equipped with a UV-vis
detector at 215 nm using a 250 mm × 4.6 mm C8 column at a flow rate of 1.0 mL/min
at room temperature. The HPLC solvent consisted of a mixture of solvent A (0.03%
TFA in acetonitrile) and solvent B (0.03% TFA in water). The elution protocol for
analytical HPLC was as follows: 90% B, followed by a linear gradient to 60% B over
10 min and further to 50% B over 5 min, held at 50% B for 5 min, and finally
returned to 90% over 5 min. The HPLC chromatogram obtained is shown in Figure
S5a.
Next, to the mixture of peptide 1 in a pH 4.5 buffer (1 mg/mL, 1.5 mL),
SiO2@TPEA@Pt(IV) (50 mg) or [Pt(en)2Cl2]Cl2 (1.8 mg) were added with stirring at
25 °C for 30 min. The supernatant obtained after centrifugation in the former case and
the reaction mixture in the latter case were analyzed using the HPLC method
described above. The HPLC chromatograms obtained for the two cases are presented
in Figure S5b and S5c, respectively.
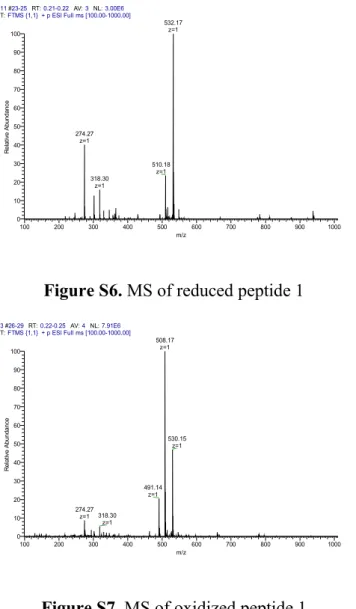
Peptide 1 as well as its oxidation product were also characterized by ESI-MS in
the positive mode observed [M + H+]+ m/z 510.18 and [M + Na+]+ m/z 532.17 for
peptide 1 (Figure S6) and [M + H+]+ m/z 408.17 and [M + Na+]+ m/z 530.15 for
Figure S5. HPLC chromatograms of a) peptide 1 (1.0 mg/mL, 1.5 mL) after stirring
for 30 min; b) supernatant from the reaction of SiO2@TPEA@Pt(IV) (50 mg) with
peptide 1 (1.0 mg/mL, 1.5 mL) for 30 min; and c) mixture from the reaction of
[Pt(en)2Cl2]Cl2 (1.8 mg) with peptide 1 (1.0 mg/mL, 1.5 mL).
11 #23-25RT:0.21-0.22AV:3NL:3.00E6
T:FTMS {1,1} + p ESI Full ms [100.00-1000.00]
100 200 300 400 500 600 700 800 900 1000
m/z 0 10 20 30 40 50 60 70 80 90 100 R el at iv e A bu nd an ce 532.17 z=1 274.27 z=1 510.18 z=1 318.30 z=1
Figure S6. MS of reduced peptide 1
3 #26-29RT:0.22-0.25AV:4 NL:7.91E6
T:FTMS {1,1} + p ESI Full ms [100.00-1000.00]
100 200 300 400 500 600 700 800 900 1000
m/z 0 10 20 30 40 50 60 70 80 90 100 R el at iv e A bu nd an ce 508.17 z=1 530.15 z=1 491.14 z=1 274.27 z=1 318.30 z=1
4.2. HPLC and ESI-MS characterization of peptide 2
Peptide 2 was dissolved in a pH 4.5 buffer (1 mg/mL, 1.5 mL) and stirred at 25
°C for 80 min. The mixture was then analyzed by an HPLC system equipped with a
UV-vis detector at 215 nm using a 250 mm × 4.6 mm C8 column at a flow rate of 1.0
mL/min at room temperature. The HPLC solvent consisted of solvent A (0.1% TFA in
acetonitrile) and solvent B (0.1% TFA in water). The elution protocol for analytical
HPLC started with 90% B, followed by a linear gradient to 70% B over 22 min. The
HPLC chromatogram obtained is shown in Figure S8a.
Next, to the mixture of peptide 2 in a pH 4.5 buffer (1 mg/mL, 1.5 mL),
SiO2@TPEA@Pt(IV) (7.5 mg) or [Pt(en)2Cl2]Cl2 (0.9 mg) were added with stirring at
25 °C for 80 min. The supernatant obtained after centrifugation in the former case and
the reaction mixture in the latter case were analyzed using the HPLC method
described above. The HPLC chromatograms obtained for the two cases are presented
in Figure S8b and S8c, respectively.
Peptide 2 as well as its oxidation product were also characterized by ESI-MS in
the positive mode observed [M + H+]+ m/z 1346.63 and [M + 2H+]2+ m/z 673.82 for
peptide 2 (Figure S9) and [M + H+]+ m/z 1344.61 and [M + 2H+]2+ m/z 672.81 for
Figure S8. HPLC chromatograms of a) peptide 2 after stirring for 80 min; b)
supernatant from the reaction between SiO2@TPEA@Pt(IV) and peptide 2 after
reaction for 80 min; and c) [Pt(en)2Cl2]Cl2 and peptide 2 reaction mixture.
Z-0612-1_160614150823 #11-15RT:0.11-0.14AV:5NL:1.51E6
T:FTMS {1,1} + p ESI Full ms [200.00-2000.00]
400 600 800 1000 1200 1400 1600 m/z 0 10 20 30 40 50 60 70 80 90 100 R el at iv e A bu nd an ce 673.82 z=2 449.55 z=3 346.33 z=1 684.81 z=2 865.42 z=1 1346.63 z=1 692.79 z=2
Figure S9. MS of reduced peptide 2
Z-0612-2_160614151403 #22-27RT:0.20-0.24AV:6NL:2.75E5
T:FTMS {1,1} + p ESI Full ms [200.00-2000.00]
400 600 800 1000 1200 1400 1600
Figure S10. MS of oxidized peptide 2
4.3. HPLC and ESI-MS characterization of reduced arginine vasopressin
Reduced arginine vasopressin was dissolved in a pH 4.5 buffer (2 mg/mL, 1.5 mL)
and stirred at 25°C for 30 min. The mixture was then analyzed using HPLC equipped
with a UV-vis detector at 215 nm with a 250 mm × 4.6 mm C8 column at a flow rate
of 1.0 mL/min at room temperature. The HPLC elution solvent consisted of 20%
solvent A (0.03% TFA in acetonitrile) and 80% solvent B (0.03% TFA in water). The
HPLC chromatogram obtained is shown in Figure S11a.
Next, reduced arginine vasopressin was dissolved in a pH 4.5 buffer (2 mg/mL,
1.5 mL) and reacted with SiO2@TPEA@Pt(IV) (50 mg) or [Pt(en)2Cl2]Cl2 (1.7 mg)
under stirring at 25 °C for 30 min. In the former case, the mixture was subjected to
centrifugation and the supernatant obtained was analyzed using HPLC (Figure S11b).
In the latter case, the reaction mixture was analyzed by HPLC (Figure S11c) using the
conditions described above.
Reduced arginine vasopressin and arginine vasopressin were characterized by
ESI-MS in the positive mode. In the case of arginine vasopressin, the observed [M +
H+]+ m/z was 1086.46 and [M + 2H+]2+ m/z was 543.73 (Figure S12). In the case of
arginine vasopressin, the observed [M + H+]+ m/z was 1084.45 and [M + 2H+]2+ m/z
Figure S11. HPLC chromatograms of a) reduced arginine vasopressin after stirring
for 30 min; b) supernatant from the reaction of SiO2@TPEA@Pt(IV) with reduced
arginine vasopressin for 30 min; and c) [Pt(en)2Cl2]Cl2 and reduced arginine
vasopressin reaction mixture.
8 #42-43RT:0.35-0.36AV:2NL:1.40E6
T:FTMS {1,1} + p ESI Full ms [200.00-2000.00]
200 400 600 800 1000 1200 1400 1600 1800 2000
m/z 0 10 20 30 40 50 60 70 80 90 100 R el at iv e A bu nd an ce 543.73 z=2 1086.46 z=1 1112.48 z=1 556.74 z=2
Figure S12. MS of reduced arginine vasopressin
2 #31-32RT:0.26-0.27 AV:2NL:5.70E6
T:FTMS {1,1} + p ESI Full ms [200.00-2000.00]
200 400 600 800 1000 1200 1400 1600 1800 2000
m/z 0 10 20 30 40 50 60 70 80 90 100 R el at iv e A bu nd an ce 542.73 z=2 1084.45 z=1 274.27
z=1 553.72z=2 1220.42z=1
1106.43 z=1
370.14
Figure S13. MS of arginine vasopressin
4.4. HPLC and ESI-MS characterization of reduced iRGD peptide
Reduced iRGD peptide was dissolved in a pH 4.5 buffer (2 mg/mL, 1.2 mL) and
stirred at 25 °C for 30 min. The solution was analyzed by a gradient HPLC equipped
with a UV-vis detector at 215 nm using a 250 mm × 4.6 mm C8 column at a flow rate
of 1.0 mL/min at room temperature. The HPLC solvent consisted of solvent A (0.1%
TFA in acetonitrile) and solvent B (0.1% TFA in water). The elution protocol for
analytical HPLC started with 95% B, followed by a linear gradient to 92% B over 20
min, and back to 95% over 5 min. The HPLC chromatogram obtained is shown in
Figure S14a.
Next, the reduced iRGD peptide was dissolved in a pH 4.5 buffer (2 mg/mL, 1.2
mL) and reacted with SiO2@TPEA@Pt(IV) (40 mg) or [Pt(en)2Cl2]Cl2 (1.5 mg) under
stirring at 25 °C for 30 min. In the former case, the supernatant was obtained after
centrifugation and analyzed using HPLC, whereas in the latter case, the reaction
mixture was analyzed using HPLC, with the conditions described above. The results
are shown in Figure S14b and Figure S14c, respectively.
Reduced iRGD and iRGD were characterized by ESI-MS in the positive mode;
for reduced iRGD peptide, observed [M + H+]+ m/z 949.40 and [M + 2H+]2+ m/z
475.20 (Figure S15); for iRGD peptide observed [M + H+]+ m/z 947.38 and [M +
Figure S14. HPLC chromatograms of a) reduced iRGD after stirring for 30 min; b)
supernatant from the reaction of SiO2@TPEA@Pt(IV) with reduced iRGD for 30
min; and c) [Pt(en)2Cl2]Cl2 and reduced iRGD reaction mixture.
10 #45-48RT:0.35-0.37AV:4NL:3.91E7
T:FTMS {1,1} + p ESI Full ms [200.00-2000.00]
200 400 600 800 1000 1200 1400 1600 1800 2000
m/z 0 10 20 30 40 50 60 70 80 90 100 R el at iv e A bu nd an ce 475.20 z=2 949.40 z=1 415.18 z=2 317.14 z=3
Figure S15. MS of reduced iRGD
6 #27-33RT:0.23-0.27 AV:7NL:2.93E7
T:FTMS {1,1} + p ESI Full ms [200.00-2000.00]
200 400 600 800 1000 1200 1400 1600 1800 2000
Figure S16. MS of iRGD
4.5. HPLC and ESI-MS characterization of reduced oxytocin
Reduced oxytocin was dissolved in a pH 4.5 buffer (2 mg/mL, 1.2 mL) and stirred at
25 °C for 30 min. The solution was then analyzed by a gradient HPLC equipped with
a UV-vis detector at 215 nm using a 250 mm × 4.6 mm C8 column at a flow rate of
1.0 mL/min at room temperature. The HPLC solvent was composed of solvent A
(0.03% TFA in acetonitrile) and solvent B (0.03% TFA in water). The elution
protocol for analytical HPLC started with 90% B, followed by a linear gradient to
25% B over 10 min, and further to 50% B over 10 min, held at 50% B for 5 min,
continued to 90% B over 20 min, and finally returned to 90% over 10 min. The HPLC
chromatogram obtained is shown in Figure S17a.
Next, reduced oxytocin was dissolved in a pH 4.5 buffer (2 mg/mL, 1.2 mL) and
reacted with SiO2@TPEA@Pt(II) (40 mg) or SiO2@TPEA@Pt(IV) (40 mg) under
stirring at 25 °C for 30 min. After centrifugation of the mixture, the supernatants
obtained were analyzed using the same HPLC method as described above. The HPLC
chromatogram obtained is shown in Figure S17b and S17c.
Reduced oxytocin was then dissolved in pH 4.5 buffer (2 mg/mL, 1.2 mL) and
reacted with [Pt(en)2Cl2]Cl2 (1.5 mg) at 25°C for 30 min. The mixture was analyzed
using the HPLC method described above and the result is shown in Figure S17d.
Reduced oxytocin as well as oxytocin were characterized by ESI-MS in the
Na+]+m/z 1029.42 (Figure S19).
Figure S17. HPLC chromatograms of a) reduced oxytocin after stirring for 30 min; b)
supernatant from the mixture of SiO2@TPEA@Pt(II) with reduced oxytocin stirred
for 30 min; c) supernatant from the reaction mixture of SiO2@TPEA@Pt(IV) with
reduced oxytocin for 30 min; and d) mixture of [Pt(en)2Cl2]Cl2 with reduced oxytocin.
9 #32-34RT:0.27-0.29 AV:3NL:3.09E6
T:FTMS {1,1} + p ESI Full ms [200.00-2000.00]
200 400 600 800 1000 1200 1400 1600 1800 2000
m/z 0
10 20 30 40 50 60 70 80 90 100
R
el
at
iv
e
A
bu
nd
an
ce
1009.46 z=1
Figure S18. MS of reduced oxytocin
7 #44RT:0.41AV:1NL:2.53E5
T:FTMS {1,1} + p ESI Full ms [200.00-2000.00]
200 400 600 800 1000 1200 1400 1600 1800 2000
m/z 0
10 20 30 40 50 60 70 80 90 100
R
el
at
iv
e
A
bu
nd
an
ce
1007.44 z=1
1029.42 z=1
504.23 z=2
4.6. HPLC and ESI-MS characterization of reduced somatostatin
Reduced somatostatin was dissolved in a solution containing pH 4.5 buffer and
acetonitrile (3:1 v/v) (1 mg/mL, 2 mL) and stirred at 25°C for 30 min. The solution
was then analyzed by a gradient HPLC equipped with a UV-vis detector at 215 nm
using a 250 mm × 4.6 mm C8 column at a flow rate of 1.0 mL/min at room
temperature. The HPLC solvent mixture consisted of solvent A (0.1% TFA in
acetonitrile) and solvent B (0.1% TFA in water). The elution protocol for the HPLC
analysis started with 70% B, followed by a linear gradient to 0% B over 15 min, and
returned to 70% over 5 min. The HPLC chromatogram obtained is shown in Figure
S20a.
Next, reduced somatostatin solution (1 mg/mL, 2 mL) was reacted with
SiO2@TPEA@Pt(IV) (25 mg) or [Pt(en)2Cl2]Cl2 (1.0 mg) under stirring at 25 °C for
30 min. In the former case, the mixture was subjected to centrifugation and the
supernatant obtained was analyzed using HPLC. In the latter case, the reaction
mixture was analyzed using HPLC. The conditions described above were used for the
HPLC analyses and the results for the two cases are shown in Figure S20b and Figure
S20c, respectively.
Reduced somatostatin and somatostatin were characterized by ESI-MS in the
positive mode; for reduced somatostatin observed [M + 2H+]2+ m/z 820.37 and [M +
H+]+m/z 1639.74 (Figure S21); for somatostatin observed[M + 2H+]2+m/z 819.37 and
Figure S20. HPLC chromatograms of a) reduced somatostatin after stirring for 30
min; b) supernatant from the reaction of SiO2@TPEA@Pt(IV) with reduced
somatostatin for 30 min; and c) [Pt(en)2Cl2]Cl2 and reduced somatostatin reaction
mixture.
2 #14-17RT:0.14-0.16AV:4NL:4.80E6
T:FTMS {1,1} + p ESI Full ms [200.00-2000.00]
200 400 600 800 1000 1200 1400 1600 1800 2000
m/z 0
10 20 30 40 50 60 70 80 90 100
R
el
at
iv
e
A
bu
nd
an
ce
820.37 z=2
547.25
z=3 1639.74
z=1 684.20
z=1
1_160427101910 #43RT:0.36AV:1NL:6.22E5
T:FTMS {1,1} + p ESI Full ms [200.00-2000.00]
200 400 600 800 1000 1200 1400 1600 1800 2000
m/z 0
10 20 30 40 50 60 70 80 90 100
R
el
at
iv
e
A
bu
nd
an
ce
819.37 z=2
546.58 z=3
Figure S22. MS of somatostatin
4.7. HPLC analysis of the interaction oxytocin with SiO2@TPEA@Pt(II)
Reduced oxytocin was dissolved in pH 4.5 buffer (2 mg/mL, 3.3 mL) and reacted
with 4.4 mg of [Pt(en)2Cl2]Cl2 for 30 min. The mixture was then analyzed by HPLC
using the protocol described in section 3.5. The HPLC chromatogram is shown in
Figure S23a. Further, the above solution (1.2 mL) was mixed with 40 mg of
SiO2@TPEA@Pt(II) under stirring for 30 min. The mixture was centrifuged and the
supernatant was analyzed by HPLC. The result is shown in Figure S23b.
Figure S23. HPLC chromatograms of a) the reaction mixture of [Pt(en)2Cl2]Cl2 with
reduced oxytocin for 30 min and b) supernatant from the reaction mixture of


![Figure S3. Absorbance at 330 nm for a series of reaction mixtures, in which the concentration of trans-[PtCl 2 (en) 2 ] 2+ varied from 1.96 × 10 -2 mM to 0.118 mM and](https://thumb-us.123doks.com/thumbv2/123dok_us/7905077.1312448/4.892.256.612.128.403/figure-absorbance-series-reaction-mixtures-concentration-trans-varied.webp)


![Figure S18. MS of reduced oxytocin 7 # 44 RT: 0.41 AV: 1 NL: 2.53E5 T: FTMS {1,1} + p ESI Full ms [200.00-2000.00] 200 400 600 800 1000 1200 1400 1600 1800 2000 m/z0102030405060708090100Relative Abundance1007.44z=1 1029.42z=1504.23z=2 Figure S19](https://thumb-us.123doks.com/thumbv2/123dok_us/7905077.1312448/15.892.260.631.174.417/figure-reduced-oxytocin-ftms-esi-relative-abundance-figure.webp)

