www.ijiset.com
219
Application of Multiclass DNeupper
Classifier Using Sample Soil Dataset of
Tirupur District for Predicting Multiple
Crop Yields
S. ManimekalaiPh.D., Research Scholar,
PG and Research Department of Computer Science, Chikkanna Government Arts College,
Tirupur, India [email protected]
K. Nandhini Assistant Professor,
PG and Research Department of Computer Science, Chikkanna Government Arts College,
Tirupur, India [email protected]
Abstract—In agricultural applications, the most important process is crop yield prediction that predicts the yield productivity over a definite period of harvesting. Many data mining algorithms have been developed to predict the yield of multiple crops simultaneously which consumes more time and also creates a multi-class multi-classification problem. The Krill-Herd (KH)-based feature selection with Dynamic Multi-Class Neupper (KHDMCNeupper) classifier is used to predict the quality of yield for three different crops, namely rice, wheat and maize. Since it achieves better accuracy for those crops it is used to predict the yield of three different crops such as coconut, sorghum and groundnut of Tirupur districts. The soil parameters P, K, Cu and Fe etc., of the identified crops of Tirupur districts are collected and the most optimum of these parameters are selected using KH algorithm. The rough set theory determines the relative weights of each selected soil parameters and it is being added with the actual soil parameter values. The calculated weight of the parameter values are used by the Artificial Neural Network (ANN) to build a decision tree in the DNeupper classifier. The classification rules for are generated for all the crops together within a single classifier. As a result the quality of crop yield is predicted with the reduced training time. The results demonstrate the efficiency of KHDMCNeupper classifier for the considered crops and compared to the other classification algorithms.
Keywords—Crop yield prediction, ANN, KH, KHDMCNeupper, Soil parameters, Rough set theory.
I. INTRODUCTION
Agriculture plays a major role in most of the Asian countries where the demand of food has been increased due to unconditional growth of
population. In earliest years, individuals cultivate the crops in their own land and conjointly natural crops harvested that are used by totally different individuals, animals and birds since such crops will offer healthy life. The individual doesn’t have the information concerning the cultivation of the crops in an exceedingly right time and at an acceptable location. By victimization the smart techniques, the seasonal atmospheric condition are being modified against fundamental properties like soil, water and air which give to insecurity of food. There is no correct resolution and technologies by analyzing the problems like climate, temperature, etc., to avoid the agricultural degradation.
www.ijiset.com
220
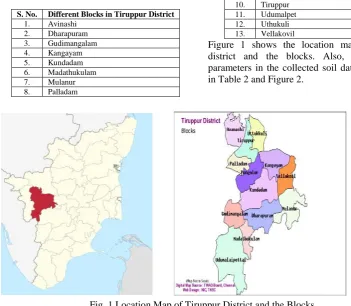
TABLE I BLOCKS OF TIRUPPUR DISTRICTS. No. Different Blocks in Tiruppur District
1. Avinashi
2. Dharapuram
3. Gudimangalam
4. Kangayam
5. Kundadam
6. Madathukulam
7. Mulanur
8. Palladam
9. Pongalur
10. Tiruppur
11. Udumalpet
12. Uthukuli
13. Vellakovil
Figure 1 shows the location map of Tirupur district and the blocks. Also, different soil parameters in the collected soil dataset are listed in Table 2 and Figure 2.
Fig. 1 Location Map of Tiruppur District and the Blocks TABLE II TYPES OF SOIL PARAMETERS
Types Description
Ph Ph value of soil
EC Electrical Conductivity
OC Organic Carbon
Zn Zinc
Cu Copper
Fe Iron
P Phosphorous
Mn Manganese
K Potassium
S Sulphur
Ca Calcium
Mg Magnesium
ST Soil Temperature
N Nitrogen
B Boron
Fig. 2 Ct, Sm and Gt Dataset
www.ijiset.com
221
on KHDMCNeupper rule-based classificationalgorithm. As well, the yield predictions of those crops are analyzed to know its prediction accuracy compared with the other yield prediction algorithms.
The rest of the paper is organized as follows: Section II presents the most reviewed research articles on the crop yield prediction. Section III explains the KHDMCNeupper crop yield prediction algorithm. Section IV illustrates the performance effectiveness of the used algorithms and Section V concludes that the single classifier is most prominence for multi crop yield prediction simultaneously.
II. LITERATURE SURVEY
Paul et al. [6] analyzed soil behaviour using data mining approach to predict the crop yield. In this system, the types of the analyzed soil datasets were predicted by using data mining techniques. The predicted type was used for identifying the yielding of crops. Here, the problem of crop yield prediction was formalized as a classification rule in which Naive Bayes (NB) and K-Nearest Neighbor (KNN) techniques were applied to the soil dataset taken from the soil testing laboratory in Jabalpur, Madhya Pradesh. However, only a small dataset was utilized in this analysis.
Sahu et al. [7] analyzed crop yield prediction using Hadoop framework based on random forest approach. Initially, the agricultural datasets were collected and random forest algorithm was used for classification process. Moreover, MapReduce programming model was proposed to handle the large dataset by assigning key-value pair. Finally, the analyzed dataset was classified and predicted for finding outcomes. However, the complexity of this algorithm was high and also it was time-consuming.
Dey et al. [8] proposed rice yield prediction model using data mining. In this system, the yield of rice was predicted by using the climatic conditions. Initially, data was collected and then Multi Linear Regression, AdaBoost, Support Vector Machine and the modified nonlinear regression were implemented on the training dataset for finding the parameter values. After that, the computed parameters along with the independent variables were performed on the test data to predict the yield. However, it requires different data other than weather to increase the accuracy.
Bhangale et al. [9] proposed an improved crop yield prediction using neural network. Initially, different data associated with the crop yield were collected and normalized. Then, the normalized data were classified by using neural network. Also, the crop yield prediction was executed based on an adaptive cluster approach over
dynamically updated previous crop information for improving the decision making process. On the other hand, the performance efficiency was not properly analyzed.
Silas & Nderu [10] proposed a prediction of tea yield by using clustering and association rule mining in Kenya. In this system, K-means clustering method was used for clustering the dataset based on the particular attributes. After that, the association rule mining was applied for establishing the relationship between the variables according to their occurrence rate. At last, the yield prediction was achieved by assigning weights to those variables. Conversely, clustering was mainly depending upon the primary cluster centroid estimation.
Mishra et al. [11] focused on implementing crop yield prediction system using data mining techniques and analyzed on agricultural dataset. For prediction, various classifiers such as J48, Locally Weighted Learning (LWL), Logical Analysis of Data (LAD) tree and Instance Based K-nearest neighbor (IBK) were used and then the performance of each classifier is compared by using WEKA tool. However, it requires ensemble classifier model to further increase the prediction accuracy.
From these related works on crop yield prediction algorithms, it is addressed that still there are different challenges existing in predicting the crop yield quality. Which Naive Bayes (NB) and K-Nearest Neighbor (KNN) techniques were applied to only a small dataset was utilized in this analysis. In MapReduce program the complexity of this algorithm was high and also it was time-consuming. Due to these limitations, associate degree improvement on crop yield prediction is usually required.
III. PROPOSED METHODOLOGY
In this section, the crop yield is predicted using KHDMCNeupper classifier. Initially, different soil parameters of crops such as coconut (ct), sorghum (sm) and groundnut (gt) are gathered and the most relevant soil parameters are selected based on the KH algorithm. After that, RS theory with a decision matrix P (pRijR, i=1, 2,…,m; j=1,2…n) where m denotes the number of crops to be considered and n denotes the number of soil parameters. Each row of the decision matrix is allocated to any one crop and each column to one parameter. Therefore, an element pRijR of the decision matrix indicates the quality of ithPPcrop with respect to jP
th
P
www.ijiset.com
222
training and testing dataset. The training dataset isgiven to the DNeupper classifier as input to learn the soil parameters. Finally the testing dataset is
used to predict the crop yield based on the learned soil parameters. The proposed process flow is described in Figure 3.
Fig. 3 Process of KHDMCNeupper Crop Yield Prediction
A. Yield Prediction
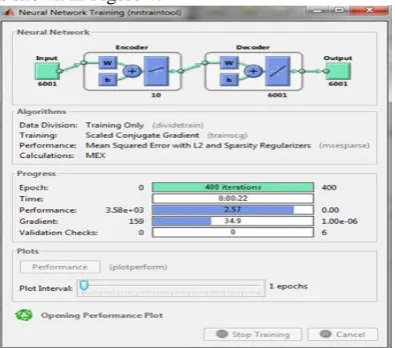
In this phase, each soil parameters in the collected training dataset is given to the KHDMCNeupper classifier [5] to predict the quality of yield. Initially, all the parameters are applied to the KH optimization algorithm to select the most optimal soil parameters for all the considered crops. Then, the relative weights of the selected soil parameters are calculated by RS theory. Once relative weights are computed, the above mentioned values are together with the ct, sm, gt soil parameter values in order to obtain the result values. The result values of soil parameters are given as input to the DNeupper classifier that generates the classification rules for all three crops efficiently. According to the generated rules, the quality of coconut, sorghum and groundnut yields i.e., low, medium and high is predicted with the highest accuracy. KHDMCNeupper classifier for given soil dataset is shown in Figure 4.
Fig. 4 (a) Screenshot for Training KHDMCNeupper Classifier
Fig. 4 (b) KHDMCNeupper Screenshot for Crop Yield Prediction
IV. RESULTS AND DISCUSSION
In this section, the performance efficiency of KHDMCNeupper classifier is evaluated and compared with the KHDNeupper classifier by using MATLAB 2018a. This experiment is carried out by using the collected dataset from Soil Testing Laboratories for coconut, sorghum and groundnut crops. The comparison is prepared in terms of precision, recall, f-measure and accuracy which are described as follows:
• Precision: It is calculated based on the yield prediction at True Positive (TP) and False Positive (FP) rates.
Training Dataset
Testing Dataset
DNeupper Classifier
Prediction Result Performance
Evaluation
KH-based Feature Selection Soil
Parameter Dataset
www.ijiset.com
223
𝑃𝑟𝑒𝑐𝑖𝑠𝑖𝑜𝑛=𝑇𝑃+𝐹𝑃𝑇𝑃 (1)
• Recall: It is calculated based on the yield prediction at TP and False Negative (FN) rates.
𝑅𝑒𝑐𝑎𝑙𝑙=𝑇𝑃+𝐹𝑁𝑇𝑃 (2)
• F-measure: It is computed by using both precision and recall as:
𝐹 − 𝑚𝑒𝑎𝑠𝑢𝑟𝑒= 2∙ �𝑃𝑟𝑒𝑐𝑖𝑠𝑖𝑜𝑛+𝑅𝑒𝑐𝑎𝑙𝑙𝑃𝑟𝑒𝑐𝑖𝑠𝑖𝑜𝑛∙𝑅𝑒𝑐𝑎𝑙𝑙� (3)
• Accuracy: It is the fraction of TP and True Negative (TN) to the sum of amount of cases examined. It is computed as follows:
𝐴𝑐𝑐=𝑇𝑃+𝑇𝑁+𝐹𝑃+𝐹𝑁𝑇𝑃+𝑇𝑁 (4)
Table III shows the comparison of performance metrics for both proposed and existing crop yield prediction methods for three different crops such as coconut, sorghum and groundnut.
TABLE III COMPARISON OF PERFORMANCE METRICS
Metr ics
KHDNeupper KHDMCNeupper
Coco nut
Sorg hum
Groun dnut
Coco nut
Sorg hum
Groun dnut 𝐴𝑐𝑐
(%)
96.5 97.5 97.2 97.3 98.6 98.1
Preci sion
0.93 44
0.952 1
0.991 0.97
51 0.990
1
0.980
Recal l
0.93 42
0.952 0.9523 0.97
54
0.990 0.9802
F-meas
ure 0.93
43 0.972
1
0.9717 0.97
4
0.990 0.9801
Fig. 5 Comparison of Precision
Fig. 5 shows the comparison of precision for proposed KHDMCNeupper and existing KHDNeupper classifier. In the graph, different crops such as coconut, sorghum and groundnut are considered in the x-axis and the value of precision is taken in the y-axis. From the analysis,
it is observed that KHDMCNeupper classifier has high precision than the KHDNeupper. For example, the precision of KHDMCNeupper for coconut, sorghum and groundnut is 4.41%, 3.99% and 1.11% higher than KHDNeupper classifier, respectively.
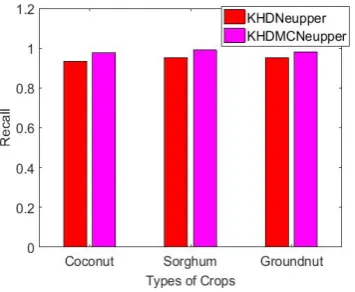
Fig. 6 Comparison of Recall
Fig. 6 shows the comparison of recall for KHDNeupper and proposed KHDMCNeupper. In the graph, different crops such as rice, wheat and maize are considered in the x-axis and the value of recall is taken in the y-axis. From the analysis, it is observed that KHDMCNeupper classifier has high recall than the KHDNeupper. For example, the recall of KHDMCNeupper for coconut, sorghum and groundnut is 4.36%, 3.99% and 2.93% higher than KHDNeupper classifier, respectively.
Fig. 7 Comparison of F-measure
www.ijiset.com
224
0.89% higher than KHDNeupper classifier,respectively.
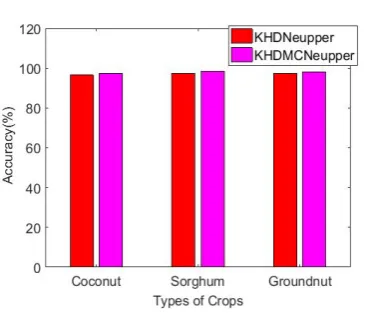
Fig. 8 Comparison of Accuracy
Fig. 8 shows the comparison of accuracy for KHDNeupper and proposed KHDMCNeupper. In the graph, different crops such as rice, wheat and maize are considered in the x-axis and the value of accuracy is taken in the y-axis. From the analysis, it is observed that KHDMCNeupper classifier has high accuracy than the KHDNeupper classifier. For example, the accuracy of KHDMCNeupper for coconut, sorghum and groundnut is 0.83%, 1.13% and 0.93% higher than KHDNeupper classifier, respectively.
V. CONCLUSION
In this article, a KHDMCNeupper classification method is proposed for crop yield prediction. By using this classification method, soil parameters of multiple crops can be trained efficiently to predict their quality of yield in terms of low, medium and high. As a result, training efficiency and the prediction accuracy of predicting the multiple crops yield simultaneously using a single classification method is improved compared to the training of each type of crop independently. Thus, it is concluded that this KHDMCNeupper classifier can be incredibly supportive in real-time agricultural applications with the highest performance compared to the other classification methods.
REFERENCES
[1] P. Priya, U. Muthaiah and M. Balamurugan, “Predicting
yield of the crop using machine learning algorithm,” Int. J. Eng. Sci. Res. Technol., vol. 7, no. 4, pp. 1-7, 2018.
[2] S. Manimekalai and K. Nandhini, “Crop yield prediction
from soil parameters through Neupper rule established algorithm,” Int. J. Eng. Technol., vol. 7, no. 3.34, pp. 908-912, 2018.
[3] S. Manimekalai and K. Nandhini, “An imbalanced soil
data classification with optimized features for crop yield prediction,” in Int. Conf. Artif. Intell. Smart Grid and Smart City Appl., 2018.
[4] S. Manimekalai and K. Nandhini, “A dynamic neupper
classification-based crop yield prediction using class imbalanced optimal soil parameters,” J. Adv. Res. Dyn. Control Syst., vol. 10, pp. 2287-2293, 2018.
[5] S. Manimekalai and K. Nandhini, “A dynamic
multi-class neupper multi-classification for multiple crop yield prediction,” Int. J. Recent Technol. Eng., vol. 7, no. 6, pp. 1565-1570, 2019.
[6] M. Paul, S. K. Vishwakarma and A. Verma, “Analysis of
soil behaviour and prediction of crop yield using data mining approach,” in IEEE Int. Conf. Comput. Intell. Commun. Netw., pp. 766-771, 2015.
[7] S. Sahu, M. Chawla and N. Khare, “An efficient analysis
of crop yield prediction using Hadoop framework based on random forest approach,” in IEEE Int. Conf. Comput. Commun. Autom., pp. 53-57, 2017.
[8] U. K. Dey, A. H. Masud and M. N. Uddin, “Rice yield
prediction model using data mining,” in Int. Conf. Electr. Comput. Commun. Eng., pp. 321-326, 2017.
[9] P. P. Bhangale, Y. S. Patil D. D. Patil, “Improved crop
yield prediction using neural network,” IJARIIE, vol. 3, no. 2, pp. 3094-3101, 2017.
[10] N. M. Silas and L. Nderu, “Prediction of tea production
in Kenya using clustering and association rule mining techniques,” Am. J. Comput. Sci. Inf. Technol., vol. 5, no. 2, pp. 1-7, 2017.
[11] S. Mishra, P. Paygude, S. Chaudhary and S. Idate, “Use