SD – Miner : A Spatial Data Mining System
Page 563
SD
– Miner : A Spatial Data Mining System
Akhila Y.J., Akshaya Naik, Bhagyashree Hegde, Pooja Shetty, Mr. Krishna Mohan A.J.
[email protected], [email protected], [email protected], [email protected], [email protected]
Department of Computer Science and Engineering, K.V.G. College of Engineering, Sullia, India
Abstract--Influenced by the GIS technology, a vast
volume of bulk data have been stored known as spatial data, using the spatial data mining technique. In this paper we propose a new spatial data mining known as SD-Miner. It consists of three parts. They are graphical interface for input and output, the data storage module using DBMS, a data mining module for spatial data mining function. The system proposes about spatio-temporal data and clustering. In this paper, we take an example of Intel lab to show spatial data mining functions.
I. I
NTRODUCTIONAs the world, moving faster and faster, using all the new developed technologies a large no of data to be stored in a regular place with all the data to be stored in a uniform format. This is done by data mining technique. A type of data mining is spatial data mining technique. Using this technique, a new system is developed known as SD-Miner[1].
A large amount of data is stored for spatial data using the geography; they may be due to remote sensing, global positioning system etc. Since, the characteristics between spatial data and the non-spatial data varies direct usage of any data incurs a difficulties so more studies have been towards spatial data mining [2].
There are no commercial tools available for spatial data mining, but there is a academic spatial data mining tool known as GeoMiner[3]. The commercial spatial data mining tool is based on spatial data functionalities. If we use a spatial data mining tool, that would be very helpful for spatial data mining applications.
A. Literature Survey
Literature survey is the process of making a study of the papers related to the system which we are proposing. We have done a brief study of following specified papers.
1) An expert system based on spatial data mining used decision tree for agriculture land grading:
The spatial data mining technique especially decision tree algorithm applying to agriculture land
grading. The idea is to combine spatial data mining/decision tree techniques with expert system techniques and apply them to establish an intelligent agriculture land grading information system. Also, an experiment is presented to show the particular advantages of this methodology in addressing problems in land grading such as missing land information, difficulties in quantitative analysis of factors.
2) The application of spatial data mining in railway geographic information systems: The spatial data
mining techniques are applied in railway geographic information systems (RGIS) through the systems' planning, design and implementation. We propose the concept of intelligent RGIS (IRGIS). An IRGIS uses intelligent spatial data mining to discover the association rules hidden in the vast amount of railway data.
3) Spatial data mining for highlighting hotspots in navigation routes: Rapid developments in the
availability and access to spatially referenced information in a variety of areas have induced the need for better analytical techniques to understand the various phenomena. In particular, the authors’ analysis is an insight into a wealth of geographical data collected by individuals as activity dairy data. In this paper, the authors explore the presence of clusters along the route, trying to understand the origins and motivations behind that to better understand the road network structure in terms of ’dense’ spaces along the network.
4) Research on spatial data mining technique applied in land use dynamic monitoring: The
reasonable carry on the development and exploitations of the land are the guarantees for keeping on the development, how to use remote sensing data to carry on land use dynamic monitoring fast.
5) Geospatial data mining for market intelligence: 2000: This paper [4] introduces geospatial data
SD – Miner : A Spatial Data Mining System
Page 564
Systems. GIS and data mining are naturally synergistic technologies that can be synthesized to produce powerful market insight from a sea of disparate data. GIS technology has evolved far beyond the days of mainframe-plotted mapping systems.
6) Data structures for spatial data mining-2001:
This paper [5] deals with spatial data structures for indexing and with their usability for knowledge discovery in spatial data. Huge amount of data processed in spatial data mining (or in data mining generally) requires using some indexing structures to speed up the mining process. Typical data types and operations used in geographic information systems are described in this paper. Then basic spatial data mining tasks and some spatial data mining systems are introduced.
7) Online data mining services for dynamic spatial databases I: system architecture and client applications-2005: This paper [6] describes online
data mining services for dynamic spatial databases connected to environmental monitoring networks. These services can use Artificial Neural Networks as data mining techniques to find temporal relations in monitored parameters. The execution of the data mining algorithms is performed at the server side and a distributed processing scheme is used to overcome problems of scalability.
8) Geo-DMA: A novel system for spatial data mining-2008: Although a huge amount of remote
sensing data has been provided by Earth observation satellites, few data manipulation techniques and information extraction in large data sets have been developed. In this context, the present paper [7] aims to show a new system for spatial data mining, and two test cases applied to land use change in the Brazilian Amazon region. We present the operational environment named Geo-DMA, developed to implement such approach.
9) ACO based spatial data mining for traffic risk analysis-2010: The paper [8] results on a
geographical traffic (trend layer) spatial database show that our method has higher efficiency in performance of the discovery process and in the quality of trend patterns discovered compared to other existing approaches using non-intelligent results without any assistance by an analyst or statistician.
10) Using spatial data mining to discover the hidden rules in the crime data-2011: The aim of
this research [9] was to explore the possibilities of Oracle Spatial for spatial data mining. The amount
of crime data is increasing and needs modern and effective processing. The crime data contain both spatial and non-spatial part. It makes sense explore the crime data if there are some regional patterns. In our research the thematic crime data were offered by the Czech Police Headquarters.
11) Applying Spatial Data Mining for Watershed Site Selection to Perform Field Sampling: 2012
This study [10] presents a systematic site selection framework for a wide-range survey. Spatial data mining was used to delimit three classes of pollution potential areas. Results show that pollution samples highly correlate with the classified potentially contaminated areas. For example, most of the soil pollution and water pollution appear under the high potentially contaminated area (HPCA).
The number and size of the database are rapidly growing. For huge amount of data to be processed, this increases time to processes. This time requirement is reduced by mining process which wasn’t supported. It is considered a more complicated challenge than traditional mining because of the difficulties associated with analyzing objects with concrete existences in space and time.
In this paper we explain about a new spatial data mining tool known as SD-Miner. This SD-Miner will have much functionality. But, based on our interest SD-Miner shows interest towards spatial clustering and spatio-temporal data.
II.
P
ROPOSEDS
YSTEMWe are proposing spatial data mining system called SD-miner. SD-miner consists of huge spatial database in which data are in specific pattern. The pattern helps to identify the interesting and unknown data whereas in the traditional database, data aren’t in pattern and extraction of data takes place easily. But extraction of data from spatial database is difficult.
SD – Miner : A Spatial Data Mining System
Page 565
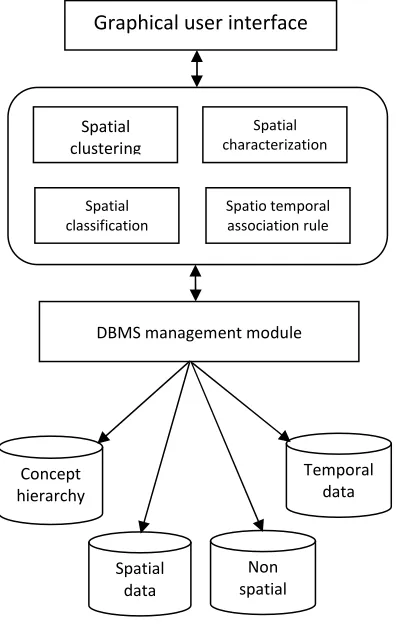
SD-Miner is composed of three main parts geographical user interface (GUI), Spatial data mining module and it has 4 functionalities namely spatial clustering, spatial characterization, spatial classification and spatio-temporal association rule. Data storage module (also called as, DBMS Management module).
Fig. 1. Architecture of SD-Miner.
A. Graphical User Interface(GUI)
The GUI parts gets user input variable for mining, transfers them to the SD-Miner module and shows the mining results as table, chart and map. They have different inputs and different result representations.
B. Spatial Data Mining System
The SD-Miner module processes respective data mining functions and transfers the result to the data storage model.
Spatial data mining module consists of four functionalities spatial clustering, spatial classification, spatial characterisation, spatio-temporal association rule.
1) Spatial Clustering: Spatial clustering classifies
spatial objects as multiple groups according to its positional or geographical characteristics. They
make clusters between minimal distances between spatial objects. If the distance between the object is smaller than some user predefined distance the two objects are included as an eps- neighbour. If the number of objects in an eps- neighbour is more than the predefined threshold, the objects are managed in the same cluster. The spatial objects which are not defined within the cluster are called noises. Clustering is done according to Euclidian distance formula: assume S1(X1,Y1) and S2(X2,Y2)
are two points with X,Y co-ordinates. The distance between S1 and S2 is given by Equation 1 and the
clustering is formed within the nodes using the Equation 1.
Distance = √ ((X2-X1)2 + (Y2-Y1)2) (1)
Along with the Equation 1 we make use of eps value to specify range of the clusters.
2) Spatio-Temporal Association Rule: In
spatio-temporal association rule, we represent the spatial and non-spatial objects using topological information and the distance relationship.SD-Miner uses spatio-temporal association rule that explains about temporal association .
In spatio-association temporal association rule the data are stored according to the concept hierarchy manner. Here, we can abstract information about the hierarchy of the database.
C. Database Management Module
The data management module consists of concept hierarchies, spatial data, non-spatial data and temporal data.
1) Concept hierarchies: The data within the
database are set according to the hierarchal order. They will discover new patterns.
2) Spatial data: The data which includes
information about geographical set is set to be spatial data. Spatial objects are not only composed of general attributes represented as text, but also spatial attributes such as point, line and surface of two or three dimensional space.
3) Non-Spatial Data: The data which excludes the
features of spatial data are called non-spatial data.
4) Temporal data: Data which have topological
information is called topological data.
We have taken an Intel Berkeley Laboratory as an example for our SD-Miner system.
Graphical user interface
Spatial clustering
Spatial characterization
Spatial classification
Spatio temporal association rule
DBMS management module
Concept hierarchy
Spatial data
Non spatial
SD – Miner : A Spatial Data Mining System
Page 566
As we all know spatial data holds the bulk data. The data consist of lab’s temperature, humidity, light, voltage, date and time. There is almost about 23lakhs data. Based on this data we can adjust the coolers inside the laboratory. As we all know, a lab contains a different sections they may be kitchen, control room, and many other. And in each room one has to maintain constant topological information. Each room will have its own characteristics and features, so it will be quite difficult for the lab authority to set the temperature, humidity, light and voltage manually. So we take help of a SD-Miner. This SD-Miner is capable of mining a large number of data. We have a data, of survey done in the month Feb. 28 to April 5th 2004 from Intel Berkeley Laboratory[11]. This data is used here. It contains all about 23lakhs data. Using this data we can maintain a constant temperature in the lab. The approximate temperature is sensed and the data retrieved from the database is set.
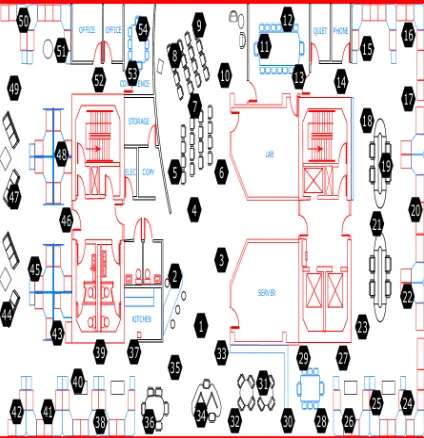
Fig. 2. Intel Laboratory.
The above figure 2 shows an Intel Berkeley Research lab with different sections in it, we also notice that how sensors are placed in different sections. The sensors are labelled with numbers 1, 2 and so on. There are 54 sensors deployed in it. These sensors collect the timestamp topology information, for about 31 seconds and set the coolers to appropriate condition.
There is no need of manual work in the lab to set the cooler. Everything will be done automatically. But as always the question arises, why do we have to maintain different criteria’s for different sections.
III
.P
ERFORMANCEA
NALYSISA
NDD
ISCUSSIONThe proposed system shows clustering and mining once the sensor senses the topological information. As we all know what is meant by clustering. In this case, the sections inside the laboratory with same features of humidity, temperature, light and voltage are clustered together. This clustering is shown using the sensors which is having the near eps values. The sensors not belonging to any clusters can be defined as noise. This is shown using the tables as shown in figure 3. There may be many clusters like c1, c2, c3 etc. These clustering can be shown with the help of graphical representation in figure 4.
SD – Miner : A Spatial Data Mining System
Page 567
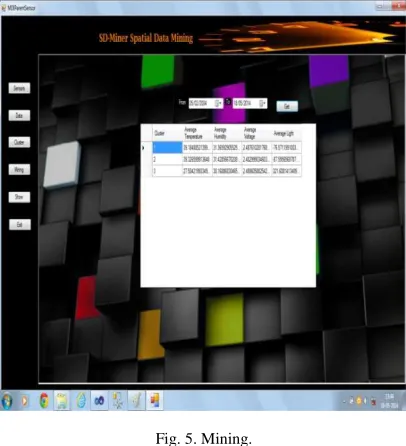
Fig. 4. Graphical representation of clusters.In this case we mine the data by giving the average temp, average humidity, average light, and average voltage values between the particular dates from today to until when we want. In our case we have stored the values from February 28th to April 5th of 2004. This value we got from the Intel Berkeley Laboratory.
Fig. 5. Mining.
In the above figure 5 mining of the data from database is shown.
The SD-Miner system uses an Intel laboratory to show its result. The database holds up to 23lakhs data of an Intel laboratory consisting of temperature, humidity, light and voltage surveyed
from February 28th to April 5th of 2004. These values are mined from our SD-Miner system. The clustering is done between the sensors.
IV
.C
ONCLUSIONIn this paper, we mostly explain about the spatial clustering and the spatio-temporal association rule. SD-Miner is not only used for laboratory it can be also used for many other purposes effectively. It can include many other parameter like points, line etc. In this paper, we have used parameter like temperature, humidity, voltage and light. Mainly, SD-Miner is used to mine data’s from bulk data in a confined manner.
R
EFERENCES[1] Duck-Ho Bae, Ji-Haeng Baek, Hyun- Kyo Oh, Ju-Won Song, Sang-Wook Kim, “SD-Miner: A Spatial Data MiningSystem”, IC-NID 2009.
[2] M. Ester et al, “Algorithm for Characterization
databases and Trend Detection in Spatial
Databases,” In Proc. Int’l. Conf. on Knowledge Discovery and Data Mining, KDD, pp.44-50, 1998. [3] J.Han, K. Koperski and N. Stefanovnic, “GeoMiner:
A System Prototype for Spatial Data Mining,” In Proc. ACM Int’l. Conf. on Management of data,
ACM SIGMOD, pp. 553-556, 1997.
[4] PetrKuba, FIMU-RS-2001-05, Copyrightc 2001, FIMU.
[5] Manuel Costa, Inês Sousa, Alexandra Fonseca,
Diana Henriques, Paulo Rosa,Ivan Franco,
NunoCapeta, Luís Teixeira, Jorge Cardoso and Vasco Carvalho, II International Conference and Exhibition on Geographic Information, Estoril Congress Center, May 30- June 2, 2005.
[6] Thales SehnKorting, Leila Maria Garcia Fonseca Maria Isabel SobralEscada, Felipe Castro da Silva,Image Processing Division, National Institute for Space Research – INPE.
[7] Ravikumar K. and Gnanabaskaran A, International Journal of Computational Intelligence, ISSN: 0976–0466 & E-ISSN: 0976–0474 Volume 1, Issue 1, 2010, PP-06-13.
[8] Karel, JANEČKA1, Hana, HŮLOVÁ1, GIS
Ostrava2011, 23. – 26. 1. 2011, Ostrava.
[9] Yen - Jen Lee, Cheng-Mau Wu, Andy I-Fu Shen, Kuo Chyang Chang, Jet-ChauWen,
Ginn-YeinChen, Journal: Environmental
Forensics-ENVIRON FORENSICS , vol. 13, no. 3, pp. 238-247, 2012.
[10] K. Koperski and J.Han, “Discovery of spatial Association Rules in Geographic Information Databases,” In proc. Int’l. Symp. On Advances in Spatial Databases, SSD, pp. 47-66,1995.