Secure multi-party data analysis: end user
validation and practical experiments
Dan Bogdanov1, Liina Kamm1,2, Sven Laur2, Pille Pruulmann-Vengerfeldt3
1
Cybernetica, M¨aealuse 2/1, 12618 Tallinn, Estonia {dan,liina}@cyber.ee
2
University of Tartu, Institute of Computer Science, Liivi 2, 50409 Tartu, Estonia [email protected]
3 University of Tartu, Institute of Journalism, Communication and Information Studies, Lossi 36, 51003 Tartu, Estonia
Abstract. Research papers on new secure multi-party computation pro-tocols rarely confirm the need for the developed protocol with its end users. One challenge in the way of such validation is that it is hard to explain the benefits of secure multi-party computation to non-experts. We present a method that we used to explain the application models of secure multi-party computation to a diverse group of end users in several professional areas. In these interviews, we learned that the potential users were curious about the possibility of using secure multi-party computa-tion to share and statistically analyse private data. However, they also had concerns on how the new technology will change the data analysis processes. Inspired by this, we implemented a secure multi-party com-putation prototype that calculates statistical functions in the same way as popular data analysis packages like R, SAS, SPSS and Stata. Finally, we validated the practical feasibility of this application by conducting an experimental study that combined tax records with education records.
1
Introduction
Secure multi-party computation (SMC) has been researched and developed for several decades. For years, SMC was rightfully considered too inefficient for practical use. However, in recent years, several fast implementations have been developed [2, 8]. Still, this powerful secure data manipulation tool has not become as popular in practice as one would hope. People have managed without such a technology for a long time and have replaced it with social solutions like non-disclosure agreements and hoped that their shared data is kept safe by their partners. Alternatively, they have legally been forbidden to do shared analysis.
At first, we directed our attention to the potential end users of SMC. We interviewed several stakeholders from a variety of fields to find out whether data holders see a need for this technology. As previous research has indicated, a serious obstacle in user-driven innovation and involving users in the early stages of development work is the problem of explaining such a complex technology to the end-user who is rarely an expert [15, 23].
In order to overcome the communication challenge, we decided to describe SMC visually. Our aim was to make it understandable and accurate, without focusing on the mathematics behind SMC. Hence, in the models we designed to assist the interview process, SMC is essentially a black box and different stakeholders are shown to communicate with this box. Each of these stakeholders has a set of roles that determines what that party is doing in the model.
We prepared 12 visual deployment models of SMC applications and used them to interview 25 people from across different fields. We asked them whether they can see a need for this technology in their field and what kind of social or cultural obstacles they see in implementing such technology. We also asked them to propose other fields that, in their opinion, could benefit from SMC.
The two most mentioned usage areas were statistical analysis and optimisa-tion of supply and demand. We reviewed existing literature and saw that research on cryptographically secure statistical analysis has largely been focused on pro-tocols for a particular function. We decided to find our whether general SMC can be efficient enough to support large-scale statistical data analysis.
Related work. To our knowledge, this is the first time that a study of this size has been conducted to determine the real-world need for SMC. However, there have been several efforts for implementing statistical functions.
Cryptographic primitives for evaluating statistical functions like mean, vari-ance, frequency analysis and regression were proposed in [7, 9]. Early implemen-tations of filtered sums and scalar products are described in [26]. Solutions based on secret sharing include a protocol for mean value proposed in [20, 19].
In 2004, Feigenbaumet al.proposed to use SMC for analysing faculty incomes in the annual Taulbee Survey [11]. The protocols designed for this study can be found in [1]. In 2011, Bogdanovet al.deployed SMC for financial data analysis for the Estonian Association of Information Technology and Telecommunications [3]. Kammet al.have shown how to conduct secure genome-wide association studies using secure multi-party computation [17].
Our contribution. We present a novel way for introducing SMC to non-cryptographers and report the results of interviews we conducted with potential end users of the technology. We analyse the responses of our interviewees and identify their main expectations toward SMC.
We describe the secure computation of statistical measures (mean, variance, standard deviation), frequency tables and quantiles. We show how to clean the data and apply custom filters. We give algorithms for privacy-preserving hypoth-esis testing using standard and paired t-tests,χ2-tests and Wilcoxon tests.
We implement all algorithms on the Sharemind SMC platform. We use these implementations to conduct a complete privacy-preserving study featuring statistical measure computation, filtering, database transformation, linking and statistical tests. Performance results are provided for all implemented operations.
2
End user validation methodology
2.1 Modelling SMC deployments
We define three fundamental roles in an SMC system—the input party I, the computation partyCand the result partyR. Input parties collect and send data to the SMC system. The SMC system itself is hosted by computation parties who carry out the SMC protocols on the inputs and send results to result parties in response of queries.
We use the following notation for modelling SMC applications. Let Ik = (I1, . . . ,Ik) be the list of input parties, Cm = (C1, . . . ,Cm) be the list of com-puting parties andRn= (R
1, . . . ,Rn) be the list of result parties. LetΠ be an SMC protocol for performing a specific task.
In the following,ICRrefers to a party that fills all three roles, similarly,IC refers to a party with rolesIandC. We use superscripts (k, m, n≥1) to denote that there are several parties with the same role combination in the system.
Real world parties can have more than one of these roles assigned to them. The set{I,C,R}has 7 non-empty subsets and there are 27 possibilities to com-bine them. However, we want to look only at cases where all three roles are present. This leaves us with 128−16 = 112 possible combinations. Not all of these make sense in a real-world setting, but we claim that all deployments of SMC can be expressed using these 112 combinations.
2.2 Visualisation of SMC deployment models
As our aim was to find out what stakeholders expect from SMC, we discussed SMC with people from different areas and asked them if they had had problems with sharing data in their field. We assumed that the interviewees did not have a background in computer science so approaching them with the usual SMC descriptions was out of the question.
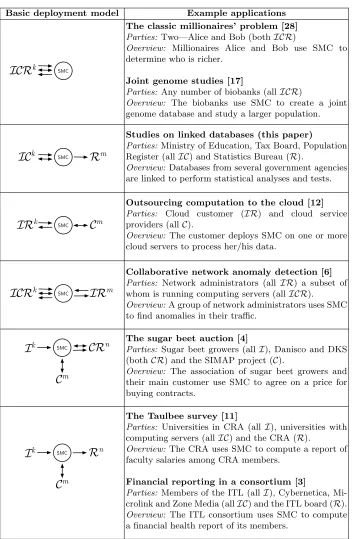
We planned to visualise typical SMC applications to make the idea under-standable. Fortunately, our role-based model translates easily into illustrative diagrams. See Table 1 for examples of deployment models inspired by published research on SMC applications.
Basic deployment model Example applications
I C R
k SMCThe classic millionaires’ problem [28]
Parties: Two—Alice and Bob (bothICR)
Overview: Millionaires Alice and Bob use SMC to determine who is richer.
Joint genome studies [17]
Parties: Any number of biobanks (allICR)
Overview: The biobanks use SMC to create a joint genome database and study a larger population.
I C
k SMCR
mStudies on linked databases (this paper)
Parties: Ministry of Education, Tax Board, Population Register (allIC) and Statistics Bureau (R).
Overview: Databases from several government agencies are linked to perform statistical analyses and tests.
I R
k SMCC
mOutsourcing computation to the cloud [12]
Parties: Cloud customer (IR) and cloud service providers (allC).
Overview: The customer deploys SMC on one or more cloud servers to process her/his data.
I C R
k SMCIR
mCollaborative network anomaly detection [6]
Parties: Network administrators (all IR) a subset of whom is running computing servers (allICR).
Overview:A group of network administrators uses SMC to find anomalies in their traffic.
I
k SMCCR
nC
mThe sugar beet auction [4]
Parties: Sugar beet growers (all I), Danisco and DKS (bothCR) and the SIMAP project (C).
Overview: The association of sugar beet growers and their main customer use SMC to agree on a price for buying contracts.
I
k SMCR
nC
mThe Taulbee survey [11]
Parties: Universities in CRA (all I), universities with computing servers (allIC) and the CRA (R).
Overview: The CRA uses SMC to compute a report of faculty salaries among CRA members.
Financial reporting in a consortium [3]
Parties: Members of the ITL (allI), Cybernetica, Mi-crolink and Zone Media (allIC) and the ITL board (R).
Overview: The ITL consortium uses SMC to compute a financial health report of its members.
designed large colourful and easily readable figures to help us describe SMC to stakeholders during the interviews. On these figures we did not use the ICR syntax, but rather real-world roles that the interviewee could relate to. The de-scription of each model included the security and trust guarantees that SMC provides for the parties. We could not include the figures here due to size con-straints, but they can be found in [25].
2.3 Interview process and results
Our sample of 25 people was designed with the aim to get as much diversity as possible. The interviewees were always given a possibility to propose additional fields outside of their own where this kind of technology could be beneficial. Not all of our interviewees could be considered potential users, some could rather be described as stakeholders with knowledge of a potential social barrier. For instance, among others, we interviewed a lawyer and an ethics specialist in or-der to unor-derstand the larger societal implications. The interviewees originated from six different countries, they came from academia, from both public and private sector organizations, from small and medium sized enterprises to large multinational corporations, from local government to state level. The people we interviewed included representatives from the financial sector, agriculture, retail, security, mobile technologies, statistics companies and IT in general.
We sent the materials to the interviewees beforehand to let them prepare for the interview. We also used the figures during the interview process to trigger conversation and to assist in understanding the principles of the technology. During the interviews, we asked whether our interviewees recognised situations in their field of expertise where they need to share protected data with others.
Of all the possible cases brought out in the deployment models, the cases concerning the use of databases from different data sources for performing statis-tical analysis were most discussed. It seems that the benefits of merging different databases for statistical analysis were easily comprehensible for the interviewees with different professional backgrounds. On the one hand, the interviewees had many concerns, such as SMC conflicting with the traditional ways of doing things and problems related to the existing legal and regulatory framework. At times, the interviewees could not distinguish between anonymisation and SMC, or un-derstand the operational challenges of using this kind of solution in practice. On the other hand, the interviewees also saw many potential benefits of the possible applications of SMC. They brought out examples how SMC could be advantageous in their professional field: for example, an expert working in the dairy industry said that there is a need to find a way to efficiently collect and analyse sensitive data concerning the activities of dairy companies as the studies form government research units do not fulfil the needs of the industry. Another example comes from biomedicine:
with names and national identification numbers and then I ask the medical cost records of those people. What I think is actually a really big security risk. If it would be possible to link them differently, so I would receive impersonalised data, that would be really good.” (I11, Academic sector, Biomedicine)
Several interviewees also pointed out how SMC could be used on a more gen-eral level. The idea of using different state databases for statistical analysis was seen as highly beneficial. For instance, an official working in a state institution that coordinates the work of the national information system stated that making more data and information available for public use is a relevant problem.
“After the presentation I thought that the state data should be made available for people this way: for researches, statisticians, universities. Publishing this data has always been a topic in the state, all the data has to be public, we should put it on the cloud or somewhere else. But do it in a secure way, I haven’t thought about it before, but it seemed to me that there were no good solutions.” (I8, Public sector, IT security)
Interestingly, interviewees whose work involves data processing remained somewhat critical, mostly because of the practical issues. Although an inter-viewee working in biomedicine saw the benefits of using different databases in scientific research, he also foresaw possible issues that could hinder their work. The main concern could be expressed as the necessity to “see” the data.
“But in the context of genetics, the researcher who does the calculations, he has to see the data. He has to understand tho data, because there the future work will be combined. You never take just means, but when you are already calculating genotypes and their frequencies, then you have to take into account some other factors all the time. Adjust them according to age, height, weight. And you need to see these data. Without understanding the data, you cannot analyse them.” (I11, Academic sector, Biomedicine)
This obviously raises the question as to what is actually meant by “seeing” and “understanding” the data. The visibility of the data seems to be crucial, but it does not necessarily mean that no alternative solutions or procedures are possible. The interviewees remarked that it would be possible to do scientific analysis without “seeing” the data but that it would make their work more com-plicated and therefore would be met with hesitation. Hence, it may be possible that the barrier here is the practiced and accepted way of doing things. Even now statistics offices often respond to data requests by disclosing sample databases that resemble the data so that researchers can script their queries.
However, the interviews also revealed that the visibility of data is necessary to guarantee their quality. This aspect was for instance stressed by an expert working in the Statistics Office. Similarly, the interviewee doing scientific re-search thought it possible that the quality of their work and data suffers if they do not have the full overview.
This quote illustrates nicely the way new technologies are understood first and foremost in the context of existing practices and boundaries. Similarly, peo-ple considering the importance of statistical analysis with SMC can imagine the activities they do in their current framework. Hence, statistical analysis comes down to finding means, comparing samples in valid ways, finding correlations and relationships within the data. And all this preferably with a user environ-ment that is recognisable. While, for instance, the Statistics Office employees can write their own scripts for queries, for wider usability, future SMC systems will need to be similar to existing tools.
2.4 Goal for practical validation
Based on the insights from the interviews, we decided to evaluate the feasibility of a statistical analysis tool based on SMC. We designed (and later implemented) SMC protocols that compute various statistical analysis functions. We set effi-ciency and reusability as our two main goals as both are critical for providing a user experience similar to that of popular statistics tools.
We decided to use an example scenario to help us select the statistical data analysis functions to implement in our experiments. This scenario is inspired by a problem faced by governments that have enacted data protection laws— how to evaluate the effect of state investments without breaching the privacy of individual citizens? More specifically, we consider a government that wants to learn the efficiency of its investments in the education system.
One way for assessing the quality of educational institutions is to analyse the incomes of their graduates. For a fair analysis, the Statistics Bureau has to combine data from the Tax Office, the Ministry of Education and the Pop-ulation Register. However, in some countries, laws prohibit the aggregation of citizen databases into a single database. Hence, the Statistics Bureau needs to maintain privacy throughout the analysis. First, data owners need a secure way for providing data. Second, the data analyst has to assess the distributions and quality of the data without seeing individual records. Third, the analyst must combine the data from three sources to an analysis database. Finally, he or she performs statistical tests to find the educational factors that have a significant impact on future income.
3
A security model for the analysis of private data
3.1 Privacy expectations and definitions
When describing SMC to potential end users, we focused on its outstanding privacy-preserving properties. Therefore, the main security goal in the proposed applications was that the private inputs of the input parties remain hidden from the computing parties and the result parties.
would be rather impractical. First, we would need to hide the sizes of all inputs from the computing parties. There are several techniques for hiding the input size (e.g., [13, 24]), but no generic solution exists and practical protocols often leak the upper bound of the size.
Second, we would need to hide all branching decisions based on the private inputs. While this can be done by always executing both branches and obliviously choosing the right result, we can significantly save resources when we perform some branching decisions based on published values. However, such behaviour can partially or fully leak the inputs to the computing parties (and also to the result parties, should they measure the running time ofΠ).
This directs us to a relaxed privacy definition, that allows the computing parties to learn the sizes of inputs and make limited branching decisions based on published values that do not directly leak private inputs. Finally, to support practical statistical analysis tasks, we also allow the result parties to learn certain aggregate values based on the inputs (e.g., percentiles). In a real-world setting, we prevent the abuse of such queries using query auditing techniques, that reject queries or query combinations that are extracting many private inputs.
Definition 1 (Relaxed privacy of a multi-party computation proce-dure). A multi-party computation procedure Π evaluated by parties Ik, Cm,
Rn preserves the privacy of the input parties if the following conditions hold:
Source privacy During the evaluation of Π, computing parties cannot asso-ciate a particular computation result with the input of a certain input party. Cryptographic privacy During the evaluation ofΠ, computing parties learn nothing about the intermediate values used to compute results, including the individual values in the inputs of input parties, unless any of these values are among the allowed output values of Π. As an additional exception, if a computing party is also an input party, it may learn the individual values in the input of only that one input party.
Restricted outputs During the evaluation ofΠ, the result parties learn noth-ing about the intermediate values used to compute results, includnoth-ing the in-dividual values in the inputs of input parties, unless any of these values are among the allowed outputs of Π. Additionally, if a result party is also an input party, it may learn the input of only that one input party.
Output privacy The outputs of Π do not leak significant parts of the private inputs.
3.2 Implementing private data analysis procedures with SMC
We now describe general guidelines for designing privacy-preserving algorithms that satisfy Definition 1.
Cryptographic privacy is achieved by using SMC protocols that collect and store inputs in a protected (e.g., encrypted, secret-shared) form. This prevents the computing parties from recovering private inputs on their own. Furthermore, the protection mechanism must be maintained for private values throughout the algorithm execution. The computing parties must not remove the protection mechanism to perform computations. Examples of suitable techniques include homomorphic secret sharing, homomorphic encryption and garbled circuits.
Restricting outputs is quite straightforward. First, the computing parties must publish to other parties only the result values that Π allows to publish. Everything else must remain protected. Trivially, it follows that the computing parties must run only the procedures to which the computational parties have agreed. Furthermore, the computing parties must reject all queries from the result parties that the computing parties have not agreed to among themselves. Output privacy is the most complex privacy goal, requiring a more creative approach. The most complex part in algorithm design is to control the leakage of input value bits through published outputs. There are many measures for this leakage, including input entropy estimation and differential privacy [10]. Regardless of the approach, the algorithm designer must analyse the potential impact of publishing the results of certain computations. In some cases, such an analysis is straightforward. For example, publishing the results of aggregations like sum and mean is a negligible leak unless there are only a few values.
Typically, directly publishing a value from the private inputs should not be allowed. However, there are exceptions to this rule. For example, descriptive values, such as the minimal value in a private input, are used by statisticians to evaluate data quality. The main concern of data analysts in our interviews was that if we take away their access to individual data values, we need to give them a way to get an overview of the data in return. That is the reason why our privacy model allows the publishing of descriptive statistics.
4
Privacy-preserving algorithms for statistical analysis
4.1 Data import and filtering
We present a suite of privacy-preserving algorithms for statistical data analysis that are private according to Definition 1. The algorithms described are not dependent on any particular protection method. However, we assume that the protection method provides privacy-preserving primitive operations required by the algorithm. We describe one example implementation in Section 5.
When collecting data from several input parties, a common data model has to be agreed upon and key values for linking data from different parties have to be identified. For efficiency, it is often useful to preprocess and clean data at the input parties before sending it to computing parties. This will not compromise data privacy as the data will be processed by the input party itself. We now look at how to filter and clean data once it has been sent to the computing parties.
Encoding missing values. Sometimes, single values are missing from the im-ported dataset. There are two options for dealing with this situation: we can use a special value in the data domain for missing values; or add an extra attribute for each attribute to store this information. Only one shared bit of extra data needs to be held per entry. Let the availability mask [[available(a)]] of vector [[a]] contain 0 if the corresponding value in the attribute [[a]] is missing and 1 other-wise. The overall count of records in storage is public. If missing elements exist, that value does not reflect the number of available elements and it is not possi-ble to make sure which elements are availapossi-ble by looking at the data. However, the count of available elements can be computed by summing the values in the availability mask.
Evaluating filters and isolating filtered data. To filter data based on a condition, we compare each element in the the corresponding private attribute vector [[a]] to the filter value in a privacy-preserving manner and obtain a private vector of comparison results. This mask vector [[m]] contains 1 if the condition holds and 0 otherwise. If there are several conditions in a filter, the resulting mask vectors are multiplied to combine the filters. Such filters do not leak which records correspond to the conditions. To learn the number of filtered records we find the sum of elements in the mask vector.
Most of our algorithms are designed so that filter information is taken into account during computations. However, in some cases, it is necessary to build a subset vector containing only the filtered data.
For obliviously cutting the dataset based on a given filter, first the value and mask vector pairs are obliviously shuffled, retaining the correspondence of the elements. Next, the mask vector is declassified and values for which the mask vector contains 0 are removed from the value vector. The obtained cut vector is then returned to the user. This process leaks the number of values that correspond to the filters that the mask vector represents. This makes cutting trivially safe to use, when the number of records in the filter would be published anyway. Oblivious shuffling ensures that no other information about the private input vector and mask vector is leaked [22]. Therefore, all algorithms that use oblivious cut provide source privacy.
4.2 Data quality assurance and visibility
Quantiles and outlier detection. Datasets often contain errors or extreme values that should be excluded from the analysis. Although there are many elaborate outlier detection algorithms like [5], outliers are often detected using quantiles. As no one method for computing quantiles has been widely agreed upon in the statistics community, we use algorithmQ7 from [16], because it is
the default choice in our reference statistical analysis package GNU R. Let p be the percentile we want to find and let [[a]] be a vector of values sorted in ascending order. Then the quantile is computed using the following function:
wherej=b(n−1)pc+ 1,nis the size of vector [[a]], andγ=np− b(n−1)pc −p. Once we have the index of the quantile value, we can use oblivious versions of vector lookup or sorting to learn the quantile value from the input vector.
We do not need to publish the quantile to use it for outlier filtering. Letq0 andq1 be the 5% and 95% quantiles of an attribute [[a]]. It is common to mark all values smaller than q0 and larger than q1 as outliers. The corresponding mask vector is computed by comparing all elements of [[a]] toQ7(0.05,[[a]]) and
Q7(0.95,[[a]]), and then multiplying the resulting index vectors. This way, data
can be filtered to exclude the outlier data from further analysis. It is possible to combine the mask vector with the availability mask [[available(a)]] and cache it as an updated availability mask to reduce the filtering load. Later, this mask can be used with the data attributes as they are passed to the statistical functions.
Descriptive statistics. As discussed in Section 2.3, one of the data analysts’ main concerns was that they will lose the ability to see individual values before analysing them. However, such access is not always needed and it is sufficient to have a range of descriptive statistics about the data attributes that help discover anomalies.
We claim, that given access to these aggregate values and the possibility to filter out outliers, we can ensure data quality without compromising the privacy of individual data owners. Indeed, the aggregated values of individual attributes leak information about inputs. However, the leakage is small and strictly limited to previously agreed aggregate values.
The most common aggregate for individual attributes is the five-number summary—a descriptive statistic that includes the minimum, lower quartile, me-dian, upper quartile and maximum of an attribute. We compute the five-number summary of a data vector using the previously discussed quantile formula. Based on the five-number summary and quantiles, box-plots can be drawn that give a visual overview of the data and effectively draw attention to outliers.
It is also important to see the distribution of a data attribute. For categorical attributes, this can be done by computing the frequency of the occurrences of different values. For numerical attributes, we must split the range into bins specified by breaks and compute the corresponding frequencies. The resulting frequency table can be visualised as a histogram. The algorithm publishes the number of bins and the number of values in each bin.
4.3 Linking multiple tables
4.4 Statistical testing
The principles of statistical testing. Many statistical analysis tasks con-clude with the comparison of different populations. For instance, we might want to know whether the average income of graduates of a particular university is significantly higher than that of other universities. In such cases, we first extract two groups—the case and control populations. In our example, the case popu-lation corresponds to graduates of the particular university in question and the control group is formed of persons from other universities. Note that a simple comparison of corresponding means is sufficient as the variability of income in the subpopulations might be much higher than the difference between means.
Statistical tests are specific algorithms, which formally quantify the signif-icance of the difference between means. These test algorithms return the test statistic value that has to be combined with the sizes of the compared popula-tions to determine the significance of the difference. While we could also imple-ment a privacy-preserving lookup to determine this significand and prevent the publication of the statistic value, statisticians are used to including the statistic values and group sizes in their reports.
The construction of case and control populations. We first need to pri-vately form case and control groups before starting the tests. One option is to select the subjects into one group and assume all the rest are in group two, e.g., students who go to city schools and everyone else. Alternatively, we can choose subjects into both groups, e.g., men who are older than 35 and went to a city school and men who are older than 35 who did not go to a city school. These selection categories yield either one or two mask vectors. In the former case, we compute the second mask vector by flipping all the bits in the existing mask vector. Hence, we can always consider the version where case and control groups are determined by two mask vectors.
In the following, let [[a]] be the value vector we are testing and let [[m1]] and
[[m2]] be mask vectors for case and control groups, respectively. Then [[ni]] = sum([[mi]]) is the count of subjects in the corresponding population.
The tests need to compute the mean, standard deviation or variance of a a population. We do this by evaluating the standard formulae using SMC. For improved precision, these metrics should be computed using real numbers.
The algorithm for computing both t-tests is a straightforward evaluation of the respective formulae using SMC, preferably with privacy-preserving real number operations. Both algorithms only publish the statistic value and the population sizes.
Wilcoxon rank sum test and signed rank test. T-tests are formally ap-plicable only if the distribution of attribute values in case and control groups follows the normal distribution. If this assumption does not hold, it is appro-priate to use non-parametric Wilcoxon tests. The Wilcoxon rank sum test [14] works on the assumption that the distribution of data in one group significantly differs from that in the other.
A privacy-preserving version of the rank sum test follows the standard al-gorithm, but we need to use several tricks to achieve output privacy. First, we need a more complex version of the cutting procedure to filter the database, the cases and controls using the same filter. Second, to rank the values, we sort the filtered values together with their associated masks by the value column.
Similarly to Student’s paired t-test, the Wilcoxon signed-rank test [27] is a paired difference test. Often, Pratt’s correction [14] is used for when the values are equal and their difference is 0. In a privacy-preserving version of this algo-rithm, we again need to cut several columns at once. We also need to obliviously separate absolute values and signs from the signed inputs values and later sort these two vectors by the sign vector.
The computation of both tests is simplified by the fact that most operations are done on signed integers and secure real number operations are not required before computing the final z-score statistic. Both algorithms only publish the statistic value and the population sizes.
The χ2-tests for consistency. If the attribute values are discrete such as
income categories then it is impossible to apply t-tests or their non-parametric counterparts and we have to analyse frequencies of certain values in the dataset. The corresponding statistical test is known asχ2-test.
The privacy-preserving version of theχ2-test is implemented simply by eval-uating the algorithm using SMC operations. The algorithm can be optimised, if the number of classes is small, e.g., two. The algorithm publishes only the statistic value and the population sizes.
5
Practical results
5.1 An experimental statistical study using SMC
Education, and a table of taxed income payments for the same subjects from the Tax Office. We used artificially generated data in our experiments.
For our implementation, we chose theSharemind SMC platform, because it supports operations needed in our implementation, including integer, boolean and floating point arithmetic, table join and sorting. We implemented the sta-tistical algorithms using theSecreCprogramming language. We uploaded data using a data importer application developed using the Sharemind controller library. Details of our implementation are given in Appendix A.
Sharemind provides cryptographic security against an honest-but-curious adversary. This is enough for performing statistical analysis on private databases held by organizations united by a common cause (e.g., government agencies, hospitals, companies). While our implementation is built on and optimised for Sharemind, our algorithms can be adapted to other secure computation systems with similar capabilities.
5.2 Performance measurements
We conducted the experiments on a Sharemind installation running on three computers with 3 GHz 6-core Intel CPUs with 8 GB RAM per core (a total of 48 GB RAM). While monitoring the experimental scenario, we did not notice memory usage above 500 MB per machine. The computers were connected using gigabit ethernet network interfaces.
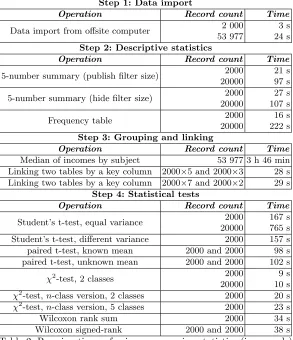
Table 2 contains the operations, input sizes and running times for our exper-imental scenario. We see that most operations in our experexper-imental study take under a minute to complete. The most notable exceptions is the group median computation, as median computation has to be applied to the payments of 2000 subjects. This time can be reduced by vectorising the median invocations or conduct this aggregation before the data is converted into secret-shared form.
To check scalability, we performed some tests on ten times larger data vectors. We found that increasing input data size 10 times increases running time about 5 times. Only histogram computation is actually slower, because it uses a more detailed frequency table for larger databases.
The improved efficiency per input data element is explained by the use of vectorised operations of the Sharemind framework. The operations in the Sharemindframework are more efficient when many are performed in parallel using the SIMD (single instruction, multiple data) model.
6
Conclusion
In this paper we presented an easy-to-visualise model for explaining the capa-bilities and deployment of SMC to end users. These models helped us conduct a series of interviews with potential stakeholders of SMC to learn how SMC could be valuable to them.
Step 1: Data import
Operation Record count Time
Data import from offsite computer 2 000 3 s
53 977 24 s
Step 2: Descriptive statistics
Operation Record count Time
5-number summary (publish filter size) 2000 21 s
20000 97 s
5-number summary (hide filter size) 2000 27 s
20000 107 s
Frequency table 2000 16 s
20000 222 s
Step 3: Grouping and linking
Operation Record count Time
Median of incomes by subject 53 977 3 h 46 min
Linking two tables by a key column 2000×5 and 2000×3 28 s Linking two tables by a key column 2000×7 and 2000×2 29 s
Step 4: Statistical tests
Operation Record count Time
Student’s t-test, equal variance 2000 167 s
20000 765 s
Student’s t-test, different variance 2000 157 s
paired t-test, known mean 2000 and 2000 98 s
paired t-test, unknown mean 2000 and 2000 102 s
χ2-test, 2 classes 2000 9 s
20000 10 s
χ2-test,n-class version, 2 classes 2000 20 s
χ2-test,n-class version, 5 classes 2000 23 s
Wilcoxon rank sum 2000 34 s
Wilcoxon signed-rank 2000 and 2000 38 s
Table 2: Running times of privacy-preserving statistics (in seconds)
privacy-preserving versions of several statistical functions. As a result, were able to conduct a full-scale experimental statistical study so that confidential data were always processed using SMC.
The strengths of our solution are generality, precision and practicality. First, we show that secure multi-party computation is flexible enough for implementing complex applications. Second, our use of secure floating point operations makes our implementation more precise. Third, we use the same algorithms as popular statistical toolkits like GNU R without simplifying the underlying mathematics.
Acknowledgements
received funding from the European Union Seventh Framework Programme (FP7/2007-2013) under grant agreement no. 284731.
The authors wish to thank the interviewees for their time and cooperation and the Estonian Center for Applied Research for their help in generating the artificial data used in the experiments of this paper.
References
1. Gagan Aggarwal, Nina Mishra, and Benny Pinkas. Secure computation of the median (and other elements of specified ranks). Journal of Cryptology, 23(3):373– 401, 2010.
2. Dan Bogdanov, Margus Niitsoo, Tomas Toft, and Jan Willemson. High-performance secure multi-party computation for data mining applications. In-ternational Journal of Information Security, 11(6):403–418, 2012.
3. Dan Bogdanov, Riivo Talviste, and Jan Willemson. Deploying secure multi-party computation for financial data analysis (short paper). InProceedings of FC 2012, pages 57–64, 2012.
4. Peter Bogetoft, Dan Lund Christensen, Ivan Damg˚ard, Martin Geisler, Thomas P. Jakobsen, Mikkel Krøigaard, Janus Dam Nielsen, Jesper Buus Nielsen, Kurt Nielsen, Jakob Pagter, Michael I. Schwartzbach, and Tomas Toft. Secure Mul-tiparty Computation Goes Live. InProceedings of FC 2009, pages 325–343, 2009. 5. Markus M. Breunig, Hans-Peter Kriegel, Raymond T. Ng, and J¨org Sander. Lof: Identifying density-based local outliers. In Proceedings of CM SIGMOD 2000, pages 93–104, 2000.
6. Martin Burkhart, Mario Strasser, Dilip Many, and Xenofontas A. Dimitropou-los. SEPIA: Privacy-Preserving Aggregation of Multi-Domain Network Events and Statistics. InProceedings of USENIX 2010, pages 223–240, 2010.
7. Ran Canetti, Yuval Ishai, Ravi Kumar, Michael K. Reiter, Ronitt Rubinfeld, and Rebecca N. Wright. Selective private function evaluation with applications to private statistics. InProceedings of PODC 2001, pages 293–304. ACM, 2001. 8. Ivan Damg˚ard, Valerio Pastro, Nigel P. Smart, and Sarah Zakarias. Multiparty
computation from somewhat homomorphic encryption. InProceedings of CRYPTO 2012, volume 7417 ofLNCS, pages 643–662. Springer, 2012.
9. Wenliang Du, Shigang Chen, and Yunghsiang S. Han. Privacy-preserving multi-variate statistical analysis: Linear regression and classification. InProceedings of SDM 2004, pages 222–233, 2004.
10. Cynthia Dwork. Differential privacy. InProceedings of ICALP’06, volume 4052 of
LNCS, pages 1–12. Springer, 2006.
11. Joan Feigenbaum, Benny Pinkas, Raphael Ryger, and Felipe Saint-Jean. Secure computation of surveys. InEU Workshop on Secure Multiparty Protocols, 2004. 12. Craig Gentry. Fully homomorphic encryption using ideal lattices. InProceedings
of STOC 2009, pages 169–178. ACM, 2009.
13. Oded Goldreich and Rafail Ostrovsky. Software Protection and Simulation on Oblivious RAMs. Journal of the ACM, 43(3):431–473, 1996.
14. Myles Hollander and Douglas A Wolfe. Nonparametric statistical methods. John Wiley New York, 2nd ed. edition, 1999.
16. Rob J Hyndman and Yanan Fan. Sample quantiles in statistical packages. The American Statistician, 50(4):361–365, 1996.
17. Liina Kamm, Dan Bogdanov, Sven Laur, and Jaak Vilo. A new way to protect privacy in large-scale genome-wide association studies. Bioinformatics, 29(7):886– 893, 2013.
18. Gopal K Kanji. 100 statistical tests. Sage, 2006.
19. Florian Kerschbaum. Practical privacy-preserving benchmarking. InProceedings of IFIP TC-11 SEC 2008, volume 278, pages 17–31. Springer US, 2008.
20. Eike Kiltz, Gregor Leander, and John Malone-Lee. Secure computation of the mean and related statistics. In Procedings of TCC 2005, volume 3378 ofLNCS, pages 283–302. Springer, 2005.
21. Sven Laur, Riivo Talviste, and Jan Willemson. From Oblivious AES to Efficient and Secure Database Join in the Multiparty Setting. InProceedings of ACNS’13, volume 7954 ofLNCS, pages 84–101. Springer, 2013.
22. Sven Laur, Jan Willemson, and Bingsheng Zhang. Round-Efficient Oblivious Database Manipulation. InProceedings of ISC 2011, pages 262–277, 2011. 23. Christopher Lettl. User involvement competence for radical innovation. Journal
of engineering and technology management, 24(1):53–75, 2007.
24. Yehuda Lindell, Kobbi Nissim, and Claudio Orlandi. Hiding the input-size in secure two-party computation. Cryptology ePrint Archive, Report 2012/679, 2012. http://eprint.iacr.org/.
25. Pille Pruulmann-Vengerfeldt, Liina Kamm, Riivo Talviste, Peeter Laud, and Dan Bogdanov. Deliverable D1.1—Capability model. http://usable-security.eu/ files/D1.1.pdf.pdf, 2012.
26. Hiranmayee Subramaniam, Rebecca N. Wright, and Zhiqiang Yang. Experimental analysis of privacy-preserving statistics computation. InProceedings of SDM 2004, volume 3178 ofLNCS, pages 55–66. Springer, 2004.
27. Frank Wilcoxon. Individual Comparisons by Ranking Methods. Biometrics Bul-letin, 1(6):80–83, 1945.
28. Andrew Chi-Chih Yao. Protocols for Secure Computations (Extended Abstract). InProceedings of FOCS’82, pages 160–164. IEEE, 1982.
A
Implementation details
A.1 Data model and data flow
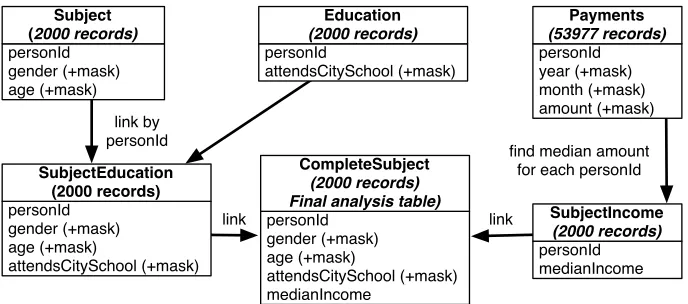
The data model and transformations are shown in Figure 1. All attributes that are marked as having a mask, actually represent two attributes—one with the value and another with the availability flag. After linking is complete, we use the CompleteSubject table to test statistical hypotheses.
A.2 Overview of implemented operations
personId gender (+mask) age (+mask)
Subject (2000 records)
personId
attendsCitySchool (+mask)
Education (2000 records)
personId year (+mask) month (+mask) amount (+mask)
Payments (53977 records)
personId medianIncome
SubjectIncome (2000 records)
find median amount for each personId
personId gender (+mask) age (+mask)
attendsCitySchool (+mask)
SubjectEducation (2000 records)
link by personId
personId gender (+mask) age (+mask)
attendsCitySchool (+mask) medianIncome
CompleteSubject (2000 records) Final analysis table)
link link
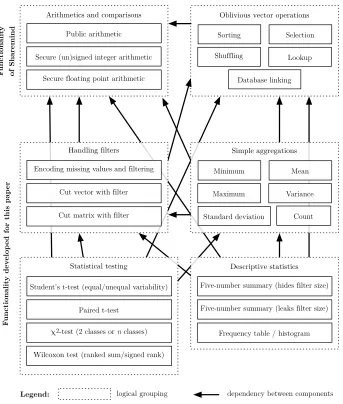
Public arithmetic
Secure floating point arithmetic Secure (un)signed integer arithmetic
Arithmetics and comparisons
Database linking Sorting Selection
Shuffling Lookup
Oblivious vector operations
Encoding missing values and filtering
Cut matrix with filter Cut vector with filter
Handling filters
Standard deviation
Minimum Mean
Maximum Variance
Count
Simple aggregations
Student's t-test (equal/unequal variability)
χ2-test (2 classes or n classes) Paired t-test
Wilcoxon test (ranked sum/signed rank)
Statistical testing
Functionalit
y
of Sharemind
Functionalit
y dev
elop
ed for this pap
er
dependency between components logical grouping
Legend:
Frequency table / histogram Five-number summary (leaks filter size)
Descriptive statistics
Five-number summary (hides filter size)