Clinical and Experimental Gastroenterology
Dove
press
M E t h o d o l o G y
open access to scientific and medical research
open Access Full text Article
Automated image analysis in the study of
collagenous colitis
Anne-Marie Kanstrup
Fiehn1,2
Martin Kristensson3
Ulla Engel4
lars Kristian Munck5,6
Susanne holck4
Peter Johan heiberg Engel1,6
1department of Pathology, Roskilde
hospital, Roskilde, 2department of
Pathology, Copenhagen University hospital, Rigshospitalet, Copenhagen,
3digital Pathology, Visiopharm,
hørsholm, 4department of
Pathology, Copenhagen University hospital, hvidovre, 5department of
Gastroenterology, Koege hospital, Koege, 6Faculty of health and Medical
Sciences, University of Copenhagen, Copenhagen, denmark
Correspondence: Anne-Marie Kanstrup Fiehn
department of Pathology, Copenhagen University hospital, Rigshospitalet, Frederik V’s Vej 11, 2100 Copenhagen, denmark
tel +45 3070 8392 Fax +45 4635 2983
Email anne-marie.kanstrup.fiehn.01@ regionh.dk
Purpose: The aim of this study was to develop an automated image analysis software to measure the thickness of the subepithelial collagenous band in colon biopsies with collagenous colitis (CC) and incomplete CC (CCi). The software measures the thickness of the collagenous band on microscopic slides stained with Van Gieson (VG).
Patients and methods: A training set consisting of ten biopsies diagnosed as CC, CCi, and normal colon mucosa was used to develop the automated image analysis (VG app) to match the assessment by a pathologist. The study set consisted of biopsies from 75 patients. Twenty-five cases were primarily diagnosed as CC, 25 as CCi, and 25 as normal or near-normal colonic mucosa. Four pathologists individually reassessed the biopsies and categorized all into one of the abovementioned three categories. The result of the VG app was correlated with the diagnosis provided by the four pathologists.
Results: The interobserver agreement for each pair of pathologists ranged from κ-values of 0.56–0.81, while the κ-value for the VG app vs each of the pathologists varied from 0.63 to 0.79. The overall agreement between the four pathologists was κ=0.69, while the overall agreement between the four pathologists and the VG app was κ=0.71.
Conclusion: In conclusion, the Visiopharm VG app is able to measure the thickness of a sub-epithelial collagenous band in colon biopsies with an accuracy comparable to the performance of a pathologist and thereby provides a promising supplementary tool for the diagnosis of CC and CCi and in particular for research.
Keywords: microscopic colitis, collagenous colitis, incomplete collagenous colitis, automated image analysis
Introduction
Since collagenous colitis (CC) was introduced in 1976 by Lindstrom,1 this entity has
evolved and now includes the related lymphocytic colitis (LC) and several variant forms under the umbrella term microscopic colitis (MC).2 The common characteristic
of MC is chronic watery diarrhea, a normal or near-normal endoscopy, and character-istic histopathological findings.2 Thus, histopathology is crucial for the diagnosis. The
incidence of MC has been rising, and MC accounts for ∼10% of the cases evaluated for chronic diarrhea.3 The highest incidence rates come from USA with an incidence of
21.2 per 105 inhabitants and Denmark with an MC incidence of 34.9 per 105 inhabitants
in 2014.4,5 This makes it more frequent than inflammatory bowel disease (IBD).6 Most
previous epidemiological studies have included only the traditional forms (CC and LC) and not the incomplete forms, incomplete CC (CCi) and incomplete LC (LCi).5
Bjørnbak et al estimated the incidence of incomplete MC (MCi) to 4.0/100.000.7
Clinical and Experimental Gastroenterology downloaded from https://www.dovepress.com/ by 118.70.13.36 on 20-Aug-2020
For personal use only.
Number of times this article has been viewed
This article was published in the following Dove Press journal: Clinical and Experimental Gastroenterology
Dovepress
Fiehn et al
The key histological feature of CC is an abnormally thick-ened subepithelial collagenous band measuring .10 µm, containing entrapped capillaries, red blood cells, and inflam-matory cells with an irregular appearance at the deeper border accompanied by a mixed inflammatory infiltrate in lamina propria. The surface epithelium may show various changes including detachment from the basal membrane, decreased number of goblet cells, and an increased number of intraepi-thelial lymphocytes. No, or only very little, irregularity of the crypts is seen. CCi shares the same clinical signs as CC but falls short of fulfilling the histopathological criteria for CC. The subepithelial collagenous band measures ,10 µm, but
.5 µm and the other histopathological findings may not be as pronounced.2 Thus, the difference between CC and CCi in
borderline cases is very subtle, and sometimes it can also be difficult to distinguish CCi from near-normal or even normal colonic mucosa. For both CC and CCi, it is of utmost impor-tance that the biopsies are well oriented, ie, cut perpendicular to the mucosal surface.8 The subepithelial collagenous band
is usually well visualized by hematoxylin and eosin (HE)-stained slides, but it is accentuated by using diverse collagen stains, e.g. Van Gieson (VG), Masson-Trichrome, Goldner, or the immunohistochemical staining for tenascin. This is especially pertinent in borderline cases.2,9
We have previously examined the diagnostic intra- and interobserver variability based on HE-stained slides and reported very good agreement when discriminating MC (CC + LC + MCi) from IBD and normal colonic mucosa. The agreement diminished when discriminating between the three subgroups of MC: CC, LC, and MCi, indicating that it may be difficult to discriminate between the three subgroups of MC when the diagnosis relies on HE only.10
Patients with CCi seem to benefit from medical treatment with the same response as patients with CC.7 In order to
obtain reliable clinical results, it is crucial to make sure that the histopathological diagnoses are consistent.
The aim of this study was to explore the possibility of developing automated image analysis software (an app) for diagnosing CC and CCi in an objective and reproducible manner and assist the pathologist in the discrimination in
borderline cases. Even more important, it could minimize interobserver variation in multicenter trials. A training cohort was included for the development of the app, and a study group was included to validate the results of the app. The results of the app were compared to the performance of the four pathologists.
Patients and methods
Patients and microscopic section
The material consists of a training cohort and study cohort. Ten cases consisting of five biopsies diagnosed as CC, three cases diagnosed as CCi, and two cases diagnosed as normal colonic mucosa were included in the training cohort. Two pathologists (A-MKF and PJHE) verified the primary diag-nosis. The study cohort included 75 patients, 25 patients each with a diagnosis of CC and CCi and a control group of 25 patients. The primary diagnosis of the patients in the control group comprised normal colonic mucosa (n=21) and nonspecific changes (n=4). The primary pathological diag-nosis and the clinical information on the pathology requisi-tion forms are shown in Table 1. The site of the biopsy was colon proximal to the rectum. Based on HE-stained slides retrieved from the archives of the Department of Pathol-ogy, Roskilde Hospital, one of the pathologists in the group (PJHE) selected one block from each of the patients, which was considered representative of the primary diagnosis. Both the training cohort and the study cohort comprised from one to four biopsies per patient. One slide was included per patient. The area of tangential sectioning varied from 0% to 50%. A 4 µm-thick section was cut, processed, and stained with VG using Tissue-Tek Prisma Automated Slide Stainer (Sakura, Copenhagen, Denmark) according to routine proto-cols (protoproto-cols can be provided by request). All slides were anonymized by a technician and numbered consecutively (1–75) in a random order.
histopathological evaluation of
VG-stained slides
Four pathologists reviewed the VG-stained slides indepen-dently. Two cases were excluded from the study, one due to
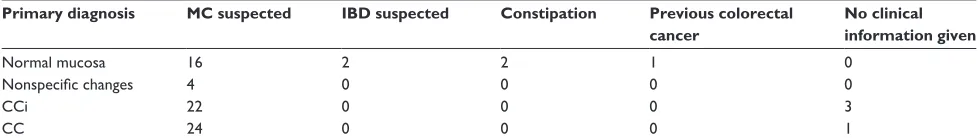
Table 1 Information provided by clinicians concerning clinically suspected diagnosis
Primary diagnosis MC suspected IBD suspected Constipation Previous colorectal cancer
No clinical information given
Normal mucosa 16 2 2 1 0
Nonspecific changes 4 0 0 0 0
CCi 22 0 0 0 3
CC 24 0 0 0 1
Abbreviations: CC, collagenous colitis; CCi, incomplete collagenous colitis; IBD, inflammatory bowel disease; MC, microscopic colitis.
Clinical and Experimental Gastroenterology downloaded from https://www.dovepress.com/ by 118.70.13.36 on 20-Aug-2020
Dovepress Collagenous colitis
too weak staining intensity, another case considered more likely LC by one of the pathologists, who refrained from its categorization. This left 73 cases for the analysis. These cases were assigned to one of the three diagnostic categories, CC, CCi, or normal/near-normal colonic mucosa, accord-ing to the abovementioned histopathological characteristics (Table 2).
digital analysis
All slides were scanned using a Nanozoomer HT 2.0 slide scanner from Hamamatsu Photonics (Hamamatsu, Japan), and subsequently the digital images were processed using Visiopharm’s Quantitative Digital Pathology software (Visio-pharm, Hørsholm, Denmark). The training cohort was used to develop the VG app, and the following steps were applied: 1. Identification of the biopsy material on the slides,
iden-tifying and excluding areas with tangential sectioning. The algorithm was obtained by manually outlining rep-resentative areas on the images. The region of interest was outlined (Figure 1).
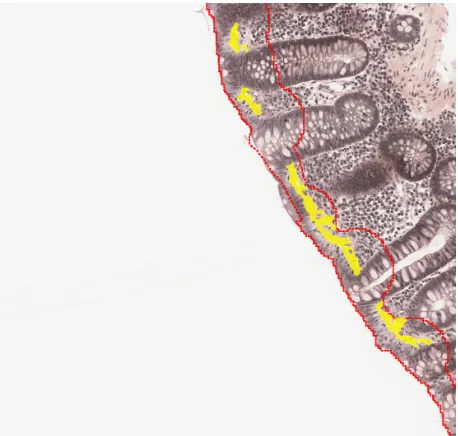
2. Analyzing the biopsies, ie, measuring the thickness of the collagenous band (Figure 2).
3. Comparing the results of the VG app with the primary histopathological diagnosis.
When the VG app performed sufficiently in relation to the training material, ie, the diagnosis assigned by the app matched the diagnosis assigned by the pathologists; the study material was scanned and diagnosed according to the same steps.
The first image processing step involves segregation of the tissue from the background. This was performed at 2× magnification, which was digitally created in the software, increasing processing speed. The image was segmented using a simple threshold classifier, on an intensity and 3,3′-diaminobenzidine color-deconvolution representation of the image. Following post-processing, the tissue was
segmented into one area containing surface epithelium, lamina propria, and the intermediate collagenous band and the remaining area containing all other tissue components.
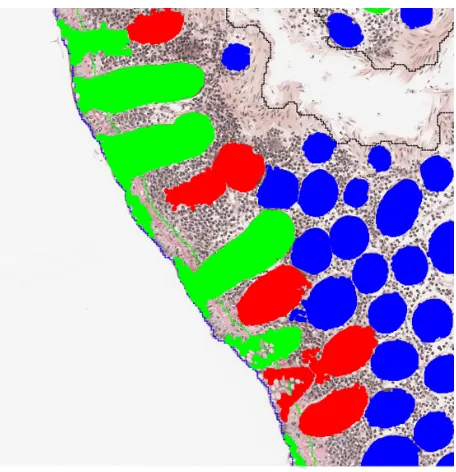
The identified areas were subsequently segmented with a Bayesian classifier at 5× magnification to identify crypts. Based on the size and shape of the crypts in a number of parameters (ratio of axis, convexity, and eccentricity), a heatmap (Figure 3) was created. Under the assumption that a tissue area sectioned perpendicular will have a high
Table 2 diagnostic categories and corresponding diagnostic criteria
CC CCi Nonspecific inflammatory changes or normal
thickness of collagenous band
.10 µm .5 µm, ,10 µm
#5 µm
lamina propria inflammation
++ ++/+ +/
-damage of surface epithelium
+ +/- +/
-Note:+, moderate inflammation; ++, heavy inflammation; -, not present
Abbreviations: CC, collagenous colitis; CCi, incomplete collagenous colitis.
Figure 1 Identification of the biopsy material on the slides, identifying and excluding areas with tangential sectioning.
Notes: the red outlined area is the region of interest for further analysis.
Figure 2 Analyzed biopsy with identified collagen band (highlighted in yellow).
Notes: the thickness is estimated from the covered area and the length of the sample, assuming a simple relationship between thickness, length, and area (A=L×T). Identified surface epitelium (between the red lines).
Clinical and Experimental Gastroenterology downloaded from https://www.dovepress.com/ by 118.70.13.36 on 20-Aug-2020
Dovepress
Fiehn et al
concentration of elongated crypts, these will be represented by a high probability in the heatmap. Similarly, an area with tangential sectioning will have a high concentration of rounded crypts, and therefore has a low probability in the heatmap. From the training set, the heatmap cutoff was manu-ally selected to give an optimal exclusion of areas sectioned tangentially to the mucosal surface and to identify the relevant areas for further analysis (Figure 4).
Finally, a high-resolution analysis was performed using a Bayesian classifier trained on preprocessing steps that highlight the difference in red chromaticity, the VG color-deconvolution representation of the image, and local linear objects. The local linear objects were identified on a VG color-deconvolution representation of the image using Visiopharms Polynomial Local Linear filter. This detects VG positive and negative areas and performs an automatic calculation of the thickness of the collagenous band.
The digital image analysis was repeated three times, on three different computers, to assess analysis reproducibility.
Statistical analysis
Agreement between each pair of the four pathologists and the VG app was evaluated by Cohen’s kappa (κ) statistics which is used to estimate the rate of agreement beyond what is expected by chance, where ,0.20, 0.21–0.40, 0.41–0.60, 0.61–0.80, and 0.81–1.00 are considered to reflect poor, fair, moderate, good, and very good agreement, respectively.11
Unweighted κ-values were chosen as being appropriate for this situation as the aim was to evaluate the ability of patholo-gists and app to discriminate between the three subgroups. It therefore seemed reasonable to consider the groups as independent with no groups having closer relationship to each other than others. Weighted κ-values would have resulted in higher degree of agreement. The unweighted kappa value is given with 95% confidence intervals and standard error. Fleiss κ-values were calculated for the overall agreement between all four pathologists and compared to the overall agreement when including the VG app as “the fifth observer.”
When developing the app using the training cohort, cutoff values that gate positive fraction into the diagnostic categories: CC, CCi, or normal/near-normal mucosa, were initially determined through optimization of Cohen’s κ, dividing normal mucosa from CC, and CCi. The statistical analyses were performed using Excel 2013.
Ethics
The Local Committee on Health Research Ethics and the Danish Data Protection Agency approved the study according to the Declaration of Helsinki and Danish law (permission no SJ-448 and Reg-64-2015). This ethical committee deemed that informed written consent did not have to be obtained according to Danish law.
Figure 3 heatmap generated from mucosa biopsy, showing the areas with highest probability of being sectioned perpendicular (warm colors), and areas with lowest
probability of being sectioned perpendicular (cold colors, ie, sectioned tangentially). Figure 4 Identified crypts used to estimate the orientation of the biopsy.
Notes: Green crypts are identified as being perpendicular, blue are tangential, and red with an unknown orientation.
Clinical and Experimental Gastroenterology downloaded from https://www.dovepress.com/ by 118.70.13.36 on 20-Aug-2020
Dovepress Collagenous colitis
Results
As shown in Table 3, the calculated κ-value for each pair of pathologists varies from 0.56 to 0.81 corresponding to moderate to very good agreement. The counted number of agreed cases for each pair of pathologists ranged from 52 to 64 (71.23%–87.67%). The κ-value for the VG app compared to each of the pathologists varies from 0.63 to 0.79 corre-sponding to good agreement. The number of agreed cases for each pair of pathologists and VG app ranged from 55 to 63 (75.34%–86.30%). Table 4 shows that the κ-value for all four pathologists and the VG app considered as the fifth observer is 0.69 and 0.71, respectively.
Figure 5 shows the thickness of the collagenous band measured by digitalized image analysis in biopsies catego-rized by the pathologists. Repetition of digital image analysis showed no significant difference.
Discussion
A growing proportion of mainly the elderly population is diagnosed with one of the subgroups of MC.12 The
symp-toms can be invalidating and can impair the quality of life.13 The disease is treatable with high remission rates,
although there are many relapses once the treatment is dis-continued.6,14 The pathogenesis of MC is largely unknown
although it seems likely that MC is a multifactorial dis-ease.2,15 The histopathology is of crucial importance in
diagnostics, and it is therefore mandatory that the criteria are reliable and reproducible.
Previous studies have shown that interobserver agreement is high when discriminating MC from IBD and normal colonic mucosa, but diminished when discriminating among the sub-groups.10,16 The emergence of MCi comprising CCi and LCi
has possibly made the discrimination even more difficult.10
The challenge with subgrouping MC is well known.7,17,18
Although digitalized image analysis of HE-stained slides has been optimized during the recent years, the technique is complicated. One of the major obstacles to quantitative analysis of HE images is the variability observed between different samples and different laboratories due to differences in fixation time, H:E ratio, section thickness, etc.19
Regard-ing CC, one further problem arises: while hematoxylin is expected to selectively stain the nuclei, eosin stains both the cytoplasm of most cells and the collagenous band. Hence, it was considered prudent to use slides stained by the VG method in this study. Thus, collagenous band stains intensely red, readily contrasting the colors of both epithelium and lamina propria. This quality has been utilized in digital image analyses for more than a decade.20
One previous study has explored the computer-aided measurement of the subepithelial collagenous band, and the results showed that the method was highly sensitive and specific. This study did not include patients with CCi, the pictures were captured at magnification ×40 and only this selected area was analyzed. In comparison, full slides were scanned and analyzed in this study.21
In this study, we found similar κ-values for each pair of the four pathologists vs each of the pathologists and the VG app. The κ-value for all the four pathologists was also similar to the κ-value of the four pathologists and the VG app. The results indicate that the digitalized image analysis provides a diagnosis similar to that of a pathologist. Furthermore, the image analysis has the advantage of consistency, ie, being highly reproducible. The app is able to separate normal or
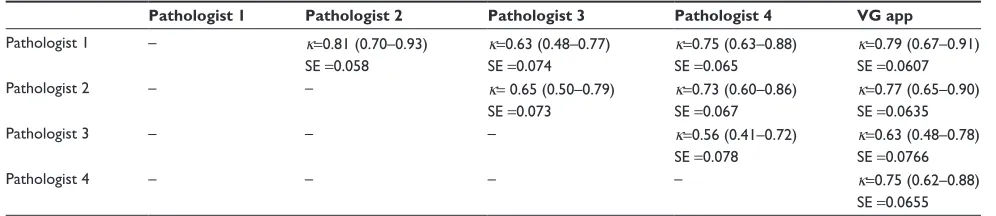
Table 3 Calculated Cohen κ values for each pair of pathologists and the VG app
Pathologist 1 Pathologist 2 Pathologist 3 Pathologist 4 VG app
Pathologist 1 – κ=0.81 (0.70–0.93)
SE =0.058
κ=0.63 (0.48–0.77) SE =0.074
κ=0.75 (0.63–0.88) SE =0.065
κ=0.79 (0.67–0.91) SE =0.0607
Pathologist 2 – – κ= 0.65 (0.50–0.79)
SE =0.073
κ=0.73 (0.60–0.86) SE =0.067
κ=0.77 (0.65–0.90) SE =0.0635
Pathologist 3 – – – κ=0.56 (0.41–0.72)
SE =0.078
κ=0.63 (0.48–0.78) SE =0.0766
Pathologist 4 – – – – κ=0.75 (0.62–0.88)
SE =0.0655
Note: Values in parenthesis represent the confidence interval.
Abbreviations:κ, kappa; SE, standard error; VG, Van Gieson.
Table 4 Calculated Fleiss kappa values for all pathologists vs all pathologists and the VG app
Pathologists κ = 0.69 (0.62–0.76) SE = 0.0340 Pathologists + VG app κ = 0.71 (0.66–0.76) SE = 0.0263
Note: Values in parenthesis represent the confidence interval.
Abbreviations:κ, kappa; SE, standard error; VG, Van Gieson.
Clinical and Experimental Gastroenterology downloaded from https://www.dovepress.com/ by 118.70.13.36 on 20-Aug-2020
Dovepress
Fiehn et al
near-normal mucosa from CCi with minimal overlap as shown in Figure 5. In comparison, distinguishing between CCi and CC is subject to more overlap. Although one might assume that the VG app is always correct in measuring the thickness of the collagenous band, it cannot replace the pathologists’ eye since the app does not take into account qualities other than the collagenous band. Thus, the patholo-gist also estimates the inflammatory infiltrate in lamina propria and damage of the surface epithelium which are mandatory histopathological changes in the diagnosis of CC.2
The aim of this study was to develop a VG app which could discriminate CC from CCi and normal/near-normal colonic mucosa. Applying a VG app for diagnosing CC and CCi would be an important contribution to obtain uniform assess-ments of biopsies recruited for multicenter trials. The digital slides can easily be stored, viewed, measured, and discussed22
regardless of geographic location of the laboratory, enabling the pathologists to accept or refute the automatic generated diagnosis. The digitized image analysis is objective and reproducible, thus eliminating observer variability. The drawback of this approach is the limited availability of the analysis, which requires specially trained technicians. In addition, automated methods will always be vulnerable to diverse lab technical issues such as staining and scanning, etc. Standardizing prior steps and optimizing, eg, the staining protocol to ensure a high contrast between collagen and the surrounding tissue, would improve the reliability and possibly performance of the image analysis. Furthermore, it should be recalled that only elements, which are programmed for, will be registered and analyzed.
Conclusion
A VG app for diagnosing and discriminating between CC, CCi, and near-normal or normal colonic mucosa was devel-oped. The results of the app are comparable to that of four trained pathologists. Currently, the app has the potential of being an important supplementary tool for research purpose. Application to daily practice must await further validation.
Disclosure
Martin Kristensson is an employee of Visiopharm. No finan-cial support has been received for this study. The other authors report no conflicts of interest in this work.
References
1. Lindstrom CG. ‘Collagenous colitis’ with watery diarrhoea – a new entity? Pathol Eur. 1976;11:87–89.
2. Langner C, Aust D, Ensari A, et al; Working Group of Digestive Dis-eases of the European Society of Pathology (ESP) and the European Microscopic Colitis Group (EMCG). Histology of microscopic colitis-review with a practical approach for pathologists. Histopathology. 2015;66:613–626.
3. Genta RM, Sonnenberg A. The yield of colonic biopsy in the evalu-ation of chronic unexplained diarrhea. Eur J Gastroenterol Hepatol. 2015;27:963–967.
4. Rasmussen J, Engel PJ, Wildt S, Fiehn AK, Munck LK. The temporal evolution of histologic abnormalities in microscopic colitis. J Crohns
Colitis. Epub 2015 Oct 31.
5. Tong J, Zheng Q, Zhang C, Lo R, Shen J, Ran Z. Incidence, prevalence, and temporal trends of microscopic colitis: a systematic review and meta-analysis. Am J Gastroenterol. 2015;110:265–276.
6. Stewart M, Andrews CN, Urbanski S, Beck PL, Storr M. The association of coeliac disease and microscopic colitis: a large population-based study. Aliment Pharmacol Ther. 2011;33:1340–1349.
7. Bjørnbak C, Engel PJ, Nielsen PL, Munck LK. Microscopic colitis: clini-cal findings, topography and persistence of histopathologiclini-cal subgroups.
0
Near normal CCi
Pathologists categorization Collagen thickness distribution
Collagen thickness by image
analysis
(
µ
m)
CC 2
4 6 8 10 12 14
Figure 5 the thickness of the collagenous band measured by digitalized image analysis compared to the diagnoses provided by the four pathologists.
Notes: horizontal lines represent median value, boxes 25%–75% intervals, and the vertical lines minimum and maximum values.
Abbreviations: CC, collagenous colitis; CCi, incomplete collagenous colitis.
Clinical and Experimental Gastroenterology downloaded from https://www.dovepress.com/ by 118.70.13.36 on 20-Aug-2020
Clinical and Experimental Gastroenterology
Publish your work in this journal
Submit your manuscript here: http://www.dovepress.com/clinical-and-experimental-gastroenterology-journal
Clinical and Experimental Gastroenterology is an international, peer-reviewed, open access journal, publishing all aspects of gastroenterology in the clinic and laboratory, including: Pathology, pathophysiology of gastrointestinal disease; Investigation and treatment of gastointes-tinal disease; Pharmacology of drugs used in the alimentary tract;
Immunology/genetics/genomics related to gastrointestinal disease. This journal is indexed on CAS. The manuscript management system is completely online and includes a very quick and fair peer-review system. Visit http://www.dovepress.com/testimonials.php to read real quotes from published authors.
Dovepress
Dove
press
Collagenous colitis
8. Lazenby AJ, Yardley JH, Giardiello FM, Bayless TM. Pitfalls in the diagnosis of collagenous colitis: experience with 75 cases from a reg-istry of collagenous colitis at the Johns Hopkins Hospital. Hum Pathol. 1990;21:905–910.
9. Anagnostopoulos I, Schuppan D, Riecken EO, Gross UM, Stein H. Tenascin labelling in colorectal biopsies: a useful marker in the diagnosis of collagenous colitis. Histopathology. 1999;34:425–431.
10. Fiehn AM, Bjørnbak C, Warnecke M, Engel PJ, Munck LK. Observer variability in the histopathologic diagnosis of microscopic colitis and subgroups. Hum Pathol. 2013;44:2461–2466.
11. Altman DG. Practical Statistics for Medical Research. London: Chapman and Hall; 2015.
12. Williams JJ, Beck PL, Andrews CN, Hogan DB, Storr MA. Microscopic colitis – a common cause of diarrhoea in older adults. Age Ageing. 2010;39:162–168.
13. Hjortswang H, Tysk C, Bohr J, et al. Health-related quality of life is impaired in active collagenous colitis. Dig Liver Dis. 2011;43: 102–109.
14. Miehlke S, Madisch A, Kupcinskas L, et al; BUC-60/COC Study Group. Budesonide is more effective than mesalamine or placebo in short-term treatment of collagenous colitis. Gastroenterology. 2014;146:1222–1230.e1–e2.
15. Bouma G, Munch A. Microscopic colitis. Dig Dis. 2015;33:208–214.
16. Limsui D, Pardi DS, Smyrk TC, et al. Observer variability in the histologic diagnosis of microscopic colitis. Inflamm Bowel Dis. 2009;15:35–38.
17. Olesen M, Eriksson S, Bohr J, Järnerot G, Tysk C. Microscopic colitis: a common diarrhoeal disease. An epidemiological study in Orebro, Sweden, 1993-1998. Gut. 2004;53:346–350.
18. Shaz BH, Reddy SI, Ayata G, et al. Sequential clinical and histopatho-logical changes in collagenous and lymphocytic colitis over time. Mod
Pathol. 2004;17:395–401.
19. Gray A, Wright A, Jackson P, Hale M, Treanor D. Quantification of his-tochemical stains using whole slide imaging: development of a method and demonstration of its usefulness in laboratory quality control. J Clin
Pathol. 2015;68:192–199.
20. Sis B, Sarioglu S, Sokmen S, Sakar M, Kupelioglu A, Fuzun M. Desmoplasia measured by computer assisted image analysis: an independent prognostic marker in colorectal carcinoma. J Clin Pathol. 2005;58:32–38.
21. Malekian V, Amirfattahi R, Sadri S, Mokhtari M, Aghaie A, Rezaeian M. Computer aided measurement of sub-epithelial collagen band in colon biopsies for collagenous colitis diagnosis. Micron. 2013;45:59–67. 22. Al-Janabi S, Huisman A, Van Diest PJ. Digital pathology: current status
and future perspectives. Histopathology. 2012;61:1–9.
Clinical and Experimental Gastroenterology downloaded from https://www.dovepress.com/ by 118.70.13.36 on 20-Aug-2020