Western University Western University
Scholarship@Western
Scholarship@Western
Electronic Thesis and Dissertation Repository
7-18-2016 12:00 AM
IOT Stream Analytics Platform
IOT Stream Analytics Platform
Xing Zhou
The University of Western Ontario Supervisor
Hanan Lutfiyya
The University of Western Ontario Graduate Program in Computer Science
A thesis submitted in partial fulfillment of the requirements for the degree in Master of Science © Xing Zhou 2016
Follow this and additional works at: https://ir.lib.uwo.ca/etd
Recommended Citation Recommended Citation
Zhou, Xing, "IOT Stream Analytics Platform" (2016). Electronic Thesis and Dissertation Repository. 4036.
https://ir.lib.uwo.ca/etd/4036
This Dissertation/Thesis is brought to you for free and open access by Scholarship@Western. It has been accepted for inclusion in Electronic Thesis and Dissertation Repository by an authorized administrator of
I
Abstract
The Internet of Things (IoT) is changing people’s surrounding physical world into an information ecosystem that facilitate our everyday life. Billions of smart objects will become data-generating “things” that can sense environmental changes and report their sensed data in near future. Leveraging the huge amount of sensory information is a key issue to realize the IoT solutions in many areas. Adequate technologies are required for data collection, transmission, data processing, analysis, reporting, and advanced querying.
In this thesis, an IoT Stream Analytics Platform that supports IoT application and service development is proposed: it provides user applications a way to capture flowing data from multitudes of data sources and provide analytical insights in real time based on user needs. Developers can conveniently build their IoT applications on this platform without having to consider the diversity and complexity of smart devices and their underlying networks.
Keywords
II
Acknowledgments
Foremost, I would like to express my sincere gratitude to my advisor Prof. Hanan Lutfiyya for the continuous support of my study and research, for his patience, motivation, enthusiasm, and immense knowledge. Her guidance helped me in all the time of research and writing of this thesis.
III
Contents
Abstract ... I
Acknowledgments ... II
Contents ... III
List of Figures ... V
1. Introduction ... - 1 -
1.1 The Definition for Internet of Things ... - 1 -
1.2 Internet of Things applications ... - 2 -
1.3 Big Data Explosion ... - 3 -
1.4. State of the art ... - 4 -
1.5 Problem Statement ... - 5 -
2 Related Work ... - 7 -
2.1 Database management system ... - 7 -
2.2 Data Stream Management Systems and Query Languages ... - 8 -
2.3 Commercial Platforms ... - 10 -
3. System Design Requirements ... - 12 -
3.1 Requirement: Real-time Analysis of Stream Data ... - 12 -
3.2 Requirement: Stream Filtering ... - 13 -
3.3 Requirement: Temporal Analysis and Aggregation ... - 13 -
3.4 Requirement: Multiple Stream Correlation ... - 14 -
3.5 Requirement: Data shared by multiple users ... - 14 -
4. Query Language ... - 15 -
4.1 Query Assumptions ... - 15 -
4.2 Format of Queries ... - 16 -
4.3 Examples of Queries ... - 17 -
4.4 Interpreting the query message... - 18 -
5 IoT Event Stream Processing Platform ... - 21 -
5.1 Platform Introduction ... - 21 -
IV
5.3 Information Model ... - 24 -
5.3.1 Sensor Data Model ... - 24 -
5.3.2 Stream Map ... - 25 -
5.3.3 Stream Queues ... - 25 -
5.3.4 An Information Model Example ... - 25 -
5.4 Interactions ... - 26 -
6 Software Demonstration ... - 33 -
6.1 Software implementation ... - 33 -
6.2 Verification of the functionality ... - 33 -
6.2.1 Health care application example ... - 33 -
6.2.2 Smart road application example ... - 39 -
6.2.3 Smart agriculture application example ... - 41 -
7 Conclusion and Future Work ... - 43 -
References ... - 46 -
Appendix ... - 49 -
V
List of Figures
Figure 1 Syntax Tree 1 ... - 19 -
Figure 2 Syntax Tree 2 ... - 19 -
Figure 3 Syntax Tree 3 ... - 20 -
Figure 4 Syntax Tree 4 ... - 20 -
Figure 5 Platform overview diagram ... - 22 -
Figure 6 Platform architecture diagram ... - 22 -
Figure 7 Issue queries and parse queries ... - 27 -
Figure 8 Start a query task ... - 28 -
Figure 9 Distribute data among query tasks ... - 29 -
Figure 10 Execute each query task ... - 29 -
Figure 11 Publisher-Subscriber Chanel ... - 31 -
Figure 12 Receive query results ... - 32 -
Figure 13 start a simulator ... - 34 -
Figure 14 sensor configuration... - 34 -
Figure 15 sensor configuration... - 34 -
Figure 16 sensor simulator ... - 35 -
Figure 17 start query engine ... - 35 -
Figure 18 invalid query ... - 36 -
Figure 19 issue query ... - 36 -
Figure 20 receive query result ... - 37 -
Figure 21 issue another query ... - 37 -
Figure 22 issue third query... - 38 -
Figure 23 issue fourth query ... - 39 -
Figure 24 sensor configuration... - 39 -
Figure 25 issue a query ... - 40 -
Figure 26 existing query list ... - 40 -
Figure 27 issue existing query ... - 41 -
Figure 28 sensor configuration... - 41 -
Figure 29 issue a query ... - 42 -
- 1 -
Chapter 1
1. Introduction
In this chapter, the concept of Internet of Things (IoT) is introduced. We will then discuss the potential IoT application areas and the expected data explosion brought by IoT. Finally we will discuss the state of art and identify data management challenges that could complicate IoT application development.
1.1 The Definition for Internet of Things
The Internet of Things (IoT) [1] is a major wave in computing, where we not only connect traditional end-user devices such as smart phones and tablets, but also physical objects embedded with sensors, actuators, and network connectivity. These “things” typically provide data, act on the environment and/or encompass points of control. For example, lighting can be adjusted based on data from an occupancy sensor and time of day, and chillers can be adjusted based on temperature sensors. As the cost of sensors and network connectivity becomes less expensive there is an increased interest in applications. Sensor data is seen as opening up the opportunities for new services, improved efficiency and possibly more competitive business models.
- 2 -
Internet network, the future Internet will be used by trillions of devices, people, organizations and places [4].
1.2 Internet of Things applications
Typical IoT applications and services are or can be applied in a variety of application domains such as smart grids, smart homes, e-health, automotive, transport, logistics and environmental monitoring [5]. Major application sectors are presented in this section.
Building and home automation
Through monitoring and control of intelligent buildings and smart homes, building and home automation applications can accomplish tasks from enhancing security, to reducing energy and maintenance costs. Examples include intrusion detection systems, light and temperature control, energy optimization, predictive maintenance, and remotely control appliances [5].
Smart cities
Smart city applications use digital technologies or information and communication technologies to enhance quality and performance of urban services, to reduce costs and resource consumption, and to engage more effectively and actively with its citizens. Examples include smart waste management, smart lightning, pipeline leak detection, traffic control, smart roads, surveillance cameras etc. [5].
Health care
- 3 -
Smart manufacturing
The applications of smart manufacturing provide opportunities to improve efficiency across labor, materials and energy in the manufacturing industry. Examples include flow optimization, real time inventory, asset tracking, employee safety, predictive maintenance and firmware updates [5].
Retail and Logistics
The Internet of Things can also be beneficial for the retail and logistics industry by optimizing information flows along the entire supply chain or tracking goods during transportation. Examples are Supply Chain Control, NFC payment, intelligent shopping applications, quality of shipment conditions, item location, and fleet tracking [5].
Smart Agriculture
For farmers and growers, the Internet of Things has opened up extremely productive ways to cultivate soil and raise livestock. Prospering on this prolific build-up of the Internet of Things in agriculture, smart agriculture applications are gaining ground with the promise to deliver 24/7 visibility into soil and crop health, machinery in use, storage conditions, animal behavior, and energy consumption level [5].
1.3 Big Data Explosion
- 4 -
example airliners can have more than 300,000 sensors on board which generates 20 TB of data every hour during a flight [7]. Cisco estimates that the amount of data generated by Internet of Things devices will be 403Zetta byte by 2018 which equals 47 times of the predicted total data center traffic and 267 times the predicted amount flowing between data centers and users [8]. Indeed, the Internet of Things communication generates enormous amounts of Internet traffic.
1.4. State of the art
Sensors can be built small enough to be embedded into many physical objects and wireless communication technologies have improved to provide data connectivity that allows data to be produced frequently. These sensors will massively increase the amount of data available for analysis. Developing applications that make use of this data is challenging since application developers have to deal with heterogeneous devices and the underlying network for accessing the sensor data. After capturing the raw sensor data, the application has to transform the data to a proper format and apply analytics to data in order to extract valuable information.
IoT provides massive opportunities but also poses data management challenges. One of these challenges is that many IoT applications require that queries are long-running over data streams where the data is continuously generated. There are some variations of database management systems such as pipelinedb[10], EP-SPARQL[11], and Nile[12] devoted to addressing this issue. These systems allow streaming data to be entered into the database directly or through a loading application. A collection of applications can then manipulate DBMS data by running SQL queries to compute metrics accurate up to the last event [9].
- 5 -
Research on stream processing started in the late 1990’s with the development of several academic platforms e.g. Aurora[11], Borealis[12], TelegraphCQ[13], NiagaraCQ[14], OpenCQ[15], Tribeca[16], CQL and Stream[17], GSQL and Gigascope[18], Perla[19] and SteamMill[20].
Compared to traditional queries, which are referred to as ad-hoc queries, data stream management systems queries may be executed continuously over the data passed to the systems. These are referred to as continuous or standing queries. Data stream management systems consider data stream elements as tuples and require stream operators. Queries may be specified declaratively using an SQL-like language or graphically using a graph of data operations that support the continuous query paradigm. For each operator, there are queues for buffering input. Execution plans of registered queries are combined into one big plan to reuse results of common operators for multiple queries. This enables real-time analysis [14]. Much of the work focuses on algorithms for stream analysis, e.g., filtering, finding subsequences, that can be done in memory. Little of this work addresses challenges associated with the sharing of sensor data by multiple applications.
1.5 Problem Statement
- 6 -
the near future. IoT application developers should be able to specify the data required through an easy to understand interface.
- 7 -
Chapter 2
2 Related Work
This chapter describes some of the representative work related to handling streaming data.
2.1 Database management system
This section describes representative examples of database management system.
PipelineDB [10] is an open-source relational streaming-SQL database based on PostgreSQL. It added extra functionality to PostgreSQL such as continuous SQL queries, probabilistic data structures, sliding windows, and stream-table joins. PipelineDB’s fundamental abstraction is called a continuous view, which is very similar to regular SQL views, except that their defining SELECT queries can include streams as a source to read from. PipelineDB runs SQL queries continuously on streams and incrementally stores results in tables.
Although previous work on query languages were useful for automated stock trading,
logistic services, transaction management and business intelligence, they were not
well suited for applications that use web structured data and ontologies. SPARQL [11]
partially addresses this by allowing for the specification of queries for “key-value”
data. EP-SPARQL [12] is based on SPARQL to provide a unified language for event
processing and stream reasoning devoted for streaming databases. It uses SQL-line
- 8 -
Nile [13] extends the query processor engine of an object-relational database
management system to support data streams. This project is motivated by many emerging applications, particularly in pervasive computing, sensor-based environments, retail transactions, and video processing which continuously report up-to-the-minute readings of sensor values, locations, and status updates. The initial prototype implementation was based on an object-relational DBMS called Predator. Predator added data streams as a special data type and implemented a stream query interface through stream-scan and stream manager components. Nile uses traditional SQL operators and consider window execution as an approach to restrict the size of stored state in operators such as join.
Tribeca [14] is an extensible, stream-oriented DBMS designed to support network traffic analysis. It combines ideas from temporal and sequence databases with an implementation optimized for databases stored on high speed ID-1 tapes or arriving in real time from the network.
Traditional storage based data processing infrastructures can deal with stream data. However, the amount of data generated is huge and may come quickly. DBMS assumes that the query is continuously applied to streams with results incrementally stored on a disk for retrieval by applications. For real-time analysis of high-volume, the bottleneck associated with writing to disk and then reading is not suitable.
2.2 Data Stream Management Systems and Query
Languages
- 9 -
Research on stream processing started in the late 1990’s with the development of several academic platforms e.g., Aurora [15], Borealis [16], NiagaraCQ [17], CQL and Stream [18], GSQL and Gigascope [18], and SteamMill [20].
Aurora [15] is a general-purpose data stream manager that was designed and
implemented at Brandeis University, Brown University, and M.I.T. to efficiently support a variety of real-time monitoring applications. Aurora users can build continuous queries out of a small set of well-defined operators that implement standard filtering, mapping, and windowed aggregate and join operations. Each Aurora application can also define one or more Quality of Service (QoS) functions/graphs, each defining the utility of query results in terms of a performance or quality metric. Other key components of the Aurora run-time system are the scheduler, the storage manager, and the load shedder. The scheduler decides which operators to execute and in which order to execute them.
Borealis [16] is a second-generation distributed stream processing engine that inherits core stream processing functionality from Aurora [15] and distribution functionality from Medusa that supports three fundamental functions including dynamic revision of query results, dynamic query modification and flexible and highly-scalable optimization.
- 10 -
CQL [18] is a Continuous Query Language that supported by the STREAM prototype Data Stream Management System at Stanford. It is an expressive SQL-based declarative language for registering continuous queries against streams and updatable relations. From the “black box” mappings among streams and relations they define a precise and general interpretation for continuous queries.
Operators of large networks and providers of network services need to monitor and analyze the network traffic flowing through their systems. They use monitoring tools built into routers, such as SNMP, RMON, or NetFlow. The problem with these tools is their lack of a query interface. Gigascope [19] provides an SQL interface to the network monitoring system, greatly simplifying the task of managing and interpreting a stream of data.
Stream Mill [20] system’s Expressive Stream Language(ESL) efficiently supports a wide range of applications—including data stream mining, streaming XML processing, time-series queries, and RFID event processing. ESL supports physical and logical windows on both built-in aggregates and user-defined aggregates (UDAs), using a simple framework that applies uniformly to both aggregate functions written in an external procedural language and those natively written in ESL. The constructs introduced in ESL extend the power and generality of data stream management system.
2.3 Commercial Platforms
- 11 -
Apache Storm [22] is an open source stream processing framework created by Twitter, and it provides the functions for transforming data streams into a new data stream in a distributed and reliable way. A Storm cluster runs "topologies" in a similar fashion to a Hadoop cluster that runs "MapReduce jobs". The key difference is that a “MapReduce job” will eventually finish, whereas a “topology” processes stream data forever until it is stopped. A “topology” is a graph of computation where each node from the graph contains processing logic, and links between nodes indicate how data should be passed around among nodes. Each processing node consumes any number of input streams, does some processing, and emits new streams, one example can be compute a stream of trending topics from a stream of tweets [23]. Storm’s website shows some reference use cases for stream processing at companies such as Groupon, Twitter, Spotify, HolidayCheck, Alibaba, and others.
Samza [24] plays a role similar to MapReduce yet it is unlike batch processing systems such as Hadoop. Samza’s goal is to provide an elastic, fault-tolerant processing on top of real-time feeds. Samza continuously computes results as data arrives which makes sub-second response times possible.
The Cedr stream research project [25] proposes novel architectures, processing techniques, models, and applications to support time-oriented queries over temporal and real-time data streams. This research shipped in 2010 as Microsoft StreamInsight [26] - a commercial stream processing system that is part of SQL Server. Microsoft StreamInsight is a comprehensive platform for building event-driven applications. StreamInsight adopts a deterministic stream model that leverages a temporal algebra as the underlying basis for processing long-running continuous queries.
- 12 -
not satisfy the requirement of the decoupling of data consumers and data producers. Because we want to achieve more effective stream data sharing.
Chapter 3
3. System Design Requirements
This chapter presents data management requirements for stream-processing systems which are motivated by IoT applications.
3.1 Requirement: Real-time Analysis of Stream Data
Smart roads applications [9] can help make traffic control more effective by monitoring live trends in traffic flow. The traffic flow information, usually detected by vehicles or road side units, is broadcast among all vehicles when it is close to its occurrence. Getting this information received with minimum latency, real-time action can be taken, instructing ways to avoid traffic bottlenecks or even potential accidents.
- 13 -
3.2 Requirement: Stream Filtering
In the Automatic NFC payment application scenario [9], payment is processed based on location or activity duration for places such as public transport, gyms, theme parks, etc. The application should track a user’s location information and charge only when that information is relevant to payment activity. For example, when a user is using public transport, the application will record the distance traveled and automatically charge the transportation fee.
As seen with this example, filtering the sensor data is required since the huge amount of sensor data and instantaneous response demand has made it unrealistic to process all the data. Much of the generated data is regarded as “unconcerned” and will not be used by user applications. For example, the period that a person is not in a train or in theme park is not relevant for payment. Stream analytics systems should handle irrelevant data by applying transformations and rules to determine if further processing needs to take place. If not necessary, the data should be discarded immediately.
3.3 Requirement: Temporal Analysis and Aggregation
Patient surveillance [9] requires monitoring of conditions of patients inside hospitals and in old people's home. A variety of sensors attached to patients should keep tracking of body data: pulse rate, breathing airflow, body temperature, glucometer, blood pressure, etc. Health care applications should continuously monitor the sensor data along a time line and compute the aggregate value within the time window. For example, the average blood pressure for every 15 minutes or the maximum body temperature for half an hour can be detected by the health care application, so that patients and doctors can identify potential problems.
- 14 -
computing models which are designed to summarize historical data, stream analytics continuously process the data as it is generated. The system should also be able to do continuous aggregation across sliding time windows in order to understand real-time trends over a period of time.
3.4 Requirement: Multiple Stream Correlation
Waste management applications [9] are used for detection of waste levels in containers to optimize the trash collection routes. The application will analyze multiple streams of sensor data from all waste containers, and create a customized overall waste collection plan that guarantees that there are no overflows or over collect the wastes.
From this example we can see that figuring out whether or not trash cans need to be emptied obviously cannot only consider one particular trash can. The stream processing system should allow user applications to connect to multiple data streams that are from different sources. A user application might be wish to identify that a series of events occurred, e.g., all the trash cans contain waste above certain level. Or the user application will be interested as long as any event from a series of events occurs e.g. there is one trash can exceed the maximum overflow level.
3.5 Requirement: Data shared by multiple users
- 15 -
The above examples show that one data stream could be shared by multiple user applications who subscribe to this stream in real-time. Multiple user applications could be interested in one stream of raw sensor data, but may apply different strategies for downstream analysis. This system should be designed to satisfy this requirement.
Chapter 4
4. Query Language
In order to address the requirements of stream processing for IoT applications, it is crucial to design a query specification that allows the user to perform queries.
4.1 Query Assumptions
A stream S is a bag (multiset) of elements (D, t) where D is the data and t represents the timestamp associated with the data. There is considerable existing work in query languages for streams such as NiagaraCQ[15], OpenCQ [16], CQL[18] and Gigascope[19]. This work uses a subset of operators found in CQL [18]. Most work assumes that the application issuing the query has knowledge of the available sensors and can specify the desired stream though a sensor stream identifier. This work differs in that the application that issues the query does not necessarily have knowledge of available sensors. Instead the approach taken is to allow the user to specify the type of data and the location from which it needs this data. This is sufficient for identifying the data when a sensor type maps to a unique sensor location. However if there are several sensors of the same type at the same location, we need to distinguish each sensor by adding an extra identifier. For example, if there are three temperature sensors in a room, a user should be able to query by sensor type e.g., temperature1,
temperature2, temperature3, for representing each temperature at one location or the
- 16 -
4.2 Format of Queries
The general form of a query is the following:
SELECT <attribute-list> when [<conditional expression>] from <location>
[<groupBy Time Window>]
Components of the query within brackets are optional. The components of the query are described below:
attribute-list: This may consist of one or more attributes. An attribute is either data from a sensor or an aggregation function on a set of data of a particular attribute. The set of aggregation assumptions include average, maximum and minimum. One query is allowed to contain both aggregation and non-aggregation attributes and the attributes are from multiple sensors.
conditional-expression: This may be a single condition such as temperature > 20 or a series of conditions connected by a logical operator (AND or OR) such as temperature>20&&humidity<20 . Sensor data that does not satisfy the condition is not sent to the user. Basically if a condition is defined a subset of the stream is returned to the user.
location: This represents the sensor location. The location can be in different forms. For example, in most cases it could be a location tag e.g., Room 240, MC Building. If the sensor can move such as a person who is carrying the sensor, then the location of the person is considered as the location in this query.
groupBy time-window: This defines the window of data to be retained before
- 17 -
data once the data is produced, the time window is not required for aggregating data.
The query results is a tuple with two elements:
Attribute-value pair: This includes the sensor type and measurement value of
returned data e.g. (Temperature, 20 degree). One query result tuple contains one or more attribute-value pairs according to attribute-list specified in the issued query.
time stamp: This is the time when the sensor data entry is produced. It uses the following format: [Month Day hh:mm:ss Year TZ] where Month refers to an abbreviation for month (Jan through Dec), Day refers to a two-digit day of the month (01 through 31), hh refers to two digits that represents an hour (00 through 23), mm represents two digits of a minute (00 through 59), ss represents two digits of a second (00 through 59), YYYY represents a four-digit year; and TZ represents a time zone.
4.3 Examples of Queries
This section presents several query examples and demonstrates how the queries satisfy the addressed requirements.
Example 1:SELECT Temperature when Temperature>25 from Room240;
This query returns Room 240’s temperature value when it is more than 25. The temperature values that are less than 25 are filtered out.
Example 2: SELECT avg(Temperature) when avg(Temperature)>20 from Room215 groupBy timeWindow(10min);
- 18 -
Example3: SELECT Temperature, Light when Temperature>25 && Humidity<10 from Building1;
This query returns temperature and humidity from location Building1 when the temperature measured is greater than 25 and the light is less than 10. This query uses two streams and thus satisfies the requirement of multiple stream correlation.
4.4 Interpreting the query message
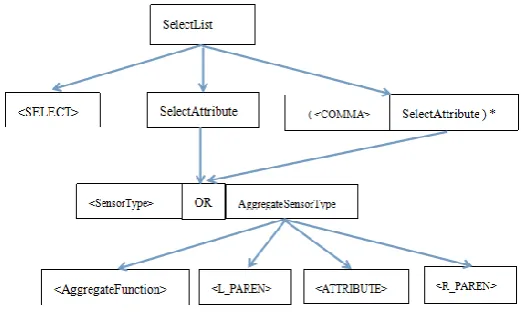
A corresponding interpreter is needed for the proposed query language. This interpreter recognizesFigure 1 Syntax Tree 1 the query string’s grammar specification to determine whether it is a valid query and also converts the query string to information that can be executed by a query task.
The syntax tree is shown as Figure 1 Syntax Tree 1to interpret the query string. The string without angle brackets indicates one expression, which is composed of several tokens. Each token is the one with angle brackets and should be matched to a string or character as specified in Appendix 1.
The syntax tree also follows the same rule as used in regular expression, where
question mark (?) indicates zero or one occurrences of the preceding element, the
asterisk (*) indicates one or more occurrences of the preceding element, and the
operator ‘OR’ means this expression can be either one from two tokens.
- 19 -
Figure 1 Syntax Tree 1
In Figure 2 the SelectList starts with a SELECT token, followed by one or more SelectAttribute expressions, separated by a COMMA token. A SelectAttribute can be a SensorType token, or an AggregateSensorType expression. The AggregateSensorType expression starts with an AggregateFunction followed by a SensorType which is surrounded by a left parentheses and a right parentheses.
Figure 2 Syntax Tree 2
- 20 -
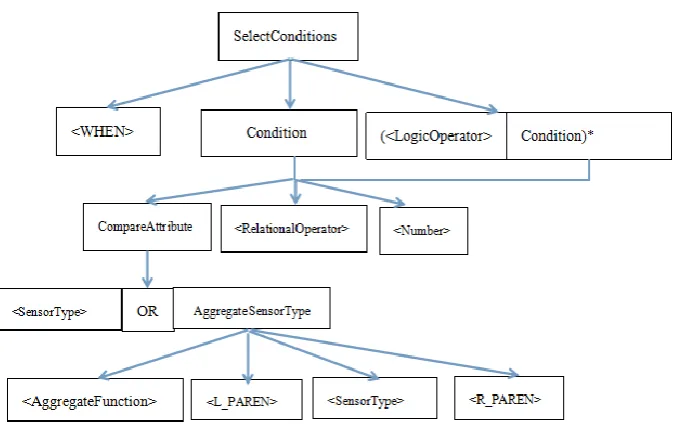
followed by a SensorType, which is surrounded by a left parentheses and a right parentheses.
Figure 3 Syntax Tree 3
Finally we have SensorLocation expression composed of a FROM and a Location token. The TimeWindow expression contains a GroupBy token and a Time token that is surrounded by a left parentheses and a right parentheses
- 21 -
Chapter 5
5 IoT Event Stream Processing Platform
In order to support the query language, an IoT Event Stream Processing Platform is proposed. In this chapter the overall architecture and each of its components are introduced.
5.1 Platform Introduction
The framework is designed to be available via the Platform as a Service (PaaS) model: Platform as a Service is a cloud computing model that delivers applications over the Internet. In a PaaS Model a cloud provider delivers hardware and software tools, usually those needed for application development, to its users as a service [27]. The platform is licensed on a subscription basis and is hosted on a server. Sensor data can be accessed by a client IoT application using a TCP connection. Various kinds of IoT applications can be developed by leveraging this platform. The platform provides two main services to its users: executes basic analytics on sensor data based on the user query and dispatches processed sensor data to applications who subscribe to this information.
- 22 -
Figure 5 Platform overview diagram
5.2 Platform Architecture
This section describes the functionality of each component of the platform as illustrated in Figure 6. This platform assumes that there is a queue for each data stream coming from a data source. The Stream Manager maintains these queues.
- 23 -
Data Sources
The Data Sources refers to sensors attached to smart devices, which are used to sense the surrounding environment, periodically produce sensor data and send sensed data to the cloud platform. In general, the devices or things can be categorized into two groups: constrained and standard devices. Constrained devices may be very small and have very few resources in terms of compute power storage, etc., and may be able to communicate only via networks that are unable to reach cloud platform directly (e.g., over Bluetooth Low Energy, or BLE). Standard devices more likely resemble small computers and can route data directly over networks to cloud platform. In order for the data from constrained devices to reach the cloud platform, the data needs to go through some type of gateway device.
User Applications
This refers to IoT applications that need to make use of the sensor data. The platform provides each user application an interface to issue queries and receive query results in real-time. The applications do not have to be concerned with the configuration of the query engine that allows the data to be delivered to it.
Query Parser
This component is used for receiving and parsing query messages issued by user applications. Only after parsing the query message successfully, can the query can be executed by the query engine.
Stream Manager
- 24 -
Data Dispatcher
This componentis aware of the information of all the active queries, including the streams that each query is interested in. Using this information, the sensor data can be dispatched to corresponding queues at the Stream Manager, so that each query has access to its requested stream data from the queues at the Stream Manager.
Query Processing Task
Each Query Processing Task is started for handling one query. As all data streams required by this query is handled by the Stream Manager, the task is able to continuously receive data from the corresponding queues. Upon receiving the data, the task will apply analysis to the streaming data including aggregate, calculate average and filter on the stream data according to user needs, and generate final query results.
Task Manager
This component is used to manage a group of Query Processing Tasks. There is one task per user query. The tasks can be started or removed based on user requirements.
Query Result Publisher
This component is responsible for publishing the query results on a query topic, the query topic is the query string. It allows users who subscribe to that query topic to receive the query results.
5.3 Information Model
In this section we will introduce information models that are used in this work.
- 25 -
Each sensor si is a data source. A stream generated by one sensor is set of elements
(ai, t) where ai is a tuple, (ai0, ai1,….ain-1) consisting of attribute values measured by
sensor si at time t. We assume that there is a unique identifier associated with a stream.
We also associate sensor si, with the pair (typei,locationi) where typei represents the
type of sensor si, and locationi represents the location of sensor si.
5.3.2 Stream Map
The Stream Map is maintained by Data Dispatcher and is used to guide the Data Dispatcher on how to dispatch sensor data. The Stream Map is basically a set of pairs (or 2-tuples). In the ordered pair (si,Qi), where si represents the stream of data coming
from sensor si and Qi represents the set of query identifiers interested in the sensor
information from si,
5.3.3 Stream Queues
Stream Queues represents the queues maintained by the Stream Manager. For each sensor si and query qij from Qi of the stream map, there is a queue. The Stream
Manager needs to maintain information about each queue. Stream Queues is a set of tuples [si Queuei]: where si represents the sensor identification, Queuei is the set of
queues where Queueih is associated with query qij. This means that if a data steam for
sensor si is used by two queries then there will be two queues with the data from the
sensor si. We choose to duplicate the sensor data instead of sharing it because different
applications would handle the data in different ways.
5.3.4 An Information Model Example
To get a better understanding of the Stream Map and Stream Queues, this section presents an Information Model use case. The example assumes that there are three sensors sending data to the query engine and three queries have been issued: query1
- 26 -
sensor1 and sensor2; query 3 requires three streams of data from sensor1, sensor2 and
sensor3 respectively.
After the queries are issued, the Stream Map will be updated: each sensor is related to a set of current queries. Following the Stream Map, new queues will be create in Stream Queues as follows and sensor data will be constantly sent to these queues.
{
[ :( : queue of data from ), ( : queue of data from ),
( : queue of data from )];
[ :( : queue of data from ), ( : queue of data from
)];
[ :( : queue of data from )];
}
5.4 Interactions
In previous sections we discussed the functionality of each component. In this section, we will discuss the details of how these system components cooperate.
Step 1: Issue and parse queries
In the first step, the User Application issues queries to the query engine. The Query Parser component of the query engine listens for queries and processes each received query.
Upon receiving a query, the Query Parser interprets the query message and checks whether it is a valid query. A valid query message satisfies two requirements: the
1
sensor query1 sensor1 query2 sensor1
3
query sensor1
2
sensor query2 sensor2 query3 sensor2
3
- 27 -
query string follows the specified query language syntax and the queried sensor type - location combination exists. If the Query Parser determines that the query is valid, the Query Parser sends a success message back to the User Application, and then sends the parsed query information, including attribute-list, condition-expression, location and possibly a time window, to the Data Dispatcher and Task Manager. Otherwise a ‘query fail’ message is returned to the User Application.
Figure 7 Issue queries and parse queries
Step 2: Start tasks for processing queries
- 28 -
Figure 8 Start a query task
Step 3: Distribute data among query tasks
In the previous step, the Query Task Manager starts a query task for each query and the Data Dispatcher updates the Stream Map. The Data Dispatcher receives data sent from sensors.
The Data Dispatcher directs data streams to Stream Queues by referring to the mapping information from Stream Map. The Data Dispatcher uses the sensor identifier of received data to determine the list of queries that require data from the incoming stream. The Data Dispatcher will then dispatch the data to the relevant queue associated with the query. This enables all queries from the query list that map to the sensor identifier to extract data from the stream associated with the stream identifier. In this way, if multiple queries require data from a particular stream, the sensor data from this stream will be duplicated and directed to multiple queues. If no query requires data from the data stream, this data will simply be discarded.
- 29 -
identifier. While there is sensor data in the queue, the task will keep extracting sensor data from this queue, therefore allowing the task to access data from this stream.
Figure 9 Distribute data among query tasks
Step 4: Execute each query task
After the sensor data is directed from the Stream manager to the correct destination at each task, the Query Processing Task will apply processing logic to stream data according to the parsed query. In order to execute each of the query task, several modules need to collaborate to achieve this goal.
- 30 -
Aggregator:
In order to calculate an aggregate value like average, maximum or minimum value of multiple data entries, the Aggregator is used for retaining stream data entries for a specified time frame before the aggregation function can be applied.
Synchronizer:
Since there may be a time difference on the arrival of data from different sensors, a Synchronizer is required to determine whether all the data from different sources arrived. The Synchronizer will signal Condition Checker for further processing when all required sensor data from multiple streams are ready. If any data is missing and the Synchronizer waits for this data for a specific amount of time the query engine will ignore this set of data and proceed to data at next time stamp. For example when calculating a combined result from two streams, if the data from one steam arrives yet the data from another stream is lost, then in this case the arrived data should be discarded, no result is returned at this time stamp and the system will proceed to the next set of data.
Condition Checker:
One query message contains a condition expression which is composed of a list of conditions. The Condition Checker is responsible for calculating and checking each of the individual conditions and determines whether the condition expression is satisfied when several conditions are connected by AND/OR operators. Only when the condition expression is satisfied, can the sensor data entry be selected to return to user.
Publisher:
- 31 -
pairs from multiple streams to generate one query result ready to present to users who issue this query.
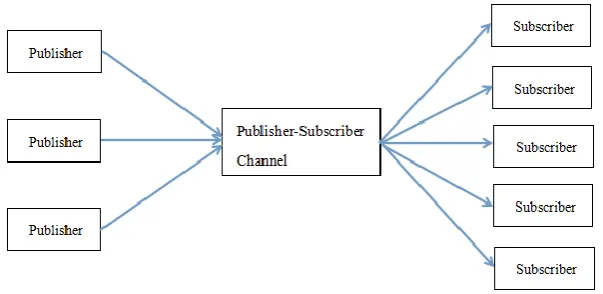
Step 5: Publish query results via publisher-subscriber channel
The query results produced by each Query Processing Task can be published as a topic via a Publisher, one topic is a query string. When a user issues a query, the user automatically subscribes to that topic. All User Applications that subscribe to that topic will receive the query results, which means that if query1 is the same as query2
then the user application that issued query2 can just subscribe to the topic and thus no
need to a separate stream. This is done by a Publisher-Subscriber channel that takes the query results published and instantly delivers the messages to Subscribers using
the topics and subscriptions information.
Figure 11 Publisher-Subscriber Chanel
- 32 -
Step 6: User Application receive results of multiple queries
Figure 12 Receive query results
As mentioned in previous step, the User Application starts a thread called Query Result Receiver after issuing a valid query. One Query Result Receiver contains the Subscriber that receives query results for subscribed topic. The User Application will gather all results from those Query Result Receivers it started.
- 33 -
Chapter 6
6 Software Demonstration
This chapter describes the validation of the functionality.
6.1 Software implementation
The platform is developed using the Java language. Third party tools that have been applied are JavaCC[28] for interpreting query string and ActiveMQ[29] for implementing the publisher-subscriber channel. As Java is a platform independent language, the software can be ran on any hardware platform. The software was executed on a PC running 64 bit Windows7 operating system, with Intel Core i3 CPU and 4GB RAM.
6.2 Verification of the functionality
The functionality of our platform to be evaluated includes: applications can apply analysis to stream data in real time, stream filtering is possible using one or more conditions, aggregation for a specific amount of time is allowed, one query is able to correlate multiple streams from different sources, and multiple applications can access the same stream of data. To test these functionalities, a simulator was developed to simulate the sensors and send stream data to the platform. We ran the sensors (data source side), platform (server side) and user applications (client side) on one PC, and used the TCP protocol to communicate between the components for simulating components communicating from different locations. We use three IoT application examples to demonstrate the functionality of the prototype.
6.2.1 Health care application example
- 34 -
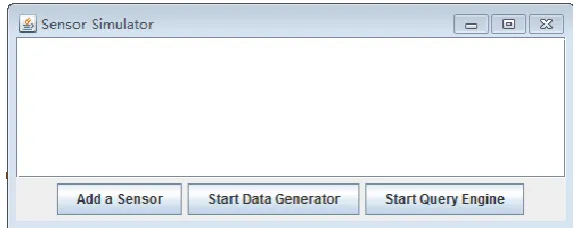
Figure 13 start a simulator
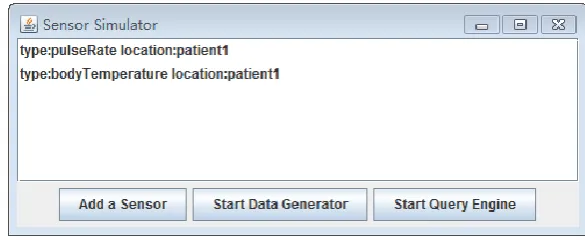
2. When the Add a Sensor button is pressed a window pop up that allows the user to set the sensor configuration. A sensor that monitors the pulse rate from patient1 is created. The simulation produces 3000 sensor readings or data records, and produces one record every second. The value of simulated data of simulated sensor readings is in the range of 50 to 150. We then create another sensor which senses body temperature. It then simulates sensor data values that range between 36 to 38 degrees.
Figure 14 sensor configuration
Figure 15 sensor configuration
- 35 -
the simulation. Each sensor configuration is registered at the server and each sensor continuously generates data.
Figure 16 sensor simulator
3. Pressing Start Query Engine allows the server to start receiving sensor values and the timestamp associated with the sensor value when it was generated. The sensor simulator will also automatically assign an identifier to the data from the sensor stream: pulseRate data with sensor identifier 1 and bodyTemperature data with sensor identifier 2.
Figure 17 start query engine
4. One of the clients may be a doctor which we will identify as Doctor1. Doctor1
- 36 -
invalid query is one that does not follow the query specification or the sensor type queried at that location does not exist.
Figure 18 invalid query
5. A query can be issued to alert the doctor when a patient’s pulse rate is greater than 130. The query should be “Select pulseRate when pulseRate>130 from patient1”.
Figure 19 issue query
6.The Add Query button is used to issue the query. This query will appear on the
- 37 - display area.
Figure 20 receive query result
7.We issue another query “Select pulseRate, bodyTemperature when pulseRate>70 && bodyTemperature>37 from patient1”. This query requires data from two streams
when the two conditions “pulse rate is larger than 70” and “body temperature larger than 37” are both satisfied. As we can see the Query List panel now contains two issued queries. By clicking each of the queries, the result display area can switch between the two query results.
- 38 -
8.We issue the third query “Select avg(pulseRate) when avg(pulseRate)>70 && from patient1 groupBy timeWindow(3s)”. This computes the average pulse rate every
3 seconds, and the data that satisfies the query will be returned when the average pulse rate is higher than 70.
Figure 22 issue third query
9.The last query is “Select avg(pulseRate),bodyTemperature when avg(pulseRate)>70 from patient1 groupBy timeWindow(3s)”. This return the average
pulse rate and body temperature when average pulse rate is larger than 70 every 3 seconds. The body temperature is generated every 1 second and therefore each result has three entries with the same average pulse rate and different body temperatures.
- 39 -
Figure 23 issue fourth query
6.2.2 Smart road application example
In the second example we use a smart road application to demonstrate that multiple users can use the same stream of data. We use an attribute trafficLoad with values that range from 0 to 100 percent to measure the amount of traffic on a block (0 for no traffic, 100 for the road is fully packed).
Figure 24 sensor configuration
- 40 -
Figure 25 issue a query
The same copy of real time traffic information can be shared among multiple vehicles. By clicking Existing Query button User2 can see a list of queries issued by other users. User2 can choose one issued query and receive the query result. Here we choose the only query issued by User1 and receive the same results as User1.
- 41 -
Figure 27 issue existing query
6.2.3 Smart agriculture application example
In the third example we will provide a smart agriculture application to show multiple users that use different streams of data. We use an attribute temperature
whose values range from 0 to 30 degrees to measure the temperature at a farm. Another attribute light is used to measure the day time illumination ranging from 0 to 100 at the farm.
- 42 -
We will have two user applications one for monitoring an animal and the other for monitoring a plant. The first application issues a query “Select temperature when temperature<15 from farm1”. It returns the temperature when it is less than 15.
Figure 29 issue a query
The second application issues a query “Select temperature, light when temperature <10 || light<30 from farm1”. It returns the temperature and light when the temperature is less than 10 or light is less than 30.
- 43 -
Chapter 7
7 Conclusion and Future Work
7.1 Conclusions
This thesis addressed challenges in the development of a data stream system that supports real-time analytics but also allows for the decoupling of sensors from applications in a way that allows for sharing of substream computation.
Integrating the data collection and analysis functions within a common platform is important for IoT application developers. Developers do not have to deal with heterogeneous and complex smart devices and the underlying network protocols to access sensor data. Users can specify the substreams and analysis on substreams without being concerned about efforts to transform the data to the desired format and apply analytics to data in order to extract valuable information. Instead, the platform provides an interface to access sensor data and carry out data analysis in the cloud on users’ request. We reduce their development effort by not having these tasks done by each of these applications.
- 44 -
7.2 Future Work
The implementation is a proof-of-concept that looks promising for future work. Our prototype requires several additional challenges to be addressed for a real-world deployment. Some of these include:
1. The primary issue is the performance when deal with large amount of data, as now
the platform runs on a single machine. Obviously in next step we need to build our
system as a distributed one. One solution is to take advantage of existing distributed
stream processing framework Apache Storm [22]. Using Apache Storm each stream
processing task can be viewed as a computation graph consisting of several processing nodes. Each processing node consumes any number of input streams, does some processing, and emits new streams. When start a new job, we add more nodes to our system. These processing nodes then can be distributed among multiple machines. For each query we can consider it as one processing node (receive multiple input stream from sensors and generate one output stream to user application) and specify configuration on how many threads carry out this task and distribute these threads to which cluster of machines. Alternatively we can further separate one processing node to smaller ones: for each query, there is one node responsible for receiving multiple streams and synchronize them, another one node for checking the condition expression, and a third node for generating output result stream.
2. There are weaknesses in the query language. when there are multiple sensors of
the same type of sensors appear, users can be confused with which sensor to query
even if an extra identifier is provided. For example there are multiple temperate
sensors at one building, it is necessary to distinguish among these sensors since we
cannot query using sensor type-location pair. A definition of location is needed that is
understood by the user but is also unique. Another issue is that it should be possible to
provide “if any” query, for example a notification should be sent if “any room” has a
temperature of 25. Application users may not only concern about data from sensors at
- 45 -
from different locations. And lastly our aggregation function now support
sum/maximum/minimum and these function are hard coded. To provide more flexibility to our query language, we should be able to provide more functions or ideally allow users to specify their own functions and automatically integrate within query language.
3. Thirdly security issues should also be considered because it is critical for IoT
applications. In our work sensor data and user queries can be managed centrally, which made it inherently easier to solve security issues like access control, data authentication, snooping, DDoS attack and etc., however this will be more challenging in a distributed system.
- 46 -
References
[1] Atzori, Luigi, Antonio Iera, and Giacomo Morabito. "The internet of things: A survey." Computer
networks 54.15 (2010): 2787-2805.
[2] Information Technology Association of Canada (ITAC), “The Internet of Things: Time for a
National Discourse” August 2015
http://itac.ca/wpcontent/uploads/2012/09/The-Internet-of-Things-Time-for-a-National-Discourse.pdf
[3]Cisco, “Embracing the Internet of Everything to Capture your share of 14.4 trillion” February 2013
http://www.cisco.com/c/dam/en_us/about/ac79/docs/innov/IoE_Economy.pdf
[4] Dave Evans, "The Internet of Things: How the Next Evolution of the Internet Is Changing
Everything" September 2015.
https://www.cisco.com/c/dam/en_us/about/ac79/docs/innov/IoT_IBSG_0411FINAL.pdf
[5] Lebelium, “50 Sensor Applications for a Smarter World”.
http://www.libelium.com/top_50_iot_sensor_applications_ranking/
[6]Press, Gil. "Internet of Things by the numbers: Market estimates and forecasts." Forbes. Forbes
Magazine 22 (2014).
[7]Matthew Finnegan, “Boeing 787s to create half a terabyte of data per flight, says Virgin Atlantic”.
March, 2013
http://www.computerworlduk.com/news/data/boeing-787s-create-half-terabyte-of-data-per-flight-says-virgin-atlantic-3433595/
[8]Charles McLellan, “The internet of things and big data: Unlocking the power”. March , 2015
http://www.zdnet.com/article/the-internet-of-things-and-big-data-unlocking-the-power/
[9]Stonebraker M, Çetintemel U, Zdonik S. The 8 requirements of real-time stream processing[J].
ACM SIGMOD Record, 2005, 34(4): 42-47.
[10]Pipelinedb official website. https://www.pipelinedb.com/
[11]Pérez, Jorge, Marcelo Arenas, and Claudio Gutierrez. "Semantics and Complexity of
SPARQL." International semantic web conference. Springer Berlin Heidelberg, 2006.
[12] Anicic, Darko, et al. "EP-SPARQL: a unified language for event processing and stream
- 47 -
[13] W. G. Aref,et al.“Nile: A Query Processing Engine for Data Streams”Data Engineering, 2004
Proceedings 20th International Conference on 30 March-2 April 2004
[14]Sullivan, Mark, and Andrew Heybey. "A system for managing large databases of network traffic."
Proceedings of USENIX. 1998.
[15]Abadi, Daniel, et al. "Aurora: a data stream management system." Proceedings of the 2003 ACM
SIGMOD international conference on Management of data. ACM, 2003.
[16]Abadi, Daniel J., et al. "The Design of the Borealis Stream Processing Engine." CIDR. Vol. 5.
2005.
[17]Chen, Jianjun, et al. "NiagaraCQ: A scalable continuous query system for internet databases." ACM
SIGMOD Record. Vol. 29. No. 2. ACM, 2000.
[18]Arasu, Arvind, Shivnath Babu, and Jennifer Widom. "The CQL continuous query language:
semantic foundations and query execution." The VLDB Journal—The International Journal on Very
Large Data Bases 15.2 (2006): 121-142.
[19]Cranor, Chuck, et al. "Gigascope: High performance network monitoring with an SQL interface."
Proceedings of the 2002 ACM SIGMOD international conference on Management of data. ACM, 2002.
[20] Bai, Yijian, et al. "A data stream language and system designed for power and extensibility."
Proceedings of the 15th ACM international conference on Information and knowledge management.
ACM, 2006.
[21] Kai Wähner “Real-Time Stream Processing as Game Changer in a Big Data.” September, 2014
www.infoq.com/articles/stream-processing-hadoop April 26, 2016.
[22] Apache Storm, storm.apache.org/
[23] Tutorial - Apache Storm https://storm.apache.org/documentation/Tutorial.html.
[24] Samaze, http://samza.apache.org/
[25]Barga, Roger S., et al. "Consistent streaming through time: A vision for event stream
processing." arXiv preprint cs/0612115 (2006).
[26] Microsoft StreamInsight, https://msdn.microsoft.com/en-us/sqlserver/ee476990.aspx
[27] Rackspace Support, “Understanding the Cloud Computing Stack: SaaS, PaaS, IaaS” October,
- 48 -
https://support.rackspace.com/white-paper/understanding-the-cloud-computing-stack-saas-paas-ia
as/
[28] Java Compiler Compiler (JavaCC )-The Java Parser Generator. https://javacc.java.net/
- 49 -
Appendix
Appendix1:
TOKEN: {
<SELECT:"Select"> | < L_PAREN: "(" > | < R_PAREN: ")" > | <WHEN: "when" > | <FROM: "from" >
| <GROUPBY: "groupBy" >
| <TIMEWINDOW: "timeWindow" >
|< RelationalOperator:<LT>|<GT>|<EQ>|<LTE>|<GTE> > | < #LT: "<" >
| < #GT: ">" > | < #EQ: "=" > | < #LTE: "<=" > | < #GTE: ">=" >
|<LogicOperator:<AND>|<OR> > |<#AND :"&&">
|<#OR : "||">
|<EmbedFunction:<AVG>|<MAX>|<MIN> > |<#AVG :"avg">
|<#MAX : "max"> |<#MIN : "min">
| < SEMICOLON: ";" > | < COMMA: "," >
| < TIME: <NUMBER> <SECOND> > |< NUMBER : ([ "0"-"9"])+ >
- 50 -
| < SensorType: <LETTER> > |< SensorLocation: <LETTER> > | < #LETTER:
( ["A"-"Z", a"-"z", "_", "0"-"9"] )+ >
- 51 -
XING ZHOU
PERSONAL DESCRIPTION
I have been learning and using Java for more than 5 years, doing several projects for research purpose, my research interests mainly focus on computer networks and internet of things, now expecting to apply my knowledge to solve real industry problems in a future work.
EDUCATION
-Sep 2014 – May 2016, MSc in Computer Science, Western University, GPA: 83/100
-Sep 2009 – Aug 2013, BSc in Computer Science, Xi’an Jiaotong-Liverpool University, GPA: 80/100
SKILLS
Core Java, data structure&algorithms, code refactoring, design pattern, computer networks, Java Swing, socket programming, multi-threading, relational databases, unit test, Python, Spring MVC, Servlets, JSP, HTML
WORK EXPERIENCE
Research&Teaching Assistant at Western University, Sep 2014 – now
-Teaching labs on course of Java Programming, Python Programming, Operating System.
-Conducting research under supervision of department chair Professor Hanan Luffiya in Cloud Computing area.
PUBLICATION
-Fleming, C., Zhou, X., and Liang, H.-N., DiffuseNet: A random walk based anonymity
network, 2014 IEEE International Conference on Signal Processing, Communications and
Computing (ICSPCC)
-Fleming, C., Zhou, X., and Liang, H.-N., Wireless Spectrum Allocation by
Simulated Annealing, 2013 IEEE Fifth International Conference on Ubiquitous and