GUI for RR Interval Extraction and
Arrhythmia Detection using Adaptive Filter
Saudagar
1, Bhawna Jindal
2P.G. Student, Department of ECE, UIET, Kurukshetra University, Kurukshetra, Haryana, India1 P.G. Student, Department of ECE, UIET, Kurukshetra University, Kurukshetra, Haryana, India2
ABSTRACT: Electrocardiogram (ECG) is the graphical illustrations of electrical activity of the heart measured by placing electrodes over human body surface. For diagnosis electrocardiogram remains the reference standard in spite of the development of many other diagnostic procedures. Several Cardiac Arrhythmias can be predicted with the features available in EKG Signal. The scrutiny of electrocardiogram waveform performed for diagnosing a number of heart abnormalities. Here a method is presented for analysing electrocardiogram (ECG) signal, extracting the features, for the organization of heart beats according to dissimilar arrhythmias. Techniques used for electrocardiogram signal processing involve of de-noising, baseline correction, filtering, thresholding, parameter extraction and arrhythmia detection. Observation of ECG signal is completed through QRS detection. In association with methods based on signal derivatives and other methodologies, the adaptive filtering based method, which has been used in this paper, is beneficial for ECG signal processing as the ECG signal is quasi-periodic in nature, and its feature also reduces with several random artifacts (noises) while recording. In proposed paper a graphical user interface (GUI) developed which represents electrocardiogram pre-processing and output waveforms with parameter calculations and arrhythmia detection on a single window screen. This GUI is an effective and convenient way to diagnose cardiac diseases. Arrhythmia happened due to the irregular heart rhythm which is diagnosed by investigating numerous ECG features like RR interval, QRS complex width, PR interval, heart rate. Electrocardiogram (ECG) signal taken from MIT-BIH arrhythmia database available on Physionet site. Sensitivity of 99.20% and positive predictivity of 99.71% achieved by presented methodology.
KEYWORDS: Electrocardiogram (ECG), Features, Arrhythmia, GUI, Adaptive Filtering.
I. INTRODUCTION
Fig.1. ECG Waveform with time interval
ECG Database:The performance of proposed QRS detection algorithm is estimated on standard
MIT-BIH(Massachusetts Institute of Technology Beth Israel Hospital database) arrhythmia database for a data-length of 10s (3600 samples). The database is acquired from Physionet ATM Bank taken from arrhythmia laboratory of Boston's Beth Israel hospital (BIH). The database holds ECG recordings in digital setup from 47 subjects that consist of 25 men and 22 women of age groups 32–89 and 23–89 respectively. About 60% of the whole subjects were inpatients. The database comprises 10mVrange, 360Hz sampling frequency, 11 bit resolution and completes annotations [3].
II. RELATEDWORK
The procedure of QRS detection begin with mean subtraction of ECG signal after which adaptive filter also known as adaptive linear prediction (in perspective of ECG processing) is applied to get the sudden prediction error(PE), which undergoes Savitzky-Golay (SG) filtering for peak improvement and noise suppression. It is essentially the smoothening of a signal by its local estimate with polynomials in least square error sense. The process of adaptive linear filtering is labelled in the block diagram given below, where y(n) denotes the input signal, which in this perspective is the delayed ECG signal, ̂ characterizes the predicted signal, c(n) represents the desired signal, which in this framework is the original ECG signal and e(n) is the instantaneous prediction error to control the variation of filter taps for realizing optimization [2]. In present work, RLS (Recursive least square) has been used to bring up to date the coefficients of predictor. Upon convergence, a predictor is able to predict the gradually varying components (low frequency content) accurately. Based on this approach PE (Prediction error) with spikes positioned at QRS Complex regions (created due to their transient behaviour) is considered as appropriate feature for noticing QRS complex.
Fig.2. The simple model of adaptive filtering [2]
(i) Mean removal: Baseline up shift or downshift disturbs the detection performance. So, to keep baseline at the accurate position (zero mean position), mean value of the signal is subtracted from the original signal y(n).
(ii) Adaptive linear prediction: It is the prediction model of linear adaptive filtering. A predictor guesses the present signal sample y(n) from the sum of products of delayed signal samples y(n-k) with filter coefficients h(k). The filter coefficients are updated in each iteration, based on the immediate prediction error e(n) among the predicted signal sample ̂ and desired signal sample c(n) with an objective function of lessening the mean square error(MSE).
Fig.3. Proposed Methodology
Parameters of ECG signal like RR interval, QRS width, Heart rate, PR interval, SDSD, RMSSD are calculated, where SDSD is the standard deviation of successive difference of R peaks & RMSSD is the root mean square value of successive difference of R peaks on time interval basis. A graphical user interface includes all the steps of block diagram in popup menu; by selecting any step corresponding waveform can be observed. Developed GUI also represents the extracted ECG features and arrhythmia detection. HRV(Heart rate variability) parameters like SDSD and RMSSD gives the time domain analysis of ECG signal. The RMSSD is associated to the high-frequency (HF) energy ranges from 0.15 Hz to 0.4 Hz. Lower RMSSD values interrelated with high risk of sudden mysterious death in epilepsy. The SDSD measures how these intervals vary over time and is more precise when considered over 24 h because this longer duration better signifies slower processes [5].
RLS Algorithm: Related to all LMS algorithms, RLS algorithm has a faster convergence speed and do not exhibit
eigen value spread difficulty. It is a process of least squares for automatically regulating the coefficient of a FIR filter without invoking conventions on the statistics of input ECG signal. The approximation of RLS algorithm is done by reducing the sum of squares of sudden error values. The purpose for faster convergence of this algorithm is, it denoise ECG signal by using inverse correlation matrix of the information expected to be zero mean and also because it uses all the data contained in input data from, start of adaptation to the present. This enhancement is realized by increasing computational complexity of RLS filter. Inverse correlation matrix is figured directly in RLS algorithm. Due to this feature RLS algorithm does not need any matrix inversion calculations. The following equation delivers the update coefficient for RLS algorithm [6].
(1)
Where k(n) is the gain factor defined by
where λ (1) is the forgetting factor which lies in the range 0< λ≤1, and p(n) is the inverse correlation matrix of x(n) defined as
(3)
where is the regulation factor which is the preliminary value of inverse correlation matrix. The constraints that can be adjusted in this algorithm are forgetting factor (λ) and regulation factor ( ). The RLS algorithm uses the subsequent equation to appraise inverse correlation matrix [6]
(4)
Savitzky-Golay (SG) Filter: Savitzky-Golay (SG) filter are mostly employed for smoothing and separation. They were
considered smoothing and separation filter approximating polynomials of zero to fourth request with 3 - 25 point lengths. Filter coefficient of the low pass filter and high pass filter are given by the Savitzky Golay algorithm. The coefficient of filters determine by the practical values. Depends on the order of filter and cut off frequency, here order is 3 and cut off frequency is 15 for low pass filter [7].
Fig.4.Savitzky-Golay filter
Adaptive thresholding and R peak detection: The R-Peak is the most noticeable part of an ECG signal examination,
which relates to the contraction of the ventricles for the duration of a heartbeat. The detected R-peaks are not continuously correct always and can have missed or false positive peaks. Proposed algorithm escalates detection sensitivity by processing the RR interval. There may be two reasons behind the missing of R-wave. In first instance, the ventricles do not produce the R wave. Hence, in second instance, due to inappropriate ventricular conduction the peak of the R-wave is not satisfactory enough, which is a reason of shortage of oxygenated blood supply to the ventricular muscles [7]. Though, it does not contract sufficient to produce a typical R-wave. R peaks are detected by applying a threshold (THR_SIG) situation on the amplitude of the moving average filtered signal as shown in equation:
THR_SIG = 0.43*max (ema(1:700)) (5)
where ema represents the enhanced moving average signal in sample range 1 to 700. R-peaks happen periodically in an ECG signal. The threshold situation also provides dissimilar values in each period comprising peaks. The specific R-peak in any period is nominated by taking the mean of the all the detected R R-peak values in that period.
∑
III.FEATURE EXTRACTION
The window for the P-wave in one R-R interval is designated by beginning from 65% of the R-R interval added to the 1st R-peak position and ongoing to 85% of the R-R interval added to the same position.The Q-peak is selected by choosing minimum value in the window beginning from 20 ms before the corresponding peak and that specific R-peak. In the same way the S-peak is selected by choosing the lowest value in the window beginning from R-peak to 20 ms after that R-peak [8].
PR Interval: P-R interval is calculated by following formula:
Where indicate sampling frequency indicates R peak locations and indicates P peak locations. The above formula produces an array of PR interval values, which are then averaged out to acquire single PR interval [8].
QRS Duration: Formula for QRS duration is as follows:
( )
Where x indicates instant 5 ms, these samples are added to and are subtracted from because QRS duration is demarcated from start of Q peak till end of S peak. and denote S and Q peak locations respectively. This formula provides an array of QRS duration, which is then averaged to acquire single QRS duration [8].
Heart rate: Heart rate depends on RR interval which is computed by formula:
Heart rate measured in beats per minutes (bpm) and ranges from 60 to 100 bpm for a normal person in resting state.
Performance Measures: Two parameters used for estimating performance of proposed algorithm. Those are sensitivity
and positive predictivity. These parameters are well-defined using 4 measures Total beats (TB), True Positive (TP), False Positive (FP), and False Negative (FN).
Total beats (TB): Total no. of R peaks i.e. one R peak corresponds to one heartbeat.
True Positive (TP): Correctly detected peaks.
False Positive (FP): Falsely detected peaks.
False Negative (FN): Undetected peaks (FN=TB-TP)
Sensitivity: Sensitivity states to the amount of correctly classified positive. Sensitivity may be denoted as a true positive
rate. For a classifier sensitivity should be maximum and calculated in percentage [9].
Se(%)=
(10)
Positive predictivity: Positive predictivity is the chance that disease exists when investigation is positive, which is by
how much extent disease is appropriately predicted [9].
+P(%)=
(11)
Arrhythmia: Cardiac Arrhythmias indicates a situation of abnormal electrical activity in the heart which is a risk to
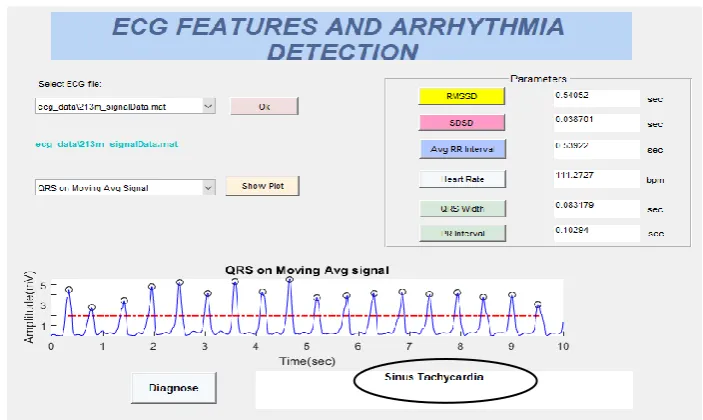
Proposed GUI: A graphical user interface was developed which represents ECG features like RR interval, QRS width, PR interval and Heart rate with the analysis of waveforms. Here arrhythmia detection is the application of developed GUI. Different arrhythmias like Sinus Bradycardia, Sinus Tachycardia, Ventricular Tachycardia, First degree heart block, Bundle branch block are diagnosed on the basis of computed parameters.
Working of Graphical User Interface includes following steps explained below:
1. Select the ECG file from popup button which has offline data saved into a database directory. 2. Load the ECG signal by clicking on OK button.
3. Show plot pushbutton represents the waveform of each block of proposed methodology by selecting specific block from popup button.
4. Parameters like Avg RR Interval, QRS width, PR Interval, Heart Rate, RMSSD, SDSD can be obtained by clicking on corresponding pushbuttons.
5. Type of detected arrhythmia can be analysed by clicking on Diagnose pushbutton.
IV.EXPERIMENTAL RESULTS
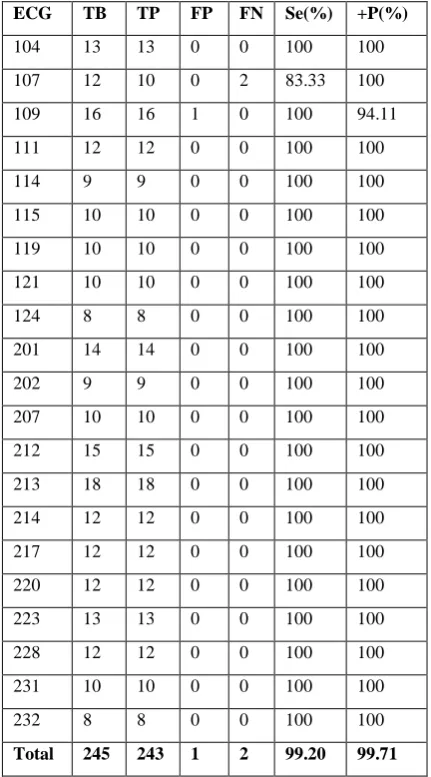
Table 1 represents the performance parameters obtained by proposed methodology. Total 21 ECG signal tested here which includes 9 males of age group 53-77 and 12 females of age group 32-89.
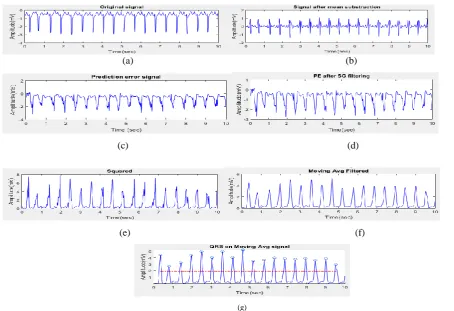
(a) (b)
(c) (d)
(e) (f)
(g)
Table 1: Performance Parameters Table 2: Performance comparison of various QRS detection techniques
ECG TB TP FP FN Se(%) +P(%)
104 13 13 0 0 100 100
107 12 10 0 2 83.33 100
109 16 16 1 0 100 94.11
111 12 12 0 0 100 100
114 9 9 0 0 100 100
115 10 10 0 0 100 100
119 10 10 0 0 100 100
121 10 10 0 0 100 100
124 8 8 0 0 100 100
201 14 14 0 0 100 100
202 9 9 0 0 100 100
207 10 10 0 0 100 100
212 15 15 0 0 100 100
213 18 18 0 0 100 100
214 12 12 0 0 100 100
217 12 12 0 0 100 100
220 12 12 0 0 100 100
223 13 13 0 0 100 100
228 12 12 0 0 100 100
231 10 10 0 0 100 100
232 8 8 0 0 100 100
Total 245 243 1 2 99.20 99.71
From tables 2, it can be observed that presented methodology has high accuracy than that of compared techniques. Fig.(a) to Fig.(g) represents the output waveforms.
Fig. 5 represents the QRS complex detected by the proposed methodology. The R peaks detected by current technique denoted by small black circles and red dashed line denote the adaptive thresholding which means those peaks lie above this threshold are detected and rest are undetected. In Fig. 6 various ECG parameters computed by clicking on corresponding pushbutton and arrhythmia detected by clicking on diagnose pushbutton. In selected ECG signal, heart rate is more than 100bpm so that type of cardiac arrhythmia detected is sinus tachycardia.
Methodologies Sensitivity
(Se)%
Positive Predictivity (+P)%
Wavelet Transform method [9] 94.12 88.90
Pulse triggering based approach
[11] 97.63 99.33
Template matching algorithm
[12] 95.80 98.30
Wavelet Transform with histogram, moving average and two thresholds technique [13]
98.68 97.24
Second derivative with squaring, bandpass filtering and Variable thresholds comparison method [14]
98.08 99.18
Wavelets and artificial neural
networks method [15] 97.20 98.52
Geometrical matching algorithm
[16] 97.94 99.13
Fig. 6 Parameter Calculation and Arrhythmia Detection
V. DISCUSSION
The advantage of using adaptive filtering method is that it guesses the underlying signal even in nonappearance of former information about statistical properties of the signal and noise due to which, this methodology is resistant to a sound degree to all kinds of noises and gives improved detection results. This adaptive filtering based process of QRS recognition also suggest a benefit of multitasking such that the prediction error(PE), which is computed only once, can be used not only for QRS detection but also the purpose of ECG compression. Simplicity, consistency and familiarity are the benefits of proposed GUI which provides unity, clarity, directness, alignment, integrity, comfort and charm. One can easily analyze the different waveforms with their extracted features and diagnose the type of arrhythmia by just clicking on a pushbutton.
VI. CONCLUSIONANDFUTURESCOPE
Adaptive filtering also achieves improved detection of delayed potentials. During recording extra ventricular waveform formed due to which artifacts generated that are also removed with adaptive filtering. So that Sensitivity of 99.20% and Positive Predictivity of 99.71% achieved by proposed algorithm. The graphical user interface is effective and convenient way for analysing ECG waveform, extracting ECG features and diagnosing cardiac arrhythmias. Developed GUI can be extended for real time QRS detection and arrhythmia detection. More cardiac arrhythmias like atrial and ventricular fibrillation, second degree heart block etc. can be detected using proposed graphical user interface. HRV (Heart rate variability) frequency domain analysis can also be included in developed GUI. Proposed graphical user interface can be further extended for commercial handheld devices.
REFERENCES
[1] Anand Kumar Joshi, Arun Tomar, Mangesh Tomar,“A Review Paper on Analysis of Electrocardiograph (ECG) Signal for the Detection of Arrhythmia Abnormalities”, International Journal of Advanced Research in Electrical, Electronics and Instrumentation Engineering, vol. 3, no. 10, pp. 12466–12475, 2014.
[2] Shweta Jain, M.K. Ahirwal, Anil Kumar, V. Bajaj, G.K. Singh,“QRS detection using adaptive filters : A comparative study”, ISA Trans., vol. 66, pp. 362–375, 2017.
[4] H. Limaye and V. V Deshmukh, “ECG Noise Sources and Various Noise Removal Techniques : A Survey”, Int. J. Appl. or Innov. Eng. Manag., vol. 5, no. 2, pp. 86– 92, 2016.
[5] Shaffer F, Ginsberg J, “An Overview of Heart Rate Variability Metrics and Norms. Frontiers in Public Health”, (2017), doi: 10.3389/fpubh.2017.00258.
[6] Y. Kamatham and N. Sultana, “Performance Analysis of Adaptive Filters for Denoising of ECG Signals”,Int. J. Innov. Res. Comput. Commun. Eng., vol. 4, no. 6, pp. 11356–11367, 2016.
[7] A. T. Bhatti, “R-Peak detection in ECG signal compression for Heartbeat rate patients at 1KHz using High Order Statistic Algorithm”, J. Multidiscip. Eng. Sci. Technol., vol. 2, no. 9, 2015.
[8] M. Umer, B. A. Bhatti, M. H. Tariq, M. Zia-ul-hassan, M. Y. Khan, and T. Zaidi, “Electrocardiogram Feature Extraction and Pattern Recognition Using a Novel Windowing Algorithm”, Adv. Biosci. Biotechnol., vol. 5, no. October, pp. 886– 894, 2014
[9] P. Keerthi Priya, Dr.G.Umamaheswara Reddy, “MATLAB Based GUI for Arrhythmia Detection Using Wavelet Transform”, Int. J. Adv. Res. Electr. Electron. Instrum. Eng., vol. 4, no. 2, pp. 807–816, 2015.
[10] Himanshu Gothwal, Silky Kedawat, Rajesh Kumar, “Cardiac arrhythmias detection in an ECG beat signal using fast fourier transform and artificial neural network”, J. Biomedical Science and Engineering, 2011, 4, 289-296.
[11] Nallathambi G, Príncipe JC, “Integrate and fire pulse train automaton for QRS detection”, IEEE Trans Biomed Eng, vol. 61, no. 2, pp. 317– 326, 2014
[12] Yozaburo Nakai, Shintaro Izumi, Masanao Nakano, Ken Yamashita, Takahide Fujii, Hiroshi Kawaguchi. et.al.,“Noise Tolerant QRS
Detection using Template Matching with Short-Term Autocorrelation”, IEEE, pp. 0–3, 2014.
[13] Chouakri SA, Bereksi-Reguig F, Taleb Ahmed, “A QRS complex detection based on multi wavelet packet decomposition”, Applied Mathematics and Computation (2011), 217: 9508–9525.
[14] Natalia M. Arzeno, Zhi-De Deng, and Chi-Sang Poon, “Analysis of First-Derivative Based QRS Detection Algorithms”, IEEE transactions on biomedical engineering, vol. 55, no. 2, February 2008.
[15] B. Abibullaev and H. Seo, “A new QRS detection method using wavelets and artificial neural networks”,Journal of Medical Systems, vol. 35, no. 4, pp. 683-691, 2011.
[16] K. Suarez, J. Silva, Y. Berthoumieu, P. Gomis, M. Najim, “ECG beat detection using a geometrical matching approach”, IEEE Trans. Biomed. Eng. 54 (2007) 641–650.
[17] Mathworks, Inc, Building GUIs with MATLAB: Version 5, December 1996.
[18] Seema Khadirnaikar, Aparna P, “A Feasible QRS Detection Algorithm for Arrhythmia Diagnosis”, Int. Conf. Adv. Electr. Electron. Syst. Eng., pp. 14–16, 2016
[19] Durgesh Kumar Ojha, Monica Subashini, “Analysis of Electrocardiograph (ECG) Signal for the Detection of Abnormalities Using MATLAB”, Int. J. Biomed. Biol. Eng., vol. 8, no. 2, pp. 120–123, 2014.
[20] M.R. Mhetre, Advait Vaishampayan, Madhav Raskar, “ECG Processing & Arrhythmia Detection: An Attempt”, International Journal of Engineering and Innovative Technology (IJEIT), vol. 2, Issue 10, April 2013.
[21] http://www.physionet.org.
[22] Chhatrapal Singh, Jaspinder Singh, “ECG Signal Denoising Using Digital Filter and Adaptive Filter”, Int. Res. J. Eng. Technol., vol. 4, no. 6, pp. 2043–2047, 2017.