University of Windsor University of Windsor
Scholarship at UWindsor
Scholarship at UWindsor
Electronic Theses and Dissertations Theses, Dissertations, and Major Papers
1-1-2007
Ultrasonic image analysis in real time spot welding applications.
Ultrasonic image analysis in real time spot welding applications.
Guangqian Shu
University of Windsor
Follow this and additional works at: https://scholar.uwindsor.ca/etd
Recommended Citation Recommended Citation
Shu, Guangqian, "Ultrasonic image analysis in real time spot welding applications." (2007). Electronic Theses and Dissertations. 6949.
https://scholar.uwindsor.ca/etd/6949
Ultrasonic Image Analysis in Real Time Spot Welding
Applications
By
Guangqian Shu
A Thesis
Submitted to the Faculty o f Graduate Studies and Research
Through the Department o f Electrical and Computer Engineering
in Partial Fulfillment o f the Requirements for
the Degree o f Master o f Applied Science at the
University o f Windsor
Windsor, Ontario, Canada
2007
Library and A rchives C an ad a
Bibliotheque et A rchives C an ad a
Published H eritage Branch
395 W ellington Street Ottawa ON K1A 0N4 Canada
Your file Votre reference ISBN: 978-0-494-34937-3 Our file Notre reference ISBN: 978-0-494-34937-3 Direction du
Patrim oine d e I'edition
395, rue W ellington Ottawa ON K1A 0N4 Canada
NOTICE:
The author has granted a non
exclusive license allowing Library
and Archives Canada to reproduce,
publish, archive, preserve, conserve,
communicate to the public by
telecommunication or on the Internet,
loan, distribute and sell theses
worldwide, for commercial or non
commercial purposes, in microform,
paper, electronic and/or any other
formats.
AVIS:
L'auteur a accorde une licence non exclusive
permettant a la Bibliotheque et Archives
Canada de reproduire, publier, archiver,
sauvegarder, conserver, transmettre au public
par telecommunication ou par I'lnternet, preter,
distribuer et vendre des theses partout dans
le monde, a des fins commerciales ou autres,
sur support microforme, papier, electronique
et/ou autres formats.
The author retains copyright
ownership and moral rights in
this thesis. Neither the thesis
nor substantial extracts from it
may be printed or otherwise
reproduced without the author's
permission.
L'auteur conserve la propriete du droit d'auteur
et des droits moraux qui protege cette these.
Ni la these ni des extraits substantiels de
celle-ci ne doivent etre imprimes ou autrement
reproduits sans son autorisation.
In compliance with the Canadian
Privacy Act some supporting
forms may have been removed
from this thesis.
While these forms may be included
in the document page count,
their removal does not represent
Conformement a la loi canadienne
sur la protection de la vie privee,
quelques formulaires secondaires
ont ete enleves de cette these.
ABSTRACT
The quality monitoring and process control o f spot welding has been a long problem for
automotive industry, at the technology much advanced today, many plants still use
laborious peeling test to evaluate its quality.
In this thesis, a new N DT method is purposed and implemented to develop a spot welding
monitoring and control application, which is based on ultrasonic wave testing technique,
image processing algorithms as w ell as fuzzy logic control theories. The general idea in
this thesis o f design and developing an automatic analysis and quality control application
using ultrasonic testing is very similar to other testing application, first the application
sends a specific frequency o f ultrasonic pulse wave to the test spot during welding
process, then uses the same transducer to capture the pulse echo signal (or another
transducer to receive the penetrated pulse signal), and converts the signals to a two-
dimensional B-Scan image in time domain, second the application then applies image
processing algorithms to detect the pulse pattern, after getting the pattern, the application
tries to correlate it with a nugget size template, estimates the welding size, third, based on
the estimated size, the application will send commands or adjust welding parameters for
the welding control machine, finally achieves an automatic analysis and real-time control
application.
The application has been tested in our lab, achieved good results. It can approximately
estimate the welding nugget size with about 5% to 25% error, by adjusting the optimal
value 30% larger than the required minimum size. The application can properly monitor
ACKNOWLEDGEMENTS
I want to express my sincere thanks to the professors who give me direct or indirect
support during m y graduate study and research work at the University o f Windsor.
My sincere appreciation first goes to Dr. Roman Mave, who is my supervisor, instructs
me to work on this ultrasonic testing research project, his guidance points me to the right
direction o f the research, his encouragement enables me to move forward, solve the
problems and his innovative idea leads me to successfully complete this research project.
I would also give my sincere appreciation to Dr. M.A. Sid-Ahmed, he gives numerous
support and encouragement during my two year’s study, his selfless teaching and broaden
knowledge help me learning on my academic research, his invaluable suggestions and
recommendations guide me to my master work and career track, his great personality and
friendly attitude educate me on my personal life, and it w ill be a perfect model for me to
follow.
My appreciations should also go to my thesis committee members Dr. Michael H. Wang
and other professors who directly or indirectly involve in this thesis research, thanks for
their support, suggestions and evaluation.
Finally, I would also like to give my thanks to the welding research group, without their
TABLE OF CONTENTS
ABSTRACT iii
DEDICATION iv
ACKNOWLEDGEMENTS v
LIST OF TABLES x
LIST OF FIGURES xi
CHAPTER 1. INTRODUCTION 1
1.1 What is NDT? 2
1.2 N DT History 2
1.3 N DT Methods 3
1.4 Briefly Introduce to Ultrasonic Testing 3
1.5 Ultrasonic Testing in Automotive Industry 4
1.5.1 Real-time Ultrasonic Testing 7
1.5.2 Acoustic Impedance 8
1.5.3 Frequency Used for Ultrasonic Testing 10
1.5.4 Angle o f Reflection 11
1.5.5 Perpendicular Incidence Testing 12
1.5.6 Transducers used in Testing 13
1.6 Spot Welding Parameters 14
1.6.1 Welding Current 14
1.6.2 Welding Time (Welding Cycles) 14
1.6.3 Welding Pressure 15
1.6.4 Resistance, Coating and Electrode Shape 15
1.7 Spot Welding Control 16
1.8 Organization o f Thesis 17
CHAPTER 2. SIGNAL SAMPLING 18
2.1 Signal Processing Overview 18
2.1.3 Digital Signal 19
2.1.4 Digital Signal Processing 20
2.1.5 Digital Signal Processing Applications 21
2.1.6 Advantages and Disadvantages o f Digital Signal Processing 22
2.1.7 Sampling Theorem 23
2.2 Ultrasonic Wave Signal 23
2.3 Ultrasonic A-Scan Signal Sampling 24
2.3.1 Introduce to A-Scan signal 26
2.3.2 A-Scan Pulser 28
2.3.3 A-Scan Signal Sampling 29
2.4 B-Scan Image Formation 31
2.4.1 Computer Representation o f A-Scan signal 32
2.4.2 B-Scan Image Formation 32
2.4.3 Display o f B-Scan Image 33
2.4.4 Timing Between Every A-Scan in B-Scan 35
2.4.5 Save a B-Scan Image 36
CHAPTER 3. IMAGE ANALYSIS 38
3.1 Image N oise 38
3.1.1 Gaussian N oise 38
3.1.2 Impulsive N oise 39
3.1.3 Unwanted Pulse Reflections 40
3.1.4 Signal Lost 41
3.1.4 Zigzag Pulse 42
3.2 Image N oise Estimation 43
3.2.1 Image Mean and Variance 43
3.2.2 Signal to N oise Ratio 47
3.2.3 Algorithm for Automatic N oise Identification 48
3.3 Image N oise Filtering 50
3.3.1 Gaussian N oise Filtering 51
3.3.3 Mean Filtering 5 6
3.3.4 Frequency Filtering 57
3.3.4.1 Fourier Transform 58
3.3.4.2 Properties o f Fourier Transform 60
3.3.4.3 Image in Frequency Domain 60
3.3.4.4 The Frequency Filter 62
3.3.5 Missing Signal Repair 69
3.4. Image Effective Area Detection 70
3.5 Pulse Contour Detection 72
3.6 Current Stop Point Detection 74
3.7 Nugget Segmentation 76
3.8 Segmented Line Detection 78
3.9 Nugget Formation 81
CHAPTER 4. TEMPLATE MATCHING 84
4.1 Introduction to Template Matching 84
4.2 Building Template 86
4.3 Template Matching 88
4.4 Detection Accuracy 89
CHAPTER 5. WELDING CONTROL 91
5.1 Control Solution 1 91
5.2 Control Solution 2 94
CHAPTER 6. INTRODUCE TO THE APPLICATION 96
6.1 Application Requirement 96
6.2 Application Architecture 97
6.3 Installation 98
6.4 Configuration 99
CHAPTER 7. CONCLUSIONS 103
REFERENCES 105
LIST OF TABLES
Table 1 -1, Spot welding parameters 16
Table 2-1, Ultrasonic wave velocity in materials 27
Table 5-1, Fuzzy control rules 93
LIST OF FIGURES
Fig 1 -1, First N D T conducted by Rontgen 3
Fig 1-2, Pulse echo testing mode 4
Fig 1-3, Spot welding in automotive industry 5
Fig 1-4, Relationship between pulse velocity and temperature 6
Fig 1-5, Real time spot welding configuration 7
Fig 1 -6, Pulse energy transmitted between layers 10
Fig 1-7, Human ear respond to sound 10
Fig 1-8, Snell’s law o f refraction 11
Fig 1-9, Interfaces generate interested pulse echoes 12
Fig 1 -1 0 ,1 0 MHz ultrasonic transducer 13
Fig 1 -11, Welding machine 16
Fig 1-12, Relationship between testing application and control machine 17
Fig 2-1, Analog signal and discrete signal 19
Fig 2-2, Digitized signal 19
Fig 2-3, An example o f signal processing 20
Fig 2-4, Longitudinal wave and shear wave 24
Fig 2-5, Pulse signal sampling 25
Fig 2-6, Decrease o f pulse energy 26
Fig 2-7, Source pulse used in testing 29
Fig 2-8, Sampled pulse from time 0 to 35 microseconds 29
Fig 2-9, A-Scan signal 31
Fig 2-10, A /D sampling timing 31
Fig 2-11, Formation o f B-Scan 33
Fig 2-12, Gray color setting 34
Fig 2-13, B-Scan image 34
Fig 2-14, Timing between A-Scans 35
Fig 2-15, B-Scan file format 36
Fig 3-3, Unwanted reflections in B-Scan 41
Fig 3-4, A-Scan signal lost 42
Fig 3 -5, Zigzag pulse 43
Fig 3-6, Standard deviation o f B-Scan images 46
Fig 3-7, Gaussian filter 52
Fig 3-8, Images before and after Gaussian filtering 54
Fig 3-9 Images before and after median filtering 56
Fig 3-10, Images and their frequency spectrum 62
Fig 3 -11, Low pass filters 63
Fig 3-12, Construction o f band rejecter 64
Fig 3-13, Band rejecter filter 65
Fig 3-14, Band rejecter used for unwanted reflection removal 66
Fig 3-15, Images before and after band rejecter filtering 66
Fig 3-16, Band rejecter used for zigzag removal 67
Fig 3-17, Images before and after band rejecter 68
Fig 3-18, Band rejecter used for unwanted reflections and zigzag removal 68
Fig 3-19, One step o f band rejecting 69
Fig 3-20, M issing A-Scan signal repair 69
Fig 3 -21, Effective area detection algorithm 71
Fig 3-22, Images and their effective area 72
Fig 3-23, Edge search 74
Figure 3-24, Contours detected 74
Fig 3-25, Illustration o f critical point 75
Fig 3-26, Critical point search 76
Fig 3-27, Basic pulse pattern shapes 77
Fig 3-28, Image segmentation 78
Fig 3-29, Edge direction and norm 79
Fig 3-30, Detected edges 79
Fig 3 -31, Illustration o f Hough transform 8 0
Fig 3-34, Detected pulse nugget o f images 82
Fig 4-1, Weld and its peeling test 84
Fig 4-2, Segmented lines to substitute curve 85
Fig 4-3, Template structure 86
Fig 4-4, Template model 87
Fig 4-5, Records in template 88
Fig 4-6, Nugget computation error 89
Fig 5-1, Fuzzy parameter error control 92
Fig 5-2, Fuzzy logic control 92
Fig 5-3, Request/Answer model 93
Fig 5-4, Control solution 2 95
Fig 6-1, Application architecture 97
Fig 6-2, Installation wizard 98
Fig 6-3, HMI o f testing application 99
Fig6-4, Application settings 100
Fig 6-5, Image analysis result 101
Chapter 1
INTRODUCTION
In manufacturing industry, Non-Destructive Testing (NDT) is an effective method used
for process control and quality control. The most important advantage o f NDT is that the
inspection on an object w ill not change the object’s physical shape or destroy material’s
property, it not only saves manufacturing cost, but also more efficient in production. The
most widely used N DT methods are x-ray inspection, ultrasonic wave inspection, optical
light inspection, electrical current inspection Mid magnetic surface inspection etc, the
common point o f these methods is by projecting one kind o f energy to the object surface,
then measure the echo signal at the surface or the penetrated signal on the other side o f
the object.
While NDT has been used in aircraft industry for a long time, but in automotive industry,
it is relatively new, a lot o f parts testing, especially the body structural evaluation is by
tearing them apart, then checking quality visually. The disadvantage is obviously, it can
only evaluate the testing parts, and estimate but not accurate evaluate the rest parts. For
this reason, researchers are trying to work out efficient and accurate NDT evaluation
applications, which can be effectively used in automotive industry. Among these research
applications, some are based on ultrasonic wave testing method, some are based on other
NDT testing techniques, and they serve different requirement applications. Because the
speed o f ultrasonic wave traveling in a material is much slower than optical light or
electrical current, researchers usually take this advantage to analyze ultrasonic wave in
time domain, further it poses no hazard or danger to human being compare to x-ray, so it
is more common that engineers use ultrasonic testing rather than other testing techniques,
in industry. Besides the above advantages, ultrasonic wave has a good penetrate ability
and is good for most engineering material evaluation.
For the automotive body structural evaluation, it is very crucial that only good spot welds
will meet the safety standards, a failed or under welding weld will degrade the auto safety
in case o f crash. To ensure its safety, researchers applied real-time control theory, NDT
dimensional acoustic wave analysis, neural net based welding quality predication etc., all
these efforts have achieved outstanding results, however most o f these evaluation systems
still can not directly estimate the welding nugget size, they can only give a rough pass or
failure result, and most o f them have not come out with an automatic analysis system in
real-time environment. These evaluation systems can process signal data information and
can correlate it with welding quality, but they also need human’s intervention, in order to
process the data information correctly.
1.1 What is NDT?
N DT is short for Non-Destructive Testing, it is a method used by engineers to test and
evaluate structural components without changing their properties or damaging their shape.
NDT is a very broad, interdisciplinary field, it not only includes testing, but also includes
verification and evaluation, it plays a critical role in all kinds o f industries, for example
pipe line evaluation in oil industry, air plane structural testing, automotive body structural
testing in manufacturing industry, rail way track testing, all these testing are performed in
a manner that will not affect the testing object or material’s usefulness, which means
there should have no physical change effect on the testing object. N DT is carried out in a
situation where the testing part is unreachable by human or machine, or invisible to
human being, and the way o f testing is usually reliable and cost effective.
1.2 N D T History
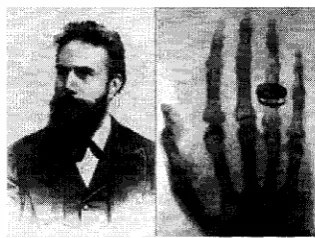
The earliest NDT was conducted in the later 1895, by a German physics scientist called
Wilhelm Conrad Rontgen. Rontgen saw his own radiographic image while he was
investigating the ability o f x-rays. N ow X-rays are widely used in medical field to reveal
the architecture o f the bone and other soft tissues and to find out any abnormality in the
form o f fracture, growth o f tumor etc. It is also used in dental imaging. In addition, x-rays
are also used in engineering field as a method’o f NDT, airport security measurement like
Fig 1-1, First N DT conducted by Rontgen
1.3 NDT Methods
There are a number o f NDT methods that can be used to inspect components and make
measurements, this number is large and is still growing, because researchers continue to
find new ways o f applying physics and other scientific disciplines to develop better NDT
methods. However, there are only eight basic NDT methods that are used most common.
These methods are optical visual inspection, penetrant testing, electrical magnetic particle
testing, eddy current testing, radiography, acoustic emission testing, leak testing and
ultrasonic testing. These methods service for different testing purpose, since no single
NDT method can solve all the engineering problems, engineers have to adapt one method
that is based on the testing environment, cost, effectiveness and efficiency.
In automotive industry, ultrasonic testing is more commonly used for body structure
evaluation, because its technology is easy to apply or can be easily integrated into
manufacturing systems, the running cost is very low and the testing result is immediate
and accurate.
1.4 Briefly Introduce to Ultrasonic Testing
Ultrasonic testing uses a transducer to generate high frequency sound waves, on a range
o f hundreds o f kilohertz up to dozens megahertz, and send these waves into testing
object or material, when the sound waves travel through the material, if there is any
defect, crack, discontinuities or property change in material, part o f the wave energy will
be reflected, the same transducer then catches this energy, records the pulse information,
it is called pulse echo mode, or a second transducer only receives the energy which pass
then be analyzed to determine the presence o f material flaws, changes in thickness, or
changes in properties.
Fig 1-2 is a typical pulse echo mode, the transducer generates high frequency ultrasonic
energy driven by the pulser, the sound energy is then introduced and propagates through
the materials in the form o f waves. When there is any change in the wave path, part o f the
energy will be reflected back from the flaw surface. The computer then captures the
reflection and records it as a signature, if the signature is displayed in time domain. Then
the signal travel time related to the defect size shape, orientation information can be
extracted.
Software 1
z z m
r
Mo:ion Control i
V
A /I Sampling £ Pul ser/E.ec eiver
Motion
Transducer
Pulse
Crack
'Object
Fig 1-2, Pulse echo testing mode
1.5 Ultrasonic Testing in Automotive Industry
In a technology competitive world, all car manufacturers must take serious consideration
o f their product quality, performance and structure safety. The strict standards require
automotive industry using advanced technologies to build automobiles, safety and quality
must be evaluated and be guaranteed before their products can reach to customers, ensure
these issues is also a way that manufactures can avoid costly recalls. Ultrasonic testing is
a technique that engineers can use it to evaluate procedures to ensure product quality, it is
believed to be widely used in air plane manufacturing industry, but not effectively
adopted in automotive industry, many auto manufacturers still use costly and laborious
relatively fresh applied engineering course. Before it can be applied into this industry, a
few technical problems still need to be solved first, for example, how to evaluate the
structure welds in a real-time environment. A lot ultrasonic testing equipments evaluate
components in a non real-time environment, such as engine components testing, harness
leak testing, body structural strength testing etc. The purposed methods described in this
thesis regarding to ultrasonic testing, image processing and fuzzy logic control provide a
general solution to the above real-time evaluation problem.
Fig 1-3, Spot welding in automotive industry
The structure o f an automobile body consists o f many pieces o f metal plates, these plates
are joined together by different joint techniques, including MIG welds, laser welds,
resistant spot welds and adhesive bonding. This thesis only discuss one kind o f welding,
which is the most introduced during body-in-white manufacturing, each body can consist
o f 3000 to 4000 welds. Since there is no visibility to tell welding quality, N DT method is
the only way that engineers can use it to evaluate its quality rather than destructive
testing, which makes parts useless. There is no difference in principle between ultrasonic
testing and evaluation in spot welding and ultrasonic testing in other fields, both use high
frequency ultrasonic waves generated by an electrical pulser as a testing signal, this
signal (wave energy) is then introduced and propagates through the welding metal sheets,
in between every interface, part o f sound energy w ill be reflected to the transducer, the
computer captures these reflection signals and evaluate the weld quality. Most ultrasonic
testing used in spot welding is post-process evaluation, which have a few advantages:
1. The equipment can be very simple with one computer and one probe, usually can
be carried by one person and is suitable to evaluate all spot welds
3. Evaluation result is immediate and accurate, since ultrasonic wave is sensitive to
any property change, crack or discontinuities
However there are also some disadvantages:
1. It is not suitable for real-time monitoring and control, for example if no good or
bad spot welds happened during welding, it can not tell and correct the welding
process immediately, so waste parts may be generated
2. Inaccurate result may happen due to technicians operation error or visual error
3. It is still laborious for technicians and costly i f a factory does thousands welds
everyday
For these reasons, researchers come with another form o f spot welding evaluation system,
it’s called in process ultrasonic testing. The general evaluation idea is the same as the
above, but its pulse was introduced and propagates through the metal sheets during the
welding process instead o f after welding, the reason is that engineers take the advantage
o f a very important ultrasonic physics character, that is:
The velocity o f ultrasonic wave will slow down in the transmission medium, if the
temperature o f the transmission medium increases. In other words, it takes more time for
ultrasonic wave to go through the same thick metal sheet when the temperature is higher
than that o f temperature is low.
Fig. 1-4, A German Scientist Von W. Kurz study, illustrates the relationship between
ultrasonic wave travel speed and temperature in metal plates.
o
6 0 0 0
5 5 0 0
5000
4 5 0 0
4 0 0 0
3 5 0 0
3 0 0 0
■sow
T ( " C )
This physics character o f the wave velocity delay can explained in two mechanisms, first
and the strongest contribution is the heating, about 70%, the second is the thermal
expansion o f the metal sheet, 2% to 4% o f the thickness, contributes 25% to 30% o f
velocity delay. This character is significant, the velocity can be slowed as much as 40%
to 50%, in the above graph, the velocity o f ultrasonic wave in steel is about 5800 m /sec at
room temperature, it slows to about 3800 m /sec when the steel temperature is reached to
1800 °C, this graph also tells that at the point which the velocity has a sharp change, is a
melting point o f metal, at temperature between 1380 °C to 1510 °C. The character o f the
velocity delay is the fundamental theory o f this type o f ultrasonic testing, since the wave
signal can be expressed, viewed and analyzed in a time domain, it helps engineers to
understand the temperature property changes inside the testing object.
1.5.1 Real-time Ultrasonic Testing
As mentioned above, the ultrasonic velocity delay character in high temperature material
is a great engineering advantage, which contributes to the success o f a lot o f real-time
ultrasonic testing equipments, these equipments measure the pulse echo in a time domain,
correlate it with the object property changes, it disregard the effects o f object crack or
discontinues properties, assume the echo was only generated by the interfaces o f different
layers. F igl-5 is a typical real-time spot welding configuration application.
FORCE
1
U L T R A S O T R A N S D U
WORK . /
WELDING—' TRANSFORMER:
W E L D IN G N U G G E T
M ETA L S H E E T - A .C . ROWER
T
CONTACTORFORCE
In this application, two pieces o f welding metal sheet was clamped in between two
shaped copper electrodes, by applying pressure and conveying the electrical current
through the metal pieces in short period o f time, the parts are heated immediately, the
material between the electrodes yields and is squeezed together. It then melts, destroying
the interface between the parts, the current is then switched o ff and a nugget o f molten
materials solidifies forming the joint, it is also called resistance spot welding.
To create the heat, a very high AC (alternative current) or DC (direct current) current,
usually thousands o f amperes, must be applied, the heat generated depends on the
electrical resistance and thermal conductivity o f the metal, and the time that the current is
applied. The heat generated is expressed by the equation:
E — I 2R t
(Eq 1-1)Where / is DC effect current, R is the resistance o f the sheet, t is the time span o f the
current applied, and E is the heat energy generated. This amount o f energy decides the
weld nugget size.
Copper metal is used for electrodes, because copper has a low resistance and high
thermal conductivity compared to most other conductors. This ensures that the heat is
generated in the welding pieces instead o f the electrodes. Steel has a higher electrical
resistance and lower thermal conductivity than the copper, making spot welding
relatively easy on steel sheet when using copper electrode. That’s why most spot welding
real-time applications use figure 1-5 configuration. Water is leaded into the electrode
chamber, used for cooling down the electrode temperature, the chamber also houses the
ultrasonic transducer, but there is one more important reason that water must be lead into
this chamber, it also works as a transmission medium to replace the non-transmittable
medium air. The following theory helps to understand this phenomenon.
1.5.2 Acoustic Impedance
Generally, when an ultrasonic wave is transmitted from one medium to another medium,
be transmitted through to the other medium. The factor that describes this relationship is
referred to as acoustical impedance and the acoustical impedance ratio.
z —
p C
(Eq 1-2)z 2
-r -
z
J
(Eq 1_3)
R =
(Eq 1-4)
z + z
V 2 r y
Where Z is acoustical impedance, p is the density o f the medium, C is the velocity o f
acoustic wave through medium, r is the acoustical impedance ratio, R is the reflection
coefficient, Z]and Z2 are the acoustical impedance o f the first medium and the second
medium.
Air has low acoustical impedance about 0.00041, water has an impedance o f 1.48, higher
than air, and steel has higher impedance than water. The acoustical impedance ratio is the
impedance o f the second material divided by the first. The ratio is a factor decided how
much energy w ill be reflected, when the ratio i s high, more energy w ill be reflected. For
example, when ultrasonic wave is passed from water to steel, the acoustical impedance
ratio is approximately 20 to 1, then the reflection coefficient is about 82%, it means that
at least 18% o f energy will pass through, whereas when ultrasonic wave is passed from
air to steel, the acoustical impedance ration is approximately 100,000 to 1, it means that
almost 100% o f the ultrasonic energy w ill be reflected when passing ultrasonic wave
from air to a solid such as steel, making air a very poor ultrasonic wave transmission
medium. That’s why water must be leaded into electrode chamber, not only just for
cooling purpose, but also to replace a transmission medium.
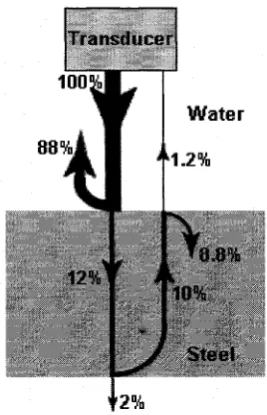
The following figure 1-6 is an example o f energy transmitted between layers, when the
transducer is placed in the water, as we can see, at the water steel interface, 12% o f the
energy is transmitted to steel. 88% are reflected, among the 12% that made it through,
10% o f the initial power is reflected at the steel’s lower surface, then most o f this energy
low part o f water, only 12% o f the 10% energy or 1.2% o f the original energy is
transmitted back to the transducer.
88%
I r a n s t I n n e r
W a te r
“ 1.2%
S te e l
Fig 1-6, Pulse energy transmitted between layers
From the reflection coefficient, we can also derive the transmission coefficient, which is
equal to one minus the reflection coefficient, it gives the amount percentage transmitted
through layers:
D =
1
/ \ 2
Z 2 + Z 1
( Z i + Z 2 )
(Eq 1-5)1.5.3 Frequency U sed for Ultrasonic Testing
The human ear can respond to an average frequency between 20 Hz - 20 kHz, frequency
below 12 kHz is considered as comfortable sound, it can freely travel through air and
most music sound band is within this value.
S ou n d p re ssu re
variation*
34s m/a
A tm ospheric T j
P r e s s o r s T
F r e q u e n c y r a n g e : 2 0 Hz to 2 0 KHz
While the majority o f ultrasonic flaw detection applications utilize frequencies between
20 kHz to 25 MHz, typical use is between 500 KHz to 10 MHz. At frequencies in this
range, ultrasonic wave can not travel through air or other gasses, but it travels freely
through most engineering solids or liquids.
1.5.4 Angle o f Reflection
Sound energy at high ultrasonic testing frequencies is highly directional. In the interfaces
where sound reflects o ff a boundary, the angle o f reflection equals the angle o f incidence.
A sound beam that hits a surface at perpendicular incidence will reflect straight: back. A
sound beam that hits a surface at an angle will reflect forward at the same angle. The
wave travel path from one medium to another in accordance with Snell's Law o f
refraction according to the formula:
t
Incident i R eflected
w a v e j w a v e
' V / j . .
\ 1 /Material 1
L>
:6
1
R
N ,Material 2 j 1 1 1 1 1
\ , Refracted w a v e
Fig 1-8, Snell’s law o f refraction
Sin 0
Sin 6
C
C
(Eq 1-4)Where Oj is incident angle in first medium, 0R is refracted angle in second material, C j is
sound velocity in first material, Cr is sound velocity in second material. This law tells us
that when angle Or reaches to 90° (a critical angle o f incidence) for the refracted ray,
which travels along the interface and decays exponentially with depth from the interface.
Therefore engineers can not successfully measure the ultrasonic wave and do the testing,
so any ultrasonic testing design should avoid such situation.
1.5.5 Perpendicular Incidence Testing
As mention above in this thesis, the precondition assumes that there is no cracks or
discontinues in spot welding, the test is to monitor the physics status changing process
within the joint spots. For this reason, only the TOF (time o f flight) information is
recorded, the strength o f the sound energy is not a parameter that this application will
monitor. So the transducer is usually placed at one side o f the testing spot, the ultrasonic
wave is perpendicular to the spot surface, in this manner, the same transducer w ill be able
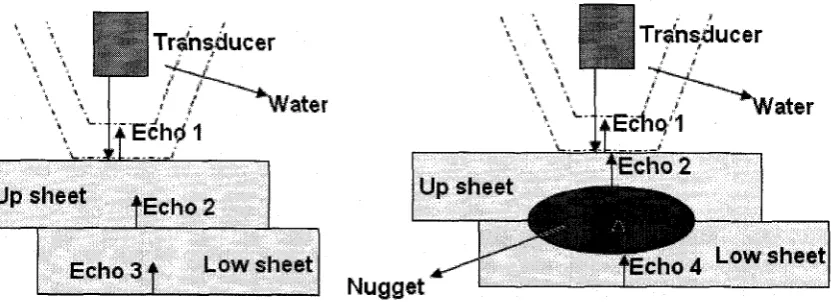
catch the reflection wave without moving its position. See figure 1-9:
Transducer
T ran sd ucer
'Water
Up sheet
Low sheet
Low sheet
Nugget
Fig 1-9, Interfaces generate interested pulse echoes
In this illustration, when the metal sheets are cold, only three interfaces generate
interested pulses, when two metal sheets are heated, the material around nugget, position
start melting, the interface between up sheet and low sheet was destroyed, a nugget start
forming, meanwhile the melting also creates two other interfaces, one is between the up
sheet and the nugget, the other is between the low sheet and the nugget, a total o f four
interfaces instead o f three exist during welding, all these four interfaces w ill reflect part
o f ultrasonic wave energy. The computer records these echoes at different times as
signature o f changing process, by analyzing this signature, the application can tell if the
1.5.6 Transducers used in Testing
There are several types o f ultrasonic transducers that can be used for thickness
measurement, such as contact transducer is suitable for the measurement was carried out
on testing object surface, delay line transducer is good to separate the excitation pulse
from back wall echoes, according to the spot welding field requirement, an immersion
type transducer is used and put in the electrode chamber where filled with water, it is
specially designed for testing object where partly or whole immersed, and it has these
advantages:
1. Contact to the testing surface is not necessary, it is very useful where direct
contact is impossible
2. A radio frequency shield is placed outside o f the transducer, which can greatly
reduce noise and improve signal quality
3. Immersion technology provides uniform signal sampling
4. Water resistance
The immersion transducer is able to measure an object between 0.1 mm to 40 mm, and
have good measurement accuracy with an error within ±0.002 mm, where most spot
welding sheet thickness is between 0.5 mm to 6 mm in automotive industry, it is good
enough for engineers to design a spot welding in-process application using immersion
transducer. There are two kind o f frequency transducers used in our lab, 5 MHz and 10
MHz. There is not too much difference between these two, except the 10 MHz has better
signal quality.
1.6 Spot W elding Parameters
There are numerous parameters will effect actual welding process and welding quality,
but researchers have identified only a few o f them have significant influence, these
parameters include welding current, welding time (cycle), welding pressure, metal
resistance, surface coating and electrode property (Shape).
1.6.1 W elding Current
This is the most important spot welding parameter, as we know, in order to form a nugget
between two sheets, a larger amount o f heat must be transmitted to the spot in a very shot
period o f time, Eq 1-1 tells us welding current has more influence than resistance R or
time t, since it has a square power influence, for example, i f current is doubled, the heat
amount will be equal to four times o f the previous value.
Welding current can be DC or either AC, it is controlled by welding control machine,
when the transformer contractor is turned on in fig 1-4, the weld current is immediately
available. The amount o f current to be used for different sheet welding is different, it can
also be controlled by the machine, and engineers have already determined the welding
currents to be used for different welding requirement through experiments.
1.6.2 Welding Time (W elding Cycles)
Welding time is the time during which welding current is applied to the metal sheets.
Since most welding control machine use AC current, it is more often to be expressed in
cycles, for example, if the system’s AC frequency is 60 Hz, and welding time is 0.3
second, then it is said to be 18 cycles. A s from the Eq 1-1, the heat generated is directly
proportional to the welding time, for example, when welding cycles doubled, the heat
w ill be doubled too. In a real environment, when the heat is transferred from the weld
zone to the metal sheets, a portion o f heat will be lost to the surrounding environment, the
amount o f lost is proportional to the welding time, to reduce heat lost and improve
welding efficiency, welding applications usually adopt short welding time with high
1.6.3 Welding Pressure
A very strong welding pressure vary from 400Lbs to 1200Lbs is applied to the welding
metal sheets, it is used to make the two sheets have a good contact, reduce the resistance
between two sheets and enable current to pass, it also squeeze the melting spots on the
two sheets to be joined together. If welding pressure is too low, expulsion may happen
during welding. If it is too high, the melting spot may be squeezed too thin, cau ses the
strength o f two jointing pieces too weak, leads to welding failure. A good welding
pressure has already been determined by engineers through experiments.
1.6.4 Resistance, Coating and Electrode Shape
The resistance effect to welding is mainly o f contact resistance in between the interface,
the rough surface, water, oil, or oxides all resist the current to pass through, but when
welding pressure applied, the contact area w ill substantial increase, within the first few
current cycles oil, water will be burned out, all these affects can be removed and the
contact resistance w ill be reduced. Coating effect will always be there, because coatings
are applied during metal sheet manufacture period, for corrosion protection o f the surface,
another coating effect comes from electrode surface, mainly because o f oil and chemical
material was burned, stays on the surface, these coatings will normally complicate the
welding process. The electrode geometry shape and dimensions also has very significant
effect, since they influence the current density and pressure distribution, thus affects the
welding result. There is no perfect method to change these parameters or solve the effects,
after setting the current, pressure and cycle parameters, welding application usually
ignore their effect.
The following welding parameter configuration in table 1-1 is used in a local automotive
plant, it shows that different combination is necessary for different thickness metal sheets
in order to meet different nugget size requirement.
Sheet thickness (mm* mm)
Welding current (A)
Welding cycles
Welding pressure (Lbs)
Nugget size (Diameter mm)
0.64*0.75 7000-9000 4-7 400 3.1
0.89*1.01 8500-11500 6-9 600 4.1
1.02*1.13 9500-12500 7-10 650 4.3
1.14*1.26 10000-13000 8-11 750 5.1
1.27*1.39 11000-14000 9-12 800 5.2
1.40*1.51 11500-14500 10-13 900 5.3
1.52*1.77 12000-15000 11-14 1000 5.4
1.78*1.97 13500-16500 13-1-6 1200 5.6
1.98*2.28 14500-17500 15-18 1300 6.1
2.29*2.66 15500-19000 17-20 1500 6.6
2.67*3.04 17000-20000 20-23 1800 7.1
Table 1- , Spot welding parameters
1.7 Spot W elding Control
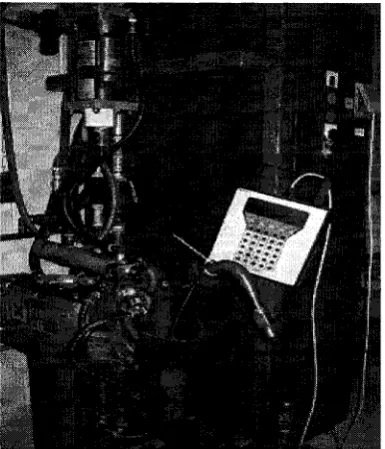
A robotic arm and a welding control machine are usually the two main parts o f a spot
welding control application, see figure 1-11, the control machine is used to set welding
parameters and control the welding process, where the robotic arm is the action part o f
welding.
The interest o f this thesis is to integrate ultrasonic testing into the welding process. The
ultrasonic testing application is designed to monitor the weld quality and based on the
results o f testing, the application may try to control the welding process by resetting
welding parameters on the control machine. Fig 1-12 shows the logic relationship
between the welding control machine and the ultrasonic testing application, the ultrasonic
testing application controls the welding control machine through Ethernet TCP/IP or
RS232 serial communication, data samples are transferred to the ultrasonic testing
application a parallel port.
TCP/IP or.
R S232 / w e ld in g C ontrol M a ch in e
Ultra
— a s
som e
I
■
■
I
Embedded^
A/D board
66 M
Trigger
' 1 Parallel port
FIFO
Transducer
Fig 1-12, Relationship between testing application and control machine
1.8 Organization o f Thesis
Chapter 1 provides basic knowledge o f ultrasonic testing in spot welding applications;
chapter 2 discusses ultrasonic signal sampling for spot welding testing application;
chapter 3 designs image processing algorithms to analyze spot welding ultrasonic image;
chapter 4 uses template matching technique to estimate weld nugget size; chapter 5
emphasizes methods o f how to achieve a fuzzy logic spot welding control application;
chapter 6 introduces the testing application developed for this thesis; chapter 7 is the
Chapter 2
SIGNAL SAMPLING
2.1 Signal Processing Overview
2.1.1 Analog Signal
A continuously changing process o f a real world phenomenon or energy level like water
level, sound, or pressure can be called a signal, the characteristic o f this signal is
continues in time, it can be expressed in a function o ff(x), where x means the continues
o f time, and as a nature phenomenon, it normally can not be measured by a meter or
oscilloscope unless a transducer converts this signal energy into electrical voltage or
current. By definition, an analog signal can be any continues energy signal, they are
varying from amplitude, frequency or phase, by observing or analysis o f these characters
in time domain, the physical changing process o f the original real world signal can be
determined. An acoustic wave used in ultrasonic testing is an analog signal.
2.1.2 Discrete Signal
A discrete signal or discrete-time signal is an ordered sequence o f values. Unlike a
continuous-time signal, a discrete-time signal is not a function o f a continuous time
argument, but a function over a domain o f discrete integers, it is usually expressed in a
function o ff(n ) orf(n T ), where n is an integer value, Tis a sampling period, most
frequently it is a series o f some measurement values, each value is also called a sample.
When a discrete-time signal is a sequence corresponding to uniformly spaced times, it has
an associated sampling rate or sampling frequency, this sampling frequency decides the
time space, when the sampling frequency increases, more values are sampled in the same
period o f time, when the sampling frequency decreases, results in less samples in the
same time period.
In ultrasonic testing, the measurements are a series o f discrete signals o f an acoustic
analog signal. Fig 2-1 shows how an analog signal is quantized into corresponding
f(x) f(n)
<? QQQ
pop
Tm Tl
Fig 2-1, Analog signal and discrete signal
2.1.3 Digital Signal
A digital signal is a discrete signal, moreover it is a digitized signal, which means that the
discrete character not only happens in time domain, but also happens to the signal value
itself. It typically derives from a discrete signal that has been quantized, its precision o f
quantization is measured in bits. Common practical digital signals are represented as 8
bits, 16 bits or 32 bits values. It is obvious that a digital signal can not accurately express
a sample, because it is discrete, it can only express signal value approximately. The
differences between the precise values and the closest values expressible by the numbers
from the given set form a sequence called quantization noise. Currently, owing to the
development o f digital technology, it is usually possible to use a number representation o f
such precision that the quantization noise is negligible in a given application. Fiig2-2
shows the analog signal (green color) has been digitized (in red color).
f ( n T )
o o
o o CD
O
CD
CD CD
O O O
t
2.1.4 Digital Signal Processing
Digital signal processing refers to those technical methods used for manipulating,
converting, digitizing, filtering analog signal to digital signal and or back to analog
signal, in order to make control, communication, monitoring more accurate. It usually
involves a clocked sampler, a A/D converter, a digital filter, and or a D /A converter, an
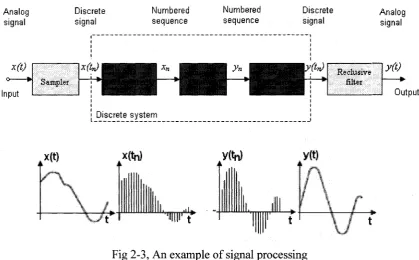
analog filter etc. The following figure shows a typical chain flow o f a digital signal
processing system.
A n a lo g D iscre te N um bered N um bered D iscre te A n a lo g sig n a l sig n a l se q u e n ce se q u en ce sig n a l signal
Reclusive
alter
Sampler
[ D iscre te s y s te m
Fig 2-3, An example o f signal processing
An analog input signal x{t), is being processed by a discrete system in order to obtain the
output analog signal y(t), the first element in the processing chain is a sampler which
provides samples x„ o f the input in the given time instants t„, the samples then form the
input sequence for the discrete system, where the signal is being digitally processed, like
filtering, manipulating or modifying, then the signal is sent to a D /A converter. Based on
the output discrete sequence y(n) provided by the discrete system, the continuous
function y(t) must be reconstructed by means o f the reconstruction interpolator. The
discrete system should accept samples o f the analogue input signal and provide an
analogue output. The core computing device must be preceded by an analog-to-digital
2.1.5 Digital Signal Processing Applications
With the development o f computer technologies, digital signal processing is widely used
in every field, from radio, TV to mobile phones, DSP is integrated into all wireless
communication devices, from digital computer, digital video player, digital camera to
digital A/D board, all digital devices process signals with DSP, data is being transferred
form one format to another format, DSP takes care o f the detailed steps, for example,
signal compression and decompression, noise filtering. Signal compression is used in
wireless communication devices to ensure great amount o f data is transferred, where like
voice and video image can be handled simultaneously on the same network, DSP signal
compression technology makes real-time video conference possible. N oise filtering
technology detects and filters out all kind o f noise, which was carried over during
transmission, it recovers the best quality original like signal, ensures data transmission
accuracy. In DVD system, DSP technology is used to perform complex error detection
and correction on the raw data as it is read from the DVD.
Based on the stages and characters used in DSP, its applications can be grouped in the
following category:
1. Processing, is the largest and most and most structured application group, most
DSP applications fall into this group, processing is characterized by both the input
data is a signal and the output data is also a signal, the two signals has direct one
to one relationship. The purpose o f processing is to provide the output signal that
is in a sense better or more appropriate than the input signal. In many applications,
the result o f this processing is the desired final product and no follow-up stages
apply. A particular use o f processing is signal restoration, which aims to
reconstruct the original signal from the noisy and distorted signal, details include
signal separation, noise filtering, signal modification etc.
2. Analysis, is to identify the properties o f the input signal, like frequency, phase and
amplitude characters o f the signal, as well as noise containments, the output o f
analysis is a description o f the signal in the form o f a set o f suitable parameters, it
3. Recognition an d classification, is to classify the problem belonging. The input o f
this stage is parameter result o f the analysis stage, and the output is a class type,
which the signal belongs to. It is usually characterized as intelligent decision
making and, if in an automatic process form, it belongs to artificial intelligence.
Neural network is a good example to be considered as an intelligent signal
recognition and classification processor.
Using DSP to solve the above applications sounds very complex and difficult, especially
in term o f integrating mathematical theories such as Fourier transform, Z transform,
digital filtering algorithm and signal compression, decompression algorithms, can be
fairly complex, but the good thing is with the advancements o f VLSI microchip design,
the numerical operations required actually to implement these techniques are very simple,
the architecture o f a DSP chip is designed to carry out such operations incredibly fast,
processing hundreds o f millions o f samples every second, providing a real-time
performance, that is, the ability to process a signal immediately as it is sampled and then
output the processed signal.
2.1.6 Advantages and Disadvantages o f Digital Signal Processing
DSP is being used in every field that we can imagine, researchers continue to find out
new areas that DSP can be used to solve engineering and science problems. The
advantages o f using DSP are numerous, but can be summarized to the following points:
1. After processing, the signals are more true likeness or more appropriate for use
2. Signals are discrete, easy to store in memory devices
3. Flexible, DSP chips are easy to reprogram for other purpose use
4. Simplify analog problem to digital problem, which is easier to be solved by digital
computers
5. Efficient and fast to perform mathematical operations
A few disadvantages should also be mentioned:
1. Processing is limited to some frequency range and bit range
2.1.7 Sampling Theorem
A signal is frequency band limited, above such a frequency where its signal energy is
zero. Let
x(t)
denotes the continues analog signal, then its Fourier transform o f the signalis:
00
X ( j w ) =
fx (
t)e~,wdt
(Eq24)
— GO
X (j w ) = 0 for all j w > B where B is the band limit
Let X d(t) denotes the samples o f
x(t),
x/t)= x(n T )
n = ...-2,-1,0,1,2...
T
is the sampling periodThen
x(t)
can be exactly reconstructed from its samples X a (t) ifX(jw)=0
for all |ro|>ff/T.
The discrete Fourier transform o f
x<t(t)
from sample 0 to N -l is:N- 1
W V ) rJ r \ ^ ~ j a )d n T
(Eq 2-2)
n=0
To reconstruct
x(t)
from its samplesx(nT),
we simply take the inverse Fourier transform(IFT) o f
X,i((jwT).
x ( t )
=
IFT [ X d{ e iaT
)]
=
IFT { D F T
[
x ( n T
)]}
(EqM)
The condition for exact reconstruction from samples is that the sampling frequency meets:
f , > 2 B
X d {e
jWdT) =
T ^ x i n T y ^ " 1
2.2 Ultrasonic Wave Signal
As mentioned above ultrasonic wave does not travel through air, because the acoustic
impendence o f solid material to air, but it can travel freely in most solid materials, which
become the medium to carry the ultrasonic wave. Materials are comprised o f atoms,
vibration or oscillation near their equilibrium positions. The movement o f many atoms in
unison produces a mechanical wave, which is-an acoustic wave.
Based on the material particles oscillation, ultrasonic wave can propagate through solid in
the following four modes:
1. Propagates as longitudinal wave
2. Propagates as shear wave
3. Propagates as surface wave
4. As plate wave in very thin material
Longitudinal wave and shear wave are the two waves most widely used in ultrasonic
testing waves. In longitudinal wave, the oscillations occur in the longitudinal direction or
the direction o f wave propagation; in shear wave, the particles oscillate at a right angle or
transverse to the direction o f propagation. Shear wave is relatively weak when compared
with longitudinal wave and it could not effectively propagate in liquids.
* * 4 3 K 8 I: f 9 * * s * m i t s s
* « !• m> s * i ?
Direction of j particle movement j
I
u
T " '
• * *■■=•?' Direction of wave ; propagation Longitudinal wave
| • Particles at r e s t position
Direction of * -' particle movement
* M * *«
ill; i r *«5: j *
Direction of wave propagation I:
Shear wave
Fig 2-4, Longitudinal wave and shear wave
2.3 Ultrasonic A-Scan Signal Sampling
When an application samples a real dynamic signal using an analog to digital converter
system, like data acquisition system or a digital oscilloscope, the sampled signal may not
look exactly the same as the original signal. Some signal amplitude distortion would
or aliasing, a higher frequency A/D converter is usually necessary, besides a protecting
shield, a high pass filter, a low pass filter or a band pass filter should also be put into the
network, to filter out noise and reduce the outside signal interference.
As mentioned in the last chapter, ultrasonic testing normally uses 500 KHz to 10 MHz
ultrasonic wave as testing signal, a higher wave frequency gives better penetration at the
interfaces, that means more wave energy will pass through interfaces and reach to the
testing material, it is also true that more energy w ill be reflected back to the transducer
from testing material. This phenomenon explains one theory, that is, a higher frequency
ultrasonic wave can result in more accurate testing. That is why many engineers use
mega Hz frequency for testing.
In this thesis, a 10 MHz frequency transducer is used for generating ultrasonic pulse and
receiving the echo signal. At the beginning o f the test, the application sends out an
electrical signal to the transducer, the transducer is therefore being excited and it
converters the electrical energy into sound energy, a high frequency ultrasonic wave in
the mode o f longitude format starts propagating through transducer coating, water,
electrode tip and testing material, in between every interface, a portion o f wave energy
will be reflected back to the transducer. The transducer converts this amount o f acoustic
wave energy back to electrical signal and sends it to a high speed A/D converter, which
samples this signal and saves the result into memory. See fig 2-5.
electrical signal
A coustic w a v e
T est sample
6 M H z A/D converter
Fig 2-5, Pulse signal sampling
testing applications, the first pulse echo, just after the transducer sending out the source
pulse, should come with the biggest amplitude, the later echo pulse’s amplitude should
decrease potentially, that’s because the amount o f energy can be transferred from one
material to another material depends on the acoustic impendence o f the interface, low
impendence interface can transfer up to 50% o f its energy, high impendence material can
transfer as low as 1%, the more interfaces it goes , the less energy it passes through,
which means after certain amount o f time compare with the initial starting, the pulse echo
energy should be practically zero.
e c h o en ergy d e c r e a se f a s t l y P u i
Fig 2-6, Decrease o f pulse energy
2.3.1 Introduce to A-Scan signal
A sampled A-scan signal is a discrete ultrasonic wave echo signal, which is displayed in
time domain on one axis represents the time required for the return o f the echo and on the
other axis represents the strength or amplitude o f the echo. It is also called a TOF (time o f
flight) signal. To find out what kind o f A/D frequency converter should be used in order
to get an accurate A-Scan signal representation, we must first study the ultrasonic
velocity property in materials, because if it travel very fast, then a high speed A/D
converter is needed in order to sample enough data, if the velocity is relative low, then a
low frequency A/D converter may enough to do the sampling job. The velocity o f
ultrasonic wave transmitting in material depends on the material’s atomic structure, some