University of Windsor University of Windsor
Scholarship at UWindsor
Scholarship at UWindsor
Electronic Theses and Dissertations Theses, Dissertations, and Major Papers
1-1-2019
Industry 4.0 implementation strategy for Small Medium
Industry 4.0 implementation strategy for Small Medium
Enterprises
Enterprises
Hussein AbdulRahman
University of Windsor
Follow this and additional works at: https://scholar.uwindsor.ca/etd
Recommended Citation Recommended Citation
AbdulRahman, Hussein, "Industry 4.0 implementation strategy for Small Medium Enterprises" (2019). Electronic Theses and Dissertations. 8155.
https://scholar.uwindsor.ca/etd/8155
This online database contains the full-text of PhD dissertations and Masters’ theses of University of Windsor students from 1954 forward. These documents are made available for personal study and research purposes only, in accordance with the Canadian Copyright Act and the Creative Commons license—CC BY-NC-ND (Attribution, Non-Commercial, No Derivative Works). Under this license, works must always be attributed to the copyright holder (original author), cannot be used for any commercial purposes, and may not be altered. Any other use would require the permission of the copyright holder. Students may inquire about withdrawing their dissertation and/or thesis from this database. For additional inquiries, please contact the repository administrator via email
Industry 4.0 implementation strategy for Small Medium Enterprises
By
Hussein Abdul Rahman
A Thesis
Submitted to the Faculty of Graduate Studies through the Industrial Engineering Graduate Program in Partial Fulfillment of the Requirements for
the Degree of Master of Applied Science at the University of Windsor
Windsor, Ontario, Canada
2019
Industry 4.0 Implementation Strategy for Small Medium Enterprises
By
Hussein Abdul Rahman
APPROVED BY:
______________________________________________
A. Asfour
Department of Civil and Environmental Engineering
______________________________________________
W. ElMaraghy
Department of Mechanical, Automotive & Materials Engineering
______________________________________________
H. ElMaraghy, Advisor
Department of Mechanical, Automotive & Materials Engineering
iii
DECLARATION OF ORIGINALITY
I hereby certify that I am the sole author of this thesis and that no part of this
thesis has been published or submitted for publication.
I certify that, to the best of my knowledge, my thesis does not infringe upon
anyone’s copyright nor violate any proprietary rights and that any ideas, techniques,
quotations, or any other material from the work of other people included in my thesis,
published or otherwise, are fully acknowledged in accordance with the standard
referencing practices. Furthermore, to the extent that I have included copyrighted
material that surpasses the bounds of fair dealing within the meaning of the Canada
Copyright Act, I certify that I have obtained a written permission from the copyright
owner(s) to include such material(s) in my thesis and have included copies of such
copyright clearances to my appendix.
I declare that this is a true copy of my thesis, including any final revisions, as
approved by my thesis committee and the Graduate Studies office, and that this thesis
iv
ABSTRACT
An I4.0 implementation strategy is a tool that aids small and medium enterprises to meet the
fourth industrial revolution pre-requisites and standards. The main objective of the current
research that has been achieved, is that it established an industry 4.0 implementation strategy
for SMEs, that is capable of providing enterprises with the most effective road map to overcome
the obstacles faced by SMEs during transformation and accomplish the fourth industrial
revolution’s standards. A roadmap and the implementation strategy will be specifically tailored
to the participating enterprise, based on their assessment scores. The implementation strategy
requires four consecutive steps including Maturity Assessment, Influence Assessment, Roadmap
Construction, and Implementation.
An Industry 4.0 implementation strategy has been devised to increase the accuracy of assessing
SME’s technological maturity level by providing a weighting factor for relevant implementation
dimensions by using an Analytic hierarchy process (AHP). Weight factors were established to
identify dimensions that are most influential at small/medium manufacturing enterprises and
prioritize their transformation. A total maturity score of the enterprise as a whole valued
between 0-100 is determined at the end of the maturity assessment through utilizing radar
charts. This research includes a case study that was conducted at SPM Automation Inc. , a local
small-sized enterprise, where the proposed four-step implementation strategy was conducted
and succeeded to measure the current I4.0 maturity score which was 33%, and create an
implementation strategy that targets the most influential dimensions and prioritize their
v
DEDICATION
To
vi
ACKNOWLEDGEMENTS
I would love to express my great appreciation and gratitude to my supervisor Professor
Hoda ElMaraghy for her distinguished supervision and support, as well as for her continuous
guidance, and encouragement. This research would have lacked much of its quality,
professionalism, and completeness if it was not for her support. I would like to also thank
Professor Waguih ElMaraghy for the constructive feedback and support that he has always
offered during the course of this research.
In addition, special appreciation for chief of engineering, Mr. Boris Novakovic, and SPM
Automation Inc. for their great support, hospitality, and their approval of all the data, graphics,
and facility details that are mentioned in this work. I would love to as well acknowledge the
support I have obtained from my friends and colleagues at the Intelligent Manufacturing Systems
Center. Our discussions and brainstorming were a great source of inspiration and helped me
overcome many obstacles that faced me during the research process. Special thanks to Abdullah
vii
CONTENT
DECLARATION OF ORIGINALITY ... iii
ABSTRACT ... iv
DEDICATION ... v
ACKNOWLEDGEMENTS ... vi
Chapter 1: INTRODUCTION ... 1
1.1 Research Motivation ... 1
1.2 Statement of Engineering Problem ... 3
1.3 Research Thesis Hypothesis ... 4
1.4 Objective ... 4
1.5 Research Scope ... 5
1.6 Research Structure ... 5
Chapter 2: Literature Review ... 6
2.1 Maturity Models for Small Medium and Large Enterprises ... 6
2.2 Decision Support Tool ... 13
2.3 Difference Between Large and Small Manufacturing Enterprises Maturity Models and Adoption ... 14
2.3.1 Finance ... 16
2.3.2 Technology... 17
2.3.3 Specialized products ... 17
2.3.4 Standards ... 17
2.3.5 Organizational culture ... 17
2.3.6 Employee participation ... 18
2.3.7 Alliances and collaboration ... 18
2.4 Summary of literature and Research Gaps ... 18
Chapter 3: Readiness Assessment Model ... 20
3.1 Four-Step Implementation Strategy ... 20
3.1.1 Maturity assessment ... 20
3.1.2 Influence assessment ... 21
viii
3.1.4 Implementation ... 22
3.2 IDEF0 ... 22
3.3 Singapore Smart Industry Readiness Index ... 24
3.3.1 Singapore smart industry readiness index structure ... 24
3.3.2 Singapore smart industry readiness index criteria ... 25
3.4 Radar Chart ... 27
3.5 Analytic Hierarchy Process ... 27
Chapter 4: Application of I4.0 Four-step Implementation Strategy ... 29
4.1 Illustrative Case study ... 29
4.1.1 Maturity assessment ... 29
4.1.2 Influence assessment ... 30
4.1.3 Road map construction ... 34
4.1.4 Implementation ... 35
4.1.5 Conclusion ... 35
4.2 Case Study at SPM Automation Inc. ... 36
4.2.1 Assessment ... 36
4.2.2 Dimension’s influence assessment ... 54
4.2.3 Road map construction ... 58
4.2.4 Implementation ... 59
4.3 Considering Chonswat’s Maturity Model ... 61
4.4 Case Study Summary ... 62
Chapter 5: Conclusions ... 64
5.1 Conclusions ... 64
5.2 Recommended Future Work ... 65
References ... 66
Appendix A: Criteria of each of the 16 dimensions ... 69
1
Chapter 1: INTRODUCTION
1.1 Research Motivation
The word “revolution” denotes abrupt and radical change. Throughout history, revolutions have
occurred when new technologies and novel ways of perceiving the world trigger a profound
change in economic systems and social structures. The agrarian revolution, which is considered
the mother of all industrial revolutions, initiated the domino effect in the world of production by
establishing the transition from foraging to farming, which took place around 10,000 years ago
and was made possible by the domestication of animals. The utilization of animals in everyday
work improved production, transportation, and communication. The agrarian revolution resulted
in industrial revolutions that began in the second half of the 18th century, which remarkably
transitioned the industrial processes from muscle power to mechanical power, evolving to where
we are today with the fourth industrial revolution that introduced the cyber-physical world. The
first industrial revolution took place between 1760 and 1840 which was introduced by the
construction of railroads and the introduction of steam engines. Moving to the 20th century the
second industrial revolution was triggered by electricity and assembly lines. Later on, in the 1960s
the third industrial revolution was triggered by the deployment of the semiconductors,
mainframe computing, personal computing, and the internet. Today we are witnessing the
approach of the fourth industrial revolution which will introduce cyber-physical systems to the
industrial world (Schwab 2016).
Industry 4.0 (the fourth industrial revolution) is recently one of the main interesting topics in the
manufacturing industry. The new industrial revolution is transitioning from being just a
2 of industries have indeed adopted this manufacturing feature, while the majority of others are
thriving to do so (Schumacher, et al. 2016). Schumacher have discovered that only 1 percent of
German companies have reached the level of “expert”, which is level four out of five according
to their maturity scale (Schumacher, et al. 2016). None of the companies reached the level “top
performer” (level 5). Such results make it very important to create tools and methods to help the
enterprises to climb the ladder and achieve the newer industrial revolution’s features and
benefits. A very helpful tool to use towards such an objective is constructing an implementation
strategy that would help enterprises elevate their readiness level and achieve the fourth
industrial revolution’s standards. Other benefits that an implementation strategy can support
includes the measuring of enterprise’s readiness or maturity level to provide a better reading on
the current status of the enterprise and how far or close they are from achieving I4.0 standards.
It would also answer the questions of what is missing? What is the fastest roadmap towards
achieving the next maturity level? What are the most important factors?
Various existing maturity models that are concerned with the readiness of industry 4.0, but there
is a research gap regarding the implementation strategies of Industry 4.0 concepts for small and
medium-sized enterprises (SMEs) (Bär, et al. 2018). Enterprises need to have a plan or a roadmap
that provides detailed steps of how enterprises could approach maturity models, and what steps
should be considered before and after the assessment.
In this work, a four-step implementation strategy is established to help guide SMEs during their
I4.0 transformation process. The strategy includes features such as 1) the introduction of the
Analytical Hierarchy Process (AHP) to aid with decision making, and 2) radar chart plotting to
3 implementation strategy with the aid of AHP will help SMEs concentrate on the 16 considered
dimensions, listed in Fig 2, with the highest Benefit-cost ratio (BCR). Directing investments to the
dimensions with the highest Benefit-cost ratio is essential for SMEs, due to the capital constraints
most SMEs face during their transformation (Mittal, et al. 2018).
This research addresses the differences between SMEs and larger enterprises and finds a
maturity model that acquires these differences. This is achieved by examining some scholarly
publications that focus mainly on industry 4.0 maturity models, which are related in terms of
application to this thesis research and creating an adjustable weighing system that provides a
weighing scheme to allow enterprises to tailor the maturity models to fit their business needs
and capabilities. AHP is a very good candidate for making this possible when implemented in the
weighing factor selection process, since it would provide an accurate weighing factor for each
dimension of the maturity model, based on the enterprise’s preferences, and capabilities since it
has proven to be a very effective tool in the field of decision making (Saaty 2001).
1.2 Statement of Engineering Problem
During the transformation process from a regular factory to a smart factory (I4.0), small and
medium enterprises face the limited funding barrier. With limited funding, small and medium
enterprises find it very difficult to invest capital to transform in all of their enterprise’s dimensions
at once. Besides, some enterprises yet require more knowledge about I4.0 and how they could
4
1.3 Research Thesis Hypothesis
The research thesis statement of this research could be formulated as the following:
An Industry 4.0 implementation strategy that could provide a roadmap for SMEs to aid their
transformation towards becoming a smart factory and overcome their limited funding barriers
through prioritizing various dimensions of the enterprise to be transformed over other, could be
achieved through utilizing benefit cost ratio, AHP, and an I4.0 maturity model.
1.4 Objective
In this work an I4.0 implementation strategy is proposed that will help SMEs, mostly in the
automotive sector, to adopt I4.0 by establishing a roadmap that will aid SMEs throughout their
transformation process towards becoming a smart factory. The proposed methodology is a
four-step process as displayed in Fig 1.1, which utilizes Benefit-cost ratio, Singapore Smart Industry
Readiness Index (SSIRI), and AHP to establish an I4.0 transformation roadmap that will help SMEs
overcome the financial barriers that are faced when transformation is considered. This is possible
through focusing and directing their funding and efforts towards the most influential elements
at their enterprise.
Figure 1.1 I4.0 Four-step implementation strategy for small medium enterprises Maturity
Assessment
Influence Assessment
Roadmap
5
1.5 Research Scope
The scope of this research and the boundary of the work are outlined as follow:
• This research is limited to small-medium enterprises particularly in the automotive field
• Product assembly
• Type of operation: Hybrid automated and manual assembly
1.6 Research Structure
This research is presented in 5 chapters, including the introduction chapter. Chapter 2
summarizes the available research literature on several topics related to this work such as a
review over the current maturity models available for both small-medium and multinational
enterprises, followed by a review of various applications of AHP in various fields, and finally a
review of the current I4.0 implementation strategies available.
Chapter 3 will provide an in-depth detailed explanation of the proposed i4.0 implementation
strategy. Chapter 4 displays the case study process, results, and discussion that was conducted
on a local medium-sized enterprise (SPM Automation Inc.). Finally, Chapter 5 provides a
6
Chapter 2: Literature Review
The literature review consists of three sections. Section 1 is a review of the current maturity
models available for both small medium enterprises (SMEs) and multinational enterprises
(MNEs). Section 2 is a review of various applications of AHP in various fields. Section 3 reviews
the current I4.0 implementation strategies and finally, section 4 includes the summary of the
literature review.
2.1 Maturity Models for Small Medium and Large Enterprises
A maturity model is a tool that helps people assess the current effectiveness of a person or group.
I4.0 maturity models aid with assessing the Industry’s maturity or readiness towards obtaining
the fourth industrial revolution’s standards and features. Recent I4.0 maturity models mostly
consider Multinational enterprises (MNEs), on the other hand, SMEs do not receive equal
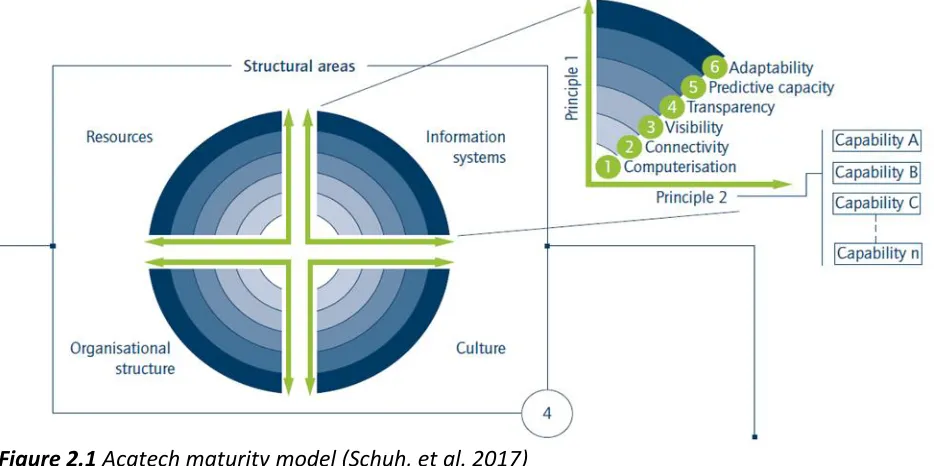
attention (Mittal, et al. 2018). Acatech (Schuh, et al. 2017) Fig 2.1 have developed a maturity
7 model that focuses on four main pillars which includes resources, organizational structure,
information systems, and culture. Their research consists of 600 questions that determine the
level of maturity of each sub-dimension on a scale of 6 maturity levels including computerization,
connectivity, visibility, transparency, predictive capacity, and adaptability. Acatech’s approach
did a great job covering all the major components of I4.0 and presenting a visual representation
of the maturity level of each component, but it lacked the ability to provide an aggregated value
of a final maturity score, and a weight factor to differentiate between the importance of each
pillar.
Schumacher (Schumacher, et al. 2016) introduced a maturity model that consists of 9
sub-dimensions including strategy, leadership, customer, products, operations, culture, people,
governance, and technology that assessed each enterprise over 5 maturity levels. The model
includes a weighing factor established based on E-mail based distribution of 123 questionnaires
to practitioners and researchers which resulted in 23 responses. The practical importance of each
maturity item was rated on a Likert-scale (Schumacher, et al. 2016), ranging from “not important”
(rating = 1) to “very important” (rating = 4). Schumacher included a weighing factor, but the
values represented personal/subjective opinions which may contradict other enterprise’s
priorities based on their knowledge of their enterprises. Bibby (Bibby and Dehe 2018) Introduced
a maturity model that emphasized three main pillars: factory of the future, people and culture,
and strategy. It also involved a weight factor where the weight of each pillar is set according to
the number of items present in each. The maturity levels ranged from 1 to 4 representing
minimal, developed, defined, and excellent respectively. Basing the importance of the pillars on
8 number of items but with great importance. Leyh (Leyh, et al. 2016), developed a maturity model
(SIMMI 4.0) that considered four pillars including Vertical Integration, Horizontal Integration,
Digital Product Development, and Cross-sectional technology criteria, and five maturity levels
including Basic digitization level, cross-departmental digitization, horizontal and vertical
digitization, full digitization, and optimized full digitization. The scoring process consists of a set
of questions concerning each sub-dimension and a score is determined based on the answers.
Each sub-dimension score is the sum of every question score divided by the total number of
questions. The total maturity level will be the addition of all sub-dimensions divided by 4. Leyh’s
approach does not use a weight factor or a graphical representation of the maturity level of each
pillar. Lichtblau (Lichtblau, et al. 2015) proposed a maturity model that focuses on seven pillars
Including employees, strategy and organization, smart factory, smart operations, smart products,
data-driven, and services and six levels of maturity which includes outsider, beginner,
9 intermediate, experienced, expert, and top performer. The scoring process is based on a set of
criteria that the enterprise meets. Singapore smart industry readiness Index (SSIRI) (Board 2018)
is illustrated in Fig 2.2.
It considers three main pillars (Technology, Process, and Organization) and eight sub-dimensions
(operations, supply chain, product Lifecycle, automat, connectivity, intelligence, talent readiness,
and structure & management). The SSIRI established six maturity levels ranging from 0-5
representing Undefined, defined, digital, integrated, automated, and intelligent respectively. The
scoring is based on a readily available criterion and the enterprise is assessed only based on what
criteria it meets. SSIRI is of great interest since It covers all the essential pillars that makeup I4.0
and provides detailed criteria on a scale of 0 to 5 which is very beneficial for assessing SMEs. The
S.S.I.R.I smart industry readiness index does not include a weight factor to differentiate the
importance and the magnitude of impact of each pillar relative to the other pillars.
Even though it is not sufficient, in the means of attention and number of researches that SMEs
demand, SMEs have their share with maturity models developed in their favor.
10 Hamidi’s (Hamidi, et al. 2018) maturity model consists of six dimensions Including Employment,
Data-driven services, smart product, smart operations, smart factory, strategy and organization.
The survey questionnaires are designed based on quantitative data collection and were adopted
from previous research based on the IMPULS maturity model (Lichtblau, et al. 2015). Ganzarain
and Errasti (Ganzarain and Errasti 2016) Proposed a process model as a guiding framework for
Industry 4.0 through three main stages (Fig 2.3): diversification vision, strategy and action
building.
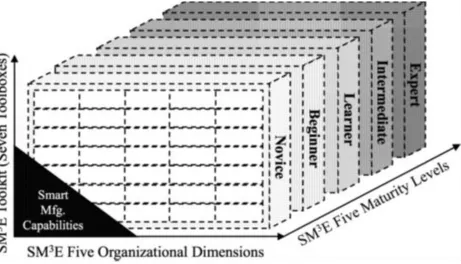
SM3E (Mittal, et al. 2018) has approached SMEs by concentrating on five pillars which they
proposed to be ‘‘essential for SMEs’’. The pillars included are finance, people, strategy, process,
and product. Each of these pillars is measured on a 5 leveled scale from 1 to 5 representing
Figure 2.4 Small medium Enterprises 3D (𝑆𝑀3𝐸) three-dimensional figure for maturity
11 novice, beginner, learner, intermediate, and expert respectively. SM3E has introduced a
three-dimensional (Fig 2.4) with three-axis which includes toolboxes, organizational dimension and
maturity levels. SM3E has introduced a very basic level to Include the majority of SMEs that lag
behind in many fields compared to large enterprises, such fields include technology, connectivity,
and organizational complexity. SM3E still misses a numerical value of maturity and a weight
factor, which affects the accuracy of the assessment. Chonsawat (Chonsawat and Sopadang
2019) has created an I4.0 assessment method that included 5 Dimension, which to his standards
the main important dimensions are manufacturing and operations, people capability, technology
driven process, digital support and the Least important is Business and Organization Strategy and
included 43 Sub-Dimension. His approach also included a graphical representation and a weight
factor. Chonsawat’s approach introduces a scale ranging from 0 to 5, a scale with smaller
increments such as 0-100, would display a better accuracy in the assessment results. In addition,
it is only limited to assessing and not providing information on how SMEs can progress and
12
Table 2.1 Literature review summary
Source Year Main Pillars Use of Weights or Aggregated values SME and/or MNE oriented
Schuh, Anderl et al. 2017
Acatech Technology Organization Culture None MNE Schumacher 2016 Strategy leadership customer products operations culture people governance Technology Both MNE
Bibby and Dehe 2018
factory of the future peopleand culture
strategy
Weight Factor MNE
Leyh, Bley et al. 2016
SIMMI 4.0 Vertical Integration Horizontal Integration Digital Product Development Cross-sectional technology
None MNE
(Lichtblau, Stich et al. 2015
Employees Strategy and organization
Smart factory Smart operations Smart products Data-driven Services None MNE Board 2018
SSIRI Technology Process Organization
None SME and MNE
Hamidi, Aziz et al. 2018
Employment Data driven services
smart product smart operations smart factory strategy organization None MNE
Ganzarain and Errasti 2016
Diversification vision Strategy Action building
None MNE
Mittal, Romero et al. 2018
SM3E Finance People Strategy Process Product None SME Chonsawat 2019
Manufacturing and Operations People Capability Technology Driven Process
Digital Support Business and Organization
13
2.2 Decision Support Tool
The analytic hierarchy process (AHP) is a structured technique for organizing and analyzing
complex decisions, based on mathematics and psychology. It is used to support decision making
when multiple criteria are involved. The AHP methodology is a flexible tool that can be applied
to any hierarchy of performance measures (Rangone 1996). According to (Chou and Liang 2001),
most of the multiple criteria decision-making (MCDM) approaches consist of two steps: (1)
Aggregation of the judgments with respect to all goals and decision-making alternatives; and (2)
Ranking of the decision alternatives according to the aggregated judgements (scores). (Vreeker,
et al. 2002) Suggests that the basic rules for solving multi-level hierarchical problems involve
essentially four steps: (1) specification of choice problem; (2) information analysis; (3) choosing
the appropriate method; and (4) evaluation of alternatives.
The success of the AHP in research in several areas supports its use to solve decision-making
problems, for example in (Vreeker, et al. 2002), (Lirn, et al. 2004), (Chang and Yeh 2001), (Chang
and Yeh 2001), (Tzeng 1994) and (Frankel 1992). Lirn used the AHP to study job attractiveness in
the airline industry in Taiwan. (Yedla and Shrestha 2003) utilized the AHP to select
environmentally friendly transport systems in India. (Chou and Liang 2001) used the AHP to
create a model capable of evaluating the performance of shipping companies. (Lirn, et al. 2004)
applied AHP methodology to reveal preferences regarding transshipment port selection. As
argued by (Forgionne, et al. 2002) the AHP methodology as a decision support system mechanism
can easily accommodate model modifications and simulations through sensitivity analysis, since
the main objective of four-step implementation methodology established in this work is to make
14 support this process. Chapter 4 will include a detailed explanation of the AHP mathematical
process and all the details on how it works through treating data collected during the case study
process.
2.3 Difference Between Large and Small Manufacturing Enterprises Maturity
Models and Adoption
According to the European Commission (EC,2018), SMEs may be defined as the enterprises which
employ less than 250 employees and have an annual turnover not exceeding EUR 50 million,
and/or an annual balance sheet total not exceeding EUR 43 million. When small-medium
enterprises are compared to multinational enterprises, at the first glance they seem to be with
no significant impact on the fourth industrial revolution, but SMEs are the driving force of many
manufacturing economies (Schumacher, et al. 2016). As the backbone of the manufacturing
industry, SME’s impact on the Fourth Industrial Revolution is significant (Schiersch 2013). SMEs
often face different challenges and barriers than larger enterprises when it comes to i4.0
transformation (Wuest, et al. 2014), (Wadhwa 2012). Schröder (Schröder, 2016) emphasized that
the biggest challenges that small and medium-sized enterprises have to meet in this context are
the development of an appropriate strategy, a cost–benefit analysis of the relevant technologies
and lack of data security and uniform standards.
The current literature considers and debates numerous opportunities and challenges faced by
SMEs. Wuest (Wuest, et al. 2014) highlighted the influence of information management in
manufacturing SMEs. On the other hand, Dyerson (Dyerson, et al. 2016) performed an empirical
analysis of 117 small manufacturing firms in the UK and clustered them based on their degree of
15 from 632 SMEs and met the conclusion that SMEs are to be distant when the deployment of
Advanced Manufacturing Technologies (AMTs) is considered. Terziovski (Terziovski 2010) studied
600 Australian manufacturing SMEs and discovered that SMEs suffer from a shortage of
innovation culture and strategy to succeed. Kumar(Kumar, et al. 2014) compared the numerous
quality management practices in the United Kingdom and Australian manufacturing SMEs and
discovered that leadership, fact-based decision-making, networking with government bodies and
academic institutions, as well as an ISO 9000 certification are critical success factors for SMEs. In
2017 Müller and Voigt (Müller and Voigt 2017) conducted interviews with CEOs, managers, and
manufacturing consultants to discover the influence of knowledge management in Indian
manufacturing SMEs.
In Mittal’s work (Mittal, et al. 2018) it was concluded that global awareness on manufacturing,
regular interaction between the employees, attending workshops or conferences abroad, as well
as industry-academia interaction, are critical activities that promote knowledge creation. Müller
and Voigt (Müller and Voigt 2017) proposed the design interaction strategies for the introduction
of Industry 4.0 in German SMEs and interviewed 68 specialists including 41 CEOs in firms dealing
in mechanical and plant engineering, electrical engineering and automotive suppliers, and
determined that standardization, personnel resources, financial resources, and a belief on
digitization are distinctive constraints for SMEs.
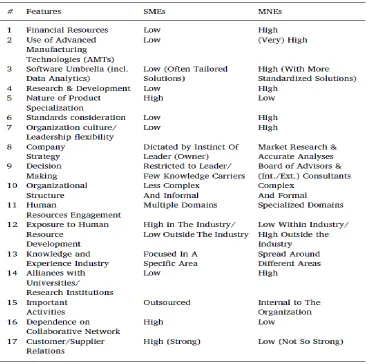
In 2018 Mittal (Mittal, et al. 2018) has reviewed the previous literature and constructed (Table
2.2) which depicts particular SME features, stresses on the differences between the standpoints
16 Mittal also grouped the various similar SME requirements into eight clusters (finance, technical
resource availability, product specialization, standards, organizational culture, employee
participation, alliances and collaboration). All the following subsections (a-g) are influenced by
research works by (Mittal, et al. 2018) (Schiersch, 2013) (Wuest, et al. 2014) (Wadhwa, 2012)
(Dyerson, et al. 2016) (Kennedy 2003) ( Müller 2017).
2.3.1 Finance
SMEs face capital constraints compared to MNEs such as lack of collaterals, the informational
asymmetries between small businesses and investors, etc. which is due to the fact that SMEs are
17 often owned by and individual and various risk factors are involved with the small-scale
businesses.
2.3.2 Technology
Due to the financial constraints, SMEs find it more challenging to upgrade and adopt Advanced
Manufacturing Technologies (AMTs) in addition they do not have the technical resources readily
available. These facts cause a further impact by being the reason behind SMEs low performance
towards research and development. SMEs in comparison with MNEs show a lack of IT integration,
limiting the software and the technology used to preserve the SME record to only be tailored
towards resolving a specific issue faced by SMEs.
2.3.3 Specialized products
Due to the lack of funding and technical resources mentioned in section 3a, and 3b SMEs have
an overload of work and responsibilities which leads to highly specialized products that
encourage SMEs to stand out compared to their competitors.
2.3.4 Standards
MNEs tend to strictly obey standards such as ISO, but on the other hand, SMEs that do the same
are very rare. This is due to the lack of essential resources required to prepare and achieve
certification; therefore, SMEs have to be motivated to adopt industrial standards.
2.3.5 Organizational culture
Organizational behavior is a critical aspect of an enterprise. When SMEs are compared with MNEs
in organizational culture domain SMEs display a lower level of complexity and stand out to be
informal. In addition, SMEs organizational structure is often not flexible enough to experiment
and consider implementation initiatives for cutting-edge technologies which leads SMEs to be
18 SME’s decisions are not as informed and are mostly based on a ‘gut feeling’. Gut feeling is
considered to be accompanied with high levels of uncertainty, compared with the MNEs
approach which is based on market research and accurate analyses that are discussed by a board
of consultants.
2.3.6 Employee participation
Employees in SMEs and MNEs receive different exposures and opportunities in their working
field. While MNEs get the opportunity to be more specialized and thus considered experts, SME’s
employees are refrained from that subject due to various responsibilities that lay on their
shoulders, making it less likely to develop high levels of expertise in a particular field. SMEs
employees often lack the opportunity to attend workshops, supervised industrial training, and
mentors resulting in a lack of employee participation.
2.3.7 Alliances and collaboration
The collaboration strategies are considered essential for the success of an enterprise. However,
SMEs show a low level of alliance with research institutes and universities, depending on learning
from their personal experience due to their shortage of access to shared knowledge. SMEs often
focus their knowledge on specific domains, while MNEs expand their knowledge in various areas,
causing SMEs to outsource various important activities. Adding the fact that SMEs have fewer
products to manage, resulting in weaker collaborative networks.
2.4 Summary of literature and Research Gaps
The literature review conducted has considered the most recent ten I4.0 maturity models and
four implementation strategies. Recent maturity models display a lack of consideration to
compare the importance of each dimension compared to the other. Enterprises are part of the
19 importance or priority of each dimension compared to the other based on the benefit-cost ratio,
aiding in managing investments, and funding, that are directed towards the transformation
process. Recent I4.0 maturity models display lack of attention towards SMEs as seen in table 2.2.
The main objective of this research is to create an implementation strategy that will obtain all
the criteria mentioned in table 2.2 and fill the gap. Filling the gap would require an
implementation strategy that is capable of providing an aggregated value of the maturity score,
a weight factor to display the magnitude of influence of each dimension, and capable of
considering both SMEs and MNEs. Singapore smart industry readiness index has been chosen
since it provides a detailed 6-level criteria (0-5) using which enterprises can assess their I4.0
maturity with high accuracy, and it includes level 0 which is a very basic level of maturity that
many SMEs can relate to. Singapore smart industry readiness index has also been proven to be
successful since it has been implemented in more than 300 enterprises. Such characteristics
made the Singapore smart industry readiness index the best candidate to be considered in this
research.
Chapter 3 will further explain in detail the Singapore smart industry readiness index mentioned
in the literature review since it will be the assessment tool to be used in the four-step
20
Chapter 3: Readiness Assessment Model
3.1 Four-Step Implementation Strategy
3.1.1 Maturity assessment
Maturity assessment is the first and most important step in the implementation strategy. During
maturity assessment, the enterprise's current I4.0 maturity level is measured. This process
includes the application of the Singapore smart industry readiness index. After dissecting the
differences between SMEs and MNEs requirements, it was possible to pick a maturity model that
would be utilized in the implementation strategy. Singapore Smart Industry Readiness Index
(SSIR) (Board, 2018), has been chosen to be the maturity model that will be used through the
maturity assessment process. The (SSIR) has been chosen to be the best fit candidate since it
provides room to accept SMEs basic requirements by including maturity level zero, which is a
very basic stage of maturity. Such consideration will allow the majority of SMEs with basic
maturity levels to participate in the assessment and eventually the implementation process as
well. In addition (SSIR) has readily available criteria for each maturity level which allows it to be
numerical quantitative score based, which means it is capable of adopting a weight factor. Maturity
Assessment
Influence Assessment
Roadmap
Construction Implementation
21 During the application, every dimension of the 16 dimensions listed in the Singapore index will
be measured and assessed, to measure its maturity level. The assessment process will be
conducted by comparing each maturity level's criteria to the criteria existing at the enterprise.
There are six levels ranging from 1-5. After all dimensions are assessed, a radar chart will be
constructed based on the results obtained. The radar chart will provide a visual of the assessment
results to easily compare all the 16 dimensions at once. Radar charts will provide a total maturity
score by calculating the shaded mature area of the graph and dividing it by the total area.
3.1.2 Influence assessment
The influence assessment's main objective is to establish the influence of each of the 16
dimensions on the enterprise. The influence of each dimension is measured based on the return
on investment each dimension will bring back, after its transformation. This is calculated by
obtaining the benefit-cost ratio of each dimension. Next, the benefit-cost ratios of all the
dimensions will be plugged in the analytic hierarchy process (AHP). AHP will compare each of the
benefit-cost ratios of each dimension with the other dimensions resulting with a weight value for
each dimension. The weight value will represent the importance of each dimension and this will
determine its priority to be transformed over the other.
𝐵𝑒𝑛𝑖𝑓𝑖𝑡 𝐶𝑜𝑠𝑡 𝑅𝑎𝑡𝑖𝑜 =𝑒𝑠𝑡𝑖𝑚𝑎𝑡𝑒𝑑 𝑏𝑒𝑛𝑒𝑓𝑖𝑡𝑠 𝑒𝑠𝑡𝑖𝑚𝑎𝑡𝑒𝑑 𝑐𝑜𝑠𝑡
3.1.3 Road map construction
A road map, in general meaning, is a plan intended to achieve a particular goal while a strategy
is considered a plan of action or policy designed to achieve a major or overall aim. In this research,
road map expression is with respect to the dimensions that will be prioritized for transformation
22 prioritizing process has a protocolTable 4.30. Firstly, dimensions with the highest weight factor
will be chosen to be transformed first. If two dimensions have equal weight factors, the one with
the lower maturity level will be prioritized. At the end of this step, a roadmap will be established
with a bundle of most influential dimensions, and their order of transformation.
3.1.4 Implementation
Implementation is the fourth and last step, at this stage, the criteria of the listed dimensions in
the roadmap will be listed. The implementation process includes 3 steps (Fig 3.2). The first step
in the implementation process is to Fig out the next maturity level to be met and the criteria of
that maturity level. Second step is to plan, during planning the implementation of the chosen
dimension, the enterprise will assess the feasibility, integration, and training for their employees,
to make it easier to adapt to the changes the enterprise will go through. At the end of this stage,
the enterprise will have options for business plans for how they would achieve the next maturity
level. The third step is to pilot the best business plan.
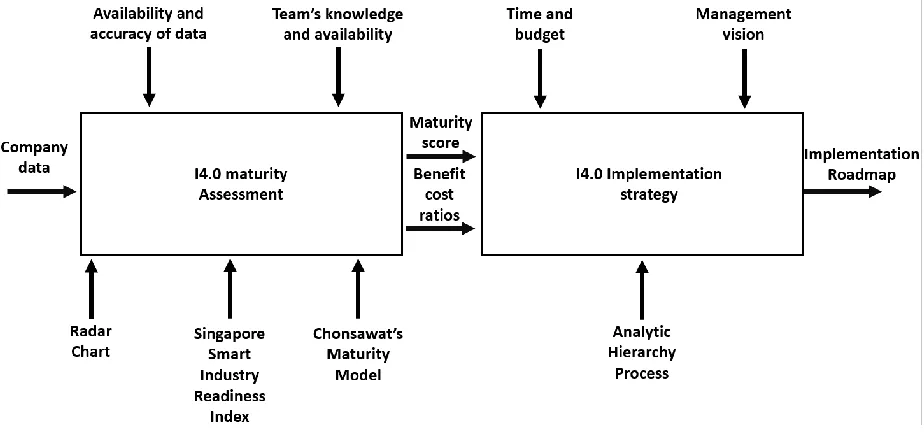
3.2 IDEF0
As displayed in Fig 3.3 the IDEF0 of the four-step implementation strategy consists of two main
processes, the first is the I4.0 maturity assessment. In this process, the input is the company data
that will be provided after the maturity assessment is over. Since the assessment process is
Criteria
Plan
Pilot
23 conducted through the deployment of both the Singapore smart readiness index and Chonswat's
maturity model they are both considered mechanisms. The radar chart is the third mechanism
since it will aid in providing a total maturity score. The availability of data and its accuracy are
limiting factors of the assessment process since they are not always available due to the team's
knowledge and availability, which is the second limiting factor. The output achieved from this
process will be the current maturity score and the benefit-cost ratio of each dimension.
The second process is the implementation strategy, during this process, the maturity score and
the benefit-cost ratios achieved in the previous process will be the input from which AHP will
create a weight factor for each dimension and aid in the selection process of the most influential
dimensions. In the second process time and budget and the limiting factors as well as
management vision. since if time and budget will limit the accuracy of the roadmap construction
and if the management vision to how much they are ready to transform is short it will limit the
roadmap to shorter goals. The output of this process will be an i4.0 implementation roadmap.
24
3.3 Singapore Smart Industry Readiness Index
Singapore Smart Industry Readiness Index (SSIRI), is an I4.0 readiness assessing model that has
been created in partnership with global testing, inspection, certification, and training company
TÜV SÜD and validated by an advisory panel of industry and academic experts (Board,2018). The
Index is comprised of three layers. The topmost layer is made up of the 3 fundamental building
blocks of Industry 4.0: Process, Technology, and Organization. Underpinning these 3 building
blocks are 8 pillars of focus. The 8 pillars then map onto 16 dimensions of assessment, which
companies can use to evaluate their facilities (Board, 2018).
3.3.1 Singapore smart industry readiness index structure
The assessment model (SSIRI) consists of 3 building blocks, 8 pillars 16 dimensions (Fig 3.4). First
is process building block which includes vertical integration, supply chain, and product lifecycle
pillars and under these pillars lies vertical integration, horizontal integration, and integrated
product lifecycle respectively. Second is technology building block, which includes automation,
connectivity, and intelligence pillars in each shop floor, enterprise and facility level, summing up
to 3 dimensions of each totaling 9 dimensions under technology building block. The third building
block is the Organization, it includes 4 dimensions and 2 pillars. The pillars under Organization
25 dimensions and second pillar are management which includes both inter, and intra collaborations
and strategy dimension and governance dimension.
3.3.2 Singapore smart industry readiness index criteria
Each of the 16 dimensions listed in Fig 3.3 has a unique list of criteria to aid the assessment
process. For each dimension there are 6 maturity levels and 6 criteria (one for each maturity
level). According to how much of the criteria the enterprise can meet, will eventually determine
the maturity level of the enterprise in that particular dimension. Fig 3.5 displays the criteria for
technology building block, automation pillar, shop floor dimension.
26
27
3.4 Radar Chart
The radar chart is plotted at the end of the assessment to provide a visual representation of the
maturity level for all dimensions. A visual representation will make it easier to spot the weak
points or where the enterprise has the lowest maturity level and what dimensions need
attention. Radar charts make it easier to compare the maturity levels of all dimensions at a
glance. Last but not least by calculating the area of maturity plot and dividing the value by the
total area of the plot chart we are capable to calculate the total maturity scores the enterprise is
currently standing at. The final maturity score is calculated as follows:
𝑻𝒐𝒕𝒂𝒍 𝒎𝒂𝒕𝒖𝒓𝒊𝒕𝒚 𝒔𝒄𝒐𝒓𝒆 =𝑻𝒐𝒕𝒂𝒍 𝒔𝒉𝒂𝒅𝒆𝒅 𝒂𝒓𝒆𝒂 𝑻𝒐𝒕𝒂𝒍 𝒂𝒓𝒆𝒂 𝑥100
𝑻𝒐𝒕𝒂𝒍 𝒔𝒉𝒂𝒅𝒆𝒅 𝒂𝒓𝒆𝒂 =𝟏 𝟐[[(𝑪𝟏 𝑿 𝑪𝟏𝟔) + ∑ (𝑪𝒊 𝑿 𝑪𝒊+𝟏)] 𝒊=𝟏𝟓 𝒊=𝟏 ] 𝐬𝐢𝐧 (𝟑𝟔𝟎 𝟏𝟔) 𝑻𝒐𝒕𝒂𝒍 𝒂𝒓𝒆𝒂 = ∑𝟓 𝟐 × 𝒔𝒊𝒏𝟑𝟔𝟎 𝒏 𝟐 𝒏 𝒊=𝟏
Where 𝐶𝑖 is the maturity score of the dimension, while n is the number of dimensions considered.
The discussed assessment model and radar chart will be further explained in chapter 4, as they
will be implemented and used to display assessment results from data collected during a case
study conducted on SPM Automation Inc. facility.
3.5 Analytic Hierarchy Process
The analytic hierarchy process (AHP) is a structured technique for organizing and analyzing
complex decisions, based on mathematics and psychology (Rangone 1996). Since the
28 has proven to provide the best decisions when multiple criteria are listed, from multiple
categories, by providing a bundle of best options to be considered under each category (Chou
and Liang 2001). Such results are achieved by comparing the cost and benefit of each choice with
all the other listed choices. In this research, our choices are the dimensions of the enterprise, and
AHP will aid in selecting the most influential dimensions to prioritize for transformation. Chapter
29
Chapter 4: Application of I4.0 Four-step Implementation Strategy
This chapter will demonstrate the application of the four-step 1.40 implementation strategy,
using real industry case study.
4.1 Illustrative Case study
For the purpose of testing and further explaining the proposed implementation strategy, the
following hypothetical case study is conducted using XYZ which is an SME in the automotive
sector.
4.1.1 Maturity assessment
Table 4.1 displays the hypothetical data concerning the results of the I4.0 maturity assessment
process conducted on XYZ.
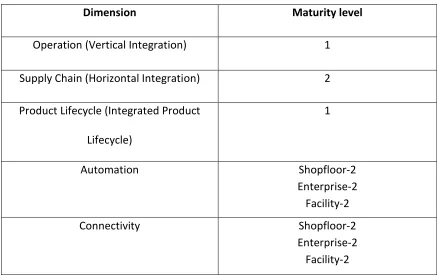
Table 4.1 I4.0 Maturity Assessment results
Dimension Maturity level
Operation (Vertical Integration) 1
Supply Chain (Horizontal Integration) 2
Product Lifecycle (Integrated Product
Lifecycle)
1
Automation Shopfloor-2
Enterprise-2 Facility-2
Connectivity Shopfloor-2
30
Intelligence Shopfloor-1
Enterprise-2 Facility-1
Talent Readiness Workforce learning and development- 2 Leadership competency- 3
Structure and management Inter and intra company collaboration- 3 Strategy and governance- 3
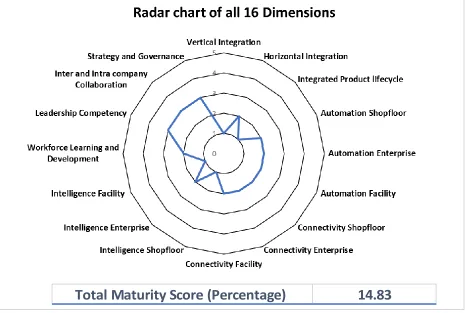
Constructing a radar chart from the maturity assessment results displayed in table 4.1, it was possible to conclude that the total maturity score at XYZ is 14.83 %
4.1.2 Influence assessment
Next, the benefit cost ratio will be concluded for each dimension of the S.S.I.R.I. This process will
help determine the influence of each department on the enterprise as a whole. After multiple Figure 4.1 Radar chart of all 16 dimensions at XYZ facility
31 meetings with officials from various departments of the assembly plant of XYZ, it was possible to
gather the following data Table 4.2. The following data is the Benefit cost ratio of each of the
dimensions mentioned in Singapore smart industry readiness index.
Table 4.2 Benefit cost ratio of each dimension
Dimension Benefit cost ratio
Vertical Integration 6.5
Horizontal Integration 7.1
Integrated Product Lifecycle 5.2
Automation Shop floor 7.2
Automation Enterprise 6.6
Automation Facility 6.1
Connectivity Shop floor 8.2
Connectivity Enterprise 6.3
Connectivity Facility 6
Intelligence Shop floor 7.4
Intelligence Enterprise 6.3
Intelligence Facility 5.8
32
Leadership Competency 5.8
Inter- and Intra- Company Collaboration 6.3
Strategy & Governance 6.8
A comparative calculation of the collected data
will be conducted to convert the data to a form
that is compatible with AHP. The following is an
example of comparative calculation of two
dimensions that share the same category in
Singapore smart industry readiness index:
As seen in figure 4.2, operation, supply chain, and
product lifecycle are under the process category.
Comparative calculation:
Vertical integration to horizontal integration = 𝐵.𝐶 𝑜𝑓 𝑉.𝐼𝑛𝑡𝑒𝑔 𝐵.𝐶 𝑜𝑓 𝐻.𝐼𝑛𝑡𝑒𝑔=
6.5
7.1 = 0.91
Vertical integration to Integrated product lifecycle = 𝐵.𝐶 𝑜𝑓 𝑉.𝐼𝑛𝑡𝑒𝑔 𝐵.𝐶 𝑜𝑓 𝑃𝑟𝑜𝑑𝑢𝑐𝑡 𝑙𝑖𝑓𝑒𝑐𝑦𝑐𝑙𝑒=
6.5
5.2= 1.25
Horizontal integration to product lifecycle = 𝐵.𝐶 𝑜𝑓 𝐻.𝐼𝑛𝑡𝑒𝑔 𝐵.𝐶 𝑜𝑓 𝑃𝑟𝑜𝑑𝑢𝑐𝑡 𝑙𝑖𝑓𝑒𝑐𝑦𝑐𝑙=
7.1
5.2= 1.36
Plugging in the calculated values in AHP calculator Fig 4.3, a weigh value for each dimension is
generated.
33
Figure 4.3 AHP calculations results
Process pillar weight value (%)
Operation 35
Supply chain 38 Product lifecycle 28
Automation pillar weight value (%) shop floor 36
enterprise 33
facility 31
Connectivity pillar weight value (%)
shop floor 40
enterprise 31
facility 29
Intelligence pillar weight value (%)
shop floor 32
enterprise 38
facility 30
Organization pillar weight value (%)
Leadership competency 54
Strategy &Governance 52 Work force learning
Inter- and Intra-
company collaboration 48 46
34
4.1.3 Road map construction
At this stage, priorities to which dimension to be selected will be based on the prioritizing
protocol displayed in Table 4.4.
Table 4.4 Prioritizing protocol
Scenarios Prioritizing action
Different weights Highest weight value
Identical weights different maturity level Lowest maturity leveled dimension is
prioritized
Identical weights and maturity levels Free selection of either
Looking at the results from AHP and linking each weight factor with its corresponding dimension,
it is very clear that supply chain, connectivity-shop floor, and leadership competency are the most
influential dimensions within the process, technology, and organization pillars respectively.
Hence, they will be prioritized for transformation and the transformation plan will be as shown
in Fig 4.4.
Figure 4.4 transformation road map for all three building blocks at XYZ facility
supply chain
Connectivity
(Shopfloor)
35
4.1.4 Implementation
At this stage, all the readily available criteria that belong to each of the selected dimensions will
be considered and implement transformation. A roadmap that holds a bundle of most influential
dimensions accompanied by their respective criteria Fig 4.5 will be supplied to XYZ, which will be
a very useful tool to help achieve the next maturity level in each dimension.
4.1.5 Conclusion
After the maturity level and influence magnitude of each dimension at XYZ has been assessed,
an implementation strategy was constructed, and it states that for XYZ to improve their total
maturity score which at the moment is standing at 14.83%. They should firstly establish a digitized
supply chain processes and systems that are securely integrated. Second, they need to Establish
an Interoperable production assets and systems that are secure. Third, is to develop
management that is able to, with relative independence, develop initiatives. Doing so, they would
have transformed the most influential dimensions at their facility. The implementation strategy •Establish a digitized supply chain processes and
systems that are securely integrated across business partners and clients along the value chain.
supply chain
•Establish an Interoperable production assets and systems that are secure.
Connectivity
(Shopfloor)
•Management should be able to, with relative
independence, develop initiatives that leverage on the latest trends and technology to improve more than one area of the organization
leadership
competency
36 that has been concluded at the end of the illustrative example, is specifically customized for XYZ.
In Chapter 4.2 the same four step implementation strategy is be used but the result and
recommended roadmap are totally different which demonstrates the sensitivity of the developed
assessment process and its impact on the finals results.
4.2 Case Study at SPM Automation Inc.
A case study is arranged with S.P.M Automation in Windsor, Ontario. SPM Automation Inc. is an
SME that provides automatic solutions for various challenging plastics joining, finishing, and
assembly applications. SPM Automation Inc. currently hires 50 employees, 11 of which
mechanical engineers, 8 programmers, and the rest are certified maintenance and CNC
operators. SPM Automation Inc.’s clients are usually automotive parts suppliers, such as Magna,
FlexNGate, Inteva, AP Plasma, and others. SPM Automation Inc. design and build various types
of welding machines that manufacture various automotive parts such as taillights, spoilers, gas
tanks, and other interior component. During the case study, the four-step implementation
strategy was conducted which will execute a transformation roadmap tailored to SPM
Automation Inc.’s work environment and priorities.
4.2.1 Assessment
The assessment process began with a visit to SPM Automation Inc.’s facilities. The cite visit had
three main objectives on the list, first which is to obtain a visual of the work process that the
enterprise practices, the machines and tools used, and the organizational structure. Second, was
to meet and interact with officials who could provide feedback based on their experience and
knowledge of the enterprise. Third was to collect data concerning how influential is every
37 structure is as following: The client (usually an automotive supplier) provides the institute with
detailed description of the part they would like to manufacture, these descriptions( drawing and
parameters) are then passed on to engineering who move forward with designing the machines
that are capable of manufacturing the part and choosing the materials of each of the machine’s
components. The designs and raw materials are supplied to the shop floor where operators will
begin the manufacturing process. The manufacturing processes consists of CNC machining,
welding, controls design, software programming, assembly, and machine testing.
Finally, the product is tested and assembled at the client’s shop floor. The CNC machining varies
38
Figure 4.6 SPM Automation Inc. Facility Floor Plan and the EROWA automated manufacturing system.
39
Figure 4.9 EROWA® Rack magazine Figure 4.10 EROWA® Round fixtures
Figure 4.11 SPM Automation Inc. operator loading EROWA® rotary magazine
40 As shown in Fig 4.6 A huge area of the shop-floor is occupied by EROWA since it is a multi-cellular
CNC machine. It Includes a Rack magazine Fig 4.9 which loads the rectangular fixtures displayed
in Fig 4.10 and a rotary magazine Fig 4.11 which loads the spherical fixtures displayed in Fig 4.10.
It as well includes two CNC stations and a loading station. Figs 4.7 and 4.8 display a visual of the
actual size of EROWA on the shop-floor. EROWA is operated as follows: The operator loads the
rack with the raw material fixed on a rectangular fixture (if the part is larger in size), or the
magazine fixed on a spherical fixture (if the parts are smaller in size). Within EROWA a robot
moving on a track fetches the fixtures and places them in the appropriate CNC machine station.
When the CNC machine is done with all required manufacturing processes, the robot fetches the
part and places it back on the rack, throughout the process no human being intervention is
required. Away from EROWA other processes such as welding, and assembly processes are
conducted 100 percent manually. During the manufacturing process, there is no live feed of the
Figure 4.13 EROWA tools magazine
41 manufacturing process, management is separated from shop floor, for one department to
contact the other it is still conducted the old fashion way which is by either physically being
present, through phone or email. SPM Automation Inc. shows no live feedback existing between
their facility and its suppliers or clients. SPM Automation Inc. give attention to workforce learning
and development since their operators are always required to attend training to keep them
updated with the operational and repair procedures of the most recent machines existing in their
facilities. SPM Automation Inc. has proven to be connected to academic institutes such as the
University of Windsor since they provide visits for students to their facilities and share their
knowledge and experiences with students through providing guest speakers and allow their
facilities to participate in case studies concerning recent researches. All these facts have made
its shape on the maturity model and illustrated the current maturity level the enterprise has
achieved. With the enterprise’s initial maturity level assessed (Results in Table 4.21) through
comparing the facility’s criteria to the criteria available at each level for each dimension in the
SSRI, it was possible to construct a radar chart (Fig 4.15) to display the maturity level of each
dimension.
The following is the results of the assessment process that took place at SPM Automation Inc.,
for each dimension and according to the maturity level SPM Automation Inc. scored, the row of
that specific maturity level is cropped from Singapore Smart Industry Readiness Index criteria
page and displayed ( all levels of all the dimensions and their criteria are available in Appendix
(A) in the tables below. Each table displays three columns band, definition, and description. The
band row displays the maturity level which could range between 1-5 and the level name. The
42
Table 4.5 Maturity level criteria (Board, 2018) (Table A.1)
Table 4.6 Maturity level criteria (Board, 2018) (Table A.2)
column further explains the definition column and elaborates on the situation that and industry
must be functioning under to score a certain maturity level. Under each table the feedback from
SPM Automation Inc.’s assessment that explains why SPM Automation Inc.’s facility has scored
the displayed maturity level.
1. Vertical integration assessment
Operations technology and information technology are not yet formally linked but instead, each
is conducted and operates separately. The vertical processes at SPM Automation Inc. such as raw
material, supplier, inbound logistics, manufacturing, outbound logistics are yet conducted by
humans with the support of digital tools such as computer servers instead of paper.
43
Table 4.7 Maturity level criteria (Board, 2018) (Table A.3)
Table 4.8 Maturity level criteria (Board, 2018) (Table A.4)
At SPM Automation Inc. it is noticeable that the information across different functions such as
Management, supervision, execution, strategic management, tactical management, and
operational management are totally managed by humans and the IT systems are far from being
linked from one end to the other. The supply chain process at SPM Automation Inc. is defined
and executed digitally.
3. Integrated product lifecycle assessment
The processes at SPM Automation Inc. whether it is vertical, horizontal, or product lifecycle such
as design and development, engineering, production, customer use, service and disposal are
conducted mainly by humans but with the aid of digital tools. SPM Automation Inc. is still not at
the point where human interaction can be eliminated. Some human interaction has been
eliminated over the years and replaced by computers and processes, however, due to the nature
of our business, we do not believe that human interaction can ever be completely eliminated.
44
Table 4.9 Maturity level criteria (Board, 2018) (Table A.5)
Table 4.10 Maturity level criteria (Board, 2018) (Table A.6)
With the sophisticated CNC machine EROWA on the shop floor, repetitive production processes
at SPM Automation Inc. such as moving materials to CNC machines, machining process, and
bringing it back to the racks is fully automated with no human intervention. However, some
repetitive operations such as raw material loading, and CAD supply are still human dependent.
SPM Automation Inc. is working on developing a system and process to automate the CAD design
supply, which will leave only one human dependent operation.
5. Automation enterprise assessment
At SPM Automation Inc. processes at the enterprise layer are yet in need of human intervention
but are not fully dependent on it. Computer based systems are in place and execute various
processes. However, at the end of the day, humans are needed to initiate or conclude certain
processes and unplanned events.
45
Table 4.11 Maturity level criteria (Board, 2018) (Table A.7)
Table 4.12 Maturity level criteria (Board, 2018) (Table A.8)
Just like the enterprise processes, processes at the facility layer are not yet fully automated and
still require minimal human intervention. Even though facility processes are executed with
computer support, human intervention is required to initiate and conclude certain processes.
7. Connectivity shop floor assessment
Production assets on the shop-floor such as equipment, machines, and systems that reside within
the shop-floor are not connected but instead are interoperable. Systems on the shop floor
interfaces can communicate with other products that are present at the moment or might be
included in the future. As an example, the EROWA system can adapt to a new type or shape of
fixtures that might be introduced in the future and be able to identify the part it is working on to
perform the manufacturing process that it requires.
46
Table 4.13 Maturity level criteria (Board, 2018) (Table A.9)
Table 4.14 Maturity level criteria (Board, 2018) (Table A.10)
The systems at SPM Automation Inc. are computer-based, they are capable of exchanging
information without any restrictions and in addition to being well secured. Real-time
communication is yet not existing.
9. Connectivity facility assessment
Just like connectivity at the enterprise layer at SPM Automation Inc., equipment, machines, and
systems that reside within the enterprise level are computer-based. They are capable of
exchanging information without any restrictions, in addition to being well secured. Real-time
communication is yet on existing.
10. Intelligence shop floor assessment
At the shop floor level at SPM Automation Inc., equipment such as EROWA®, are equipped with
advanced technology that is capable of identifying and reporting errors, which is why SPM