INVESTIGATION
A Connected Set of Genes Associated with
Programmed Cell Death Implicated in Controlling
the Hypersensitive Response in Maize
Bode A. Olukolu,*,1Adisu Negeri,*,1Rahul Dhawan,* Bala P. Venkata,†Pankaj Sharma,†Anshu Garg,† Emma Gachomo,†Sandeep Marla,†Kevin Chu,†Anna Hasan,†Jiabing Ji,†Satya Chintamanani,† Jason Green,‡Chi-Ren Shyu,‡,§Randall Wisser,** James Holland,††,‡‡Guri Johal,†and Peter Balint-Kurti*,††,2 *Department of Plant Pathology and‡‡Department of Crop Science, North Carolina State University, Raleigh, North Carolina 27695-7616,†Botany and Plant Pathology, Purdue University, West Lafayette, Indiana 47907-2054,‡Department of Computer Science and§Informatics Institute, University of Missouri, Columbia, Missouri 65211, **Department of Plant and Soil Sciences, University of Delaware, Newark, Delaware 19716, and††U.S. Department of Agriculture–Agricultural Research Service, Plant Science Research Unit, Raleigh, North Carolina 27695
ABSTRACTRp1-D21is a maize auto-active resistance gene conferring a spontaneous hypersensitive response (HR) of variable severity depending on genetic background. We report an association mapping strategy based on the Mutant Assisted Gene Identification and Characterization approach to identify naturally occurring allelic variants associated with phenotypic variation in HR. Each member of a collection of 231 diverse inbred lines of maize constituting a high-resolution association mapping panel were crossed to a parental stock heterozygous forRp1-D21, and the segregating F1generation testcrosses were evaluated for phenotypes associated with lesion severity for 2 years at two locations. A genome-wide scan for associations with HR was conducted with 47,445 SNPs using a linear mixed model that controlled for spurious associations due to population structure. Since the ability to identify candidate genes and the resolution of association mapping are highly influenced by linkage disequilibrium (LD), we examined the extent of genome-wide LD. On average, marker pairs separated by.10 kbp had anr2value of,0.1. Genomic regions surrounding SNPs significantly associated with HR traits were locally saturated with additional SNP markers to establish local LD structure and precisely identify candidate genes. Six significantly associated SNPs at five loci were detected. At each locus, the associated SNP was located within or immediately adjacent to candidate causative genes predicted to play significant roles in the control of programmed cell death and especially in ubiquitin pathway-related processes.
T
HE hypersensitive response (HR) mechanism is a wide-spread and important plant defense response. Charac-terized by a rapid, localized cell death around the point of attempted pathogen penetration, it is a form of programmed cell death and is usually associated with an acute local re-sistance response and up-regulation of defense response pathways (Coll et al.2011). HR and associated events are generally initiated by the products of resistance (R) genes,which trigger HR upon the recognition of specific pathogen-derived molecules or molecular events (Bent and Mackey 2007). The HR and related responses are generally associ-ated with resistance to biotrophic rather than necrotrophic pathogens. Among the multiple classes of R genes, those that encode proteins possessing a nucleotide-binding site (NBS) and a leucine-rich repeat (LRR) are the predominant class (Bent and Mackey 2007).
TheRp1locus on maize chromosome 10 carries multiple tandemly repeated NBS–LRR paralogs, some of which con-fer resistance to specific races of maize common rust con-ferred by the fungusPuccini sorghi(Hulbert 1997). The locus is meiotically unstable due to a high frequency of unequal crossovers between paralogs (Sudupaket al.1993). In one such case, unequal crossing over followed by intragenic re-combination resulted in the formation of the chimeric gene Copyright © 2013 by the Genetics Society of America
doi: 10.1534/genetics.112.147595
Manuscript received April 9, 2012; accepted for publication November 21, 2012 Supporting information is available online athttp://www.genetics.org/lookup/suppl/ doi:10.1534/genetics.112.147595/-/DC1.
1These authors contributed equally to this work.
Rp1-D21(Collinset al.1999; Smithet al.2010). In the resulting gene product, the recognition and elicitation functions are par-tially uncoupled, causing the spontaneous formation of HR lesions on the leaves and stalks of the plant in the absence of pathogens.Rp1-D21exhibits its lesion phenotype in a partially dominant and developmentally dependent manner (Hu 1996; Smithet al.2010). The severity of the phenotype is dependent on, among other things, genetic background (Chintamanani et al.2010; Chaikamet al.2011).
TheRp1-D21lesion phenotype can be used as a reporter for the identification of loci affecting the severity of HR triggered by Rp1-D21. Since theRp1-D21lesion phenotype is an exag-gerated defense response (Chintamanani et al. 2010), it is likely that many or all of these loci are also associated with variation in the wild-type defense response. In previous work (Chintamananiet al.2010; Chaikamet al.2011), a maize in-bred line (H95) into which Rp1-D21 was introgressed and maintained in a heterozygous condition (designated Rp1-D21-H95) was crossed with sets of lines from various mapping populations. By phenotyping the resulting F1progenies, several quantitative trait loci (QTL) modulating the HR conferred by Rp1-D21 were identified. This approach, in which a mutant phenotype is used as a reporter to reveal previously undetect-able genetically controlled variation, has been termed Mutant-Assisted Gene Identification and Characterization (MAGIC) (Johal et al. 2008). A similar approach was used to identify the slm1locus, a strong modulator of theles23lesion mimic gene in maize (Penninget al.2004).
In conventional maize QTL studies using a structured population derived from a biparental cross of inbred lines, a maximum of two alleles are sampled; consequently, many loci important for controlling the trait of interest do not segregate in the mapping population and cannot be detected. This problem can be partially addressed by conducting multiple QTL analyses using populations derived from different bipa-rental crosses, such as the maize nested association mapping population (McMullenet al. 2009) or by using recombinant inbred lines derived from intermating multiple diverse lines or accessions (Cavanaghet al.2008).
Alternatively, association mapping uses a population of diverse lines in which a wide genetic diversity is sampled. Just as with conventional QTL mapping, association map-ping identifies QTL by seeking associations between the presence or absence of specific alleles and variation in the trait of interest (Yu and Buckler 2006). Association mapping not only can assess a higher diversity of alleles, but also can lead to much more precise positional estimates due to the high number of recombination events accumulated during the historical diversification of the lines included in the pop-ulation. An obstacle to genome-wide association mapping in low linkage disequilibrium (LD) populations has been the large number of markers required to detect marker-trait asso-ciations. Until recently, this limited the search space to pre-determined candidate genes (Remington and Purugganan 2003). Advances in genomic technology have made it now
possible to conduct genome-wide association studies (GWAS) in low-LD populations.
Several maize association mapping populations have been constructed, containing various sets of diverse lines (Lu et al.2010; Liuet al.2011; Yanet al.2011; Yuet al.2011). The most widely used of these consists of 302 inbred lines representing the diversity present in public-sector breeding populations around the world (Flint-Garcia et al. 2005). Here we will refer to this population as the“maize associa-tion populaassocia-tion.”Subsets of this population have been used for association mapping of several traits, including maysin and chlorogenic acid accumulation (Szalma et al. 2005),
flowering time (Thornsberry et al. 2001), kernel composi-tion (Wilsonet al.2004), andflux in carotenoid biosynthesis pathways (Harjes et al. 2008). In all of these examples, a candidate gene approach was used in which genes already suspected of being involved in natural variation for the traits of interest were sequenced from each member of the pop-ulation. Recently, 47,445 single nucleotide polymorphism (SNP) markers were scored on 279 of the 302 lines, en-abling GWAS using this population (Cooket al.2011; Ganal et al.2011).
In this study, we combined the MAGIC and GWAS approaches to identify loci and genes associated with modu-lating the maize HR defense response. TheRp1-D21-H95 line, which is heterozygous for the Rp1-D21gene, was crossed to a subset (231 lines) of the maize association population, and the resulting F1families were evaluated in multiple environ-ments. GWAS led to the identification of six SNP loci signifi -cantly associated with variation in the Rp1-D21 lesion phenotype. Since two of these SNPs were in high LD, this suggested that the effects offive causative genes were being detected. In each of the five cases, associated SNPs were localized within or adjacent to genes previously implicated in the control of programmed cell death and especially in the ubiquitin pathway associated with protein degradation. We also report on genome-wide LD decay in this association population as well as the extent of local LD decay around the significantly associated SNPs. This approach, combining MAGIC with GWAS, offers great promise for the identification of alleles and loci associated with a variety of quantitative traits.
Materials and Methods
Plant materials
The Rp1-D21-H95 mutant line was created by crossing a Rp1-D21 variant and the maize inbred line H95; the F1 was subsequently backcrossed to the H95 parent four times, while selecting for plants that formed spontaneous HR-like lesions. TheRp1-D21-H95 stock is maintained in a heterozy-gous state sinceRp1-D21homozygous plants are sterile.
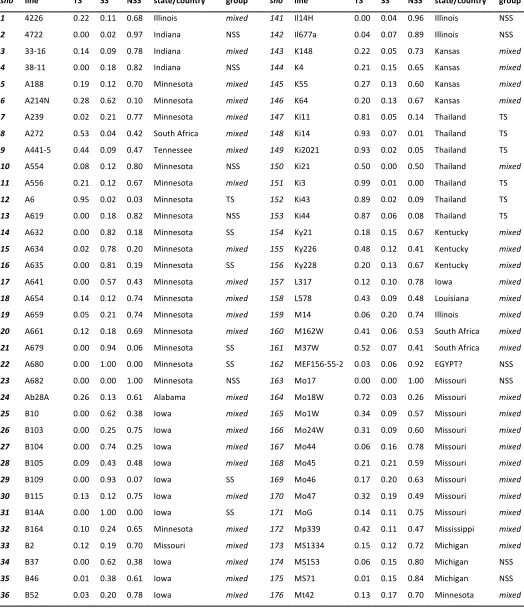
male to each of 231 lines (a subset of the 302 lines;
Supporting Information,Table S1and Table S2) to cre-ate a set of F1families, each of which segregated 1:1 for the presence/absence of Rp1-D21 but which were other-wise isogenic within a family. The selection of the 231 lines to use from the original 302 was based on the availability of genotypic data and sufficient testcross seed for phenotypic evaluation.
Field trials
Each of the 231 F1families was evaluated in four environ-ments (two places and two time periods): in Clayton, North Carolina, and in West Lafayette, Indiana, in the years 2009 and 2010. A randomized complete block design with two replicates in each location was used. Two rows of a constant genotype were planted around the edges of the field to eliminate border-row effect. Standard fertilizer, pesticide, and herbicide regimes were applied during the trial to en-sure normal plant growth. Thinning to desired plant density and overhead irrigation were applied as required. At Clayton, North Carolina, 10 kernels of each line were sown in 2-m rows with an inter-row spacing of 0.97 m and a 0.6-m alley at the end of each plot, while at West Lafayette, Indiana, 18 seeds were sown in 6-m rows with an inter-row spacing of 0.76 m.
Phenotypic scoring
Each F1family segregated 1:1 for the presence/absence of Rp1-D21but was otherwise isogenic. Within a family it was immediately obvious, by the presence or absence of lesions and the growth habit of the plant, which plants carried Rp1-D21 and which were wild type (Figure S1). Fifteen lesion-associated traits were scored on each plot. For some of these traits, only plants carryingRp1-D21were scored, while, for others, both wild-type and mutant plants were measured and the mutant/wild-type ratio was calculated (see below). A description of each of the traits that were scored follows.
Traits derived fromfield observations
HR lesion severity:Lesion severity (LES) was measured only on mutant plants. At both locations, lesion severity scores were assigned based on a 0–10 scale, with 0 =“no lesion” and 10 = “completely dead plant”(Chaikam et al. 2011). Experiments were scoredfive times at West Lafayette, Indi-ana, and six times at Clayton, North Carolina, starting 1 month after planting and continuing at 10- to 14-day intervals.
We scored an aberrant defense response rather than disease in this case, but since the phenotypes observed are generally similar we used a widely accepted statistic in plant pathology—standardized area under disease progress curve (sAUDPC)—to measure quantitative levels of HR (Shaner and Finney 1977). The sAUDPC for LES was calculated for each environment as follows: The average value of two con-secutive ratings was computed and multiplied by the num-ber of days between the ratings. Values were summed over
all intervals and then divided by the total number of days over which evaluations were performed to determine the weighted average.
Mutant to wild-type height ratio: Plant height data were collected from three representative mutant F1 individuals and from three representative wild type F1 individuals within each F1 family. Height means were calculated for each class within each family, and the height ratio (HTR) was calculated by dividing the average mutant-type height to the average wild-type height.
Mutant to wild-type stalk width ratio: Stalk width imme-diately above the ear was measured from three representative mutant F1 individuals and from three representative wild-type F1 individuals within each F1 family. Stalk width ratio (SWR) was then calculated by dividing the average mutant-type stalk width by the average wild-mutant-type stalk width.
Traits derived from image analysis
At both the third/fourth and seventh/eighth leaf stage, photographs were taken of two leaves per row for each row in each experiment, with the exception of the second replicate in Clayton 2009, which was not photographed. Images were taken using a Canon Rebel Xsi camera with a Gretag Macbeth Mini Color Checker included in thefield of view. Images were preprocessed with custom algorithms written in C/C++ using the OpenCV library that (1) standardizes images by performing color correction, (2) identifies leaves in the image, and (3) highlights necrotic leaves using spectral characteristics (Greenet al.2012). From this segmentation, the following aggregate traits were computed.
Percentage of necrotic lesions: The percentage of necrotic lesions (PCTLES) represented the proportion of the entire leaf identified as necrotic.
Number of lesions:The number of necrotic lesions (NULES) trait is the count of the number of individual lesions highlighted in each image.
Average necrotic lesion size:For average necrotic lesion size (LESSIZ), the area of each detected lesion was measured in pixels with the average area computed and reported.
For each of these traits, averages for the third/fourth leaf and seventh/eighth leaf stages were obtained for each plot, and an average value across stages was calculated. A suffix of 4, 8, or AV was appended to the trait designation to indicate the stage to which it refers (e.g., LESSIZ4, LESSIZ8, LESSIZAV).
Genotypic data
locations in the maize genome and that had ,20% missing data were used in the association analysis. Additional SNP markers developed by Ed Buckler’s research group (U.S. De-partment of Agriculture–Agricultural Research Station, Cornell University) by a genotyping-by-sequencing (GBS) method (Elshire et al. 2011) were retrieved from http://www. panzea.org/dynamic/derivative_data/genotypes/Maize282_ GBS_genos_imputed_20120110.zip. GBS markers were an-alyzed for2-Mbp windows around SNPs from the 50,000 Illumina array data set that were detected as having signif-icant associations with phenotypic traits measured in this study.
Statistical analyses
Supporting Informationfiles:File S1,File S2,File S3,File S4,File S5,File S6, File S7,File S8,File S9, and File S10
contain most of the phenotypic and genotypic data used in the analyses described here.
Estimation of least square means and heritabilities: For the purpose of obtaining inbred line mean values adjusted for environmental effects, data were analyzed with a mixed model considering lines as fixed effects and environment, replication within environment, and line-by-environment interaction as random using Proc Mixed in SAS v9.2 (SAS Institute 2000–2004). Wald’sZstatistic was used to test the significance of each random factor in the model (Littellet al. 2006). Least squares means for lines were estimated from this mixed model and used as the input phenotype data for association analysis. For the purpose of estimating heritabil-ity, a mixed model with all factors, including lines, as ran-dom effects was used.
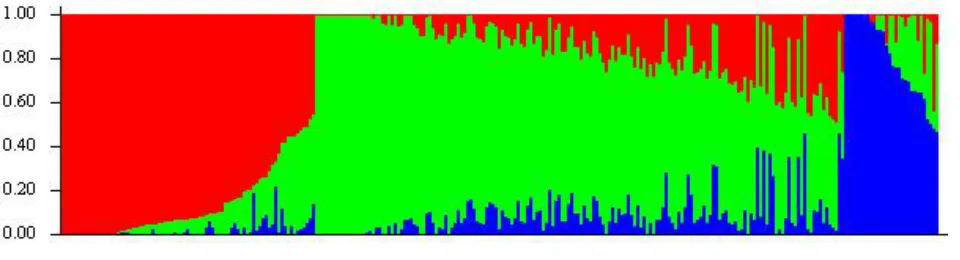
Population structure: Population structure can result in a systematic bias that produces false-positive associations if not accounted for in association analyses (Hirschhorn and Daly 2005). Population structure in this set of lines was previously analyzed using 89 SSR markers (Flint-Garcia et al.2005). We reanalyzed the population structure using a subset of 5000 SNP markers with no missing data and sampled from at least every 72-kbp interval of the maize physical map. STRUCTURE v2.3.3 software (Pritchard et al.2000) was used to characterize the population struc-ture of the maize association panel. The model implemented assumed that loci are independent within populations (Con-rad et al.2006; Falushet al. 2007); hence, the selection of 5000 markers used for the analysis was based on a relatively even distribution over the entire genome in which the small-est physical interval between any two markers used for the structure analysis was 72 kbp.
The method used to calculate population structure estimates the probability that a particular line belongs to a particular subpopulation (Qk), given a fixed number of
subpopulations (k) specified. Independent tests were con-ducted forkranging from 1 to 12 using an admixture model, following a burn-in phase of 1·105and a sampling phase of
5·105replicates. Three runs were performed for each value ofk. By evaluating the change in model likelihood ask in-creased, we observed that, initially, the likelihood increased monotonically askincreased, but after a point, the change in likelihoodfluctuated slightly between increasing and de-creasing values as kincreased. We chose the optimal value ofkas that value that produced the highest model likelihood before further increases in k resulted in a fluctuating re-sponse in likelihood to increasingk(Pritchardet al.2000). Membership probabilities (Qk) were used for assigning lines
to subpopulations. Lines with highest membership probabil-ity, Qk ,0.8 for all k, were considered to result from
ad-mixture and hence were classified as“mixed.”
Genotypic correlation analysis: We estimated genotypic correlations among lesion mimic traits measured in this study and previously derived quantitative resistance scores for three different diseases of maize measured on the same association panel but evaluated in different environment sets (Wisseret al.2011): southern leaf blight (SLB), north-ern leaf blight (NLB), and gray leaf spot (GLS). To reduce the impact of population structure on genotypic correlation estimates, we estimated correlations among inbred line re-sidual values obtained after fitting population structure covariates (bkfor eachQk) to least square means (for lesion
mimic traits) or best linear unbiased predictors (for disease scores) for each trait. We did not incorporate the realized genetic relationship matrix (K) into the trait correlation es-timation procedure because it is not appropriately scaled for variance–covariance component estimation (VanRaden 2008; Zhanget al.2009).
Linkage disequilibrium analysis: LD was quantified as r2
(Hill and Robertson 1968) and was estimated for all pairs of 47,445 SNPs using TASSEL v4.0 (Bradburyet al.2007). We partitioned SNP pairs into those on the same chromosome (“linked”pairs) and those on different chromosomes (“ un-linked”pairs). The 95th percentile (Q95) of unlinked SNP LD r2 values was estimated from the distribution of values
among all unlinked SNP pairs. We used this value as a threshold representing an upper bound of unlinked LD expected throughout the genome (Breseghello and Sorrells 2006). Within each chromosome, we classified SNP pairs according to physical distance into discrete distance ranges (e.g., 1–100 bp, 100–1000 bp, etc.) and estimated the dis-tribution of linked LD r2 values for pairs within each
dis-tance class. All analyses except generation of the r2values
were performed with R software (R Development Core Team 2008).
heterozygous SNP genotypes. The realized kinship coeffi -cients were estimated in Tassel version 2.1 (Bradbury et al. 2007) using similarity based on marker identity by state. The similarity matrix was computed from the distance matrix by subtracting all values from 2 and then scaling so that the minimum value in the matrix is 0 and the maximum value is 2. Tassel version 4.1.8 was used for the genome-wide association analysis based on a mixed linear model. The vector of phenotypes (y) was modeled as:
y ¼Xb þ Zu þ e;
wherebrepresents a vector containingfixed effects, includ-ing the SNP marker beinclud-ing tested; u represents a vector of random additive genetic effects associated with lines; e is a vector of residual effects; andXandZ are incidence ma-trices relatingytobandu, respectively. The variances of the random effects are modeled as Var(u) = 2KVg, whereK is an n- · n- matrix of pairwise relative kinship coefficients defining the degree of genetic covariance between lines andVgis the genetic variance (Yuet al.2006).
The restricted maximum likelihood estimates of the vari-ance components were obtained using an efficient mixed-model association algorithm method (Kanget al.2008; Zhang et al. 2010). The optimum compression mixed linear model and P3D options, which increase statistical power and compu-tational speed, were implemented by clustering individuals in-to groups (Zhang et al. 2010). The P-values for each of the 47,445 tests of associations between one SNP and one trait were used to estimate the positive false discovery rate (FDR) associated with each level of P-value observed using the R package QVALUE version 1.0 (Storey and Tibshirani 2003).
Candidate gene selection
Genes located within or adjacent to associated SNPs were identified using the MaizeGDB genome browser (Andorfet al. 2010) or the www.maizesequence.org/ genome browser (Schnable et al.2009). Annotations of the candidate genes were performed based on a BLAST search of the amino acid sequence of the transcripts using the blastp (Altschulet al. 1997) and conserved domain search tools (Marchler-Bauer et al. 2005) on the National Center for Biotechnology In-formation website and the BLAST2GO software (Conesa et al.2005).
Results
Heritability and analysis of variance
TheRp1-D21-H95 stock, which is heterozygous for the Rp1-D21gene, was crossed to a subset (231 lines) of the 302-line association panel, and the resulting F1families were evalu-ated in replicevalu-atedfield trials over multiple environments for several traits associated with the severity of the auto-active HR phenotype conferred by the Rp1-D21 gene. The three
field observation-derived traits (LES, HTR, and SWR) all had high heritability,.0.85 on a line-mean basis (Table S3). Of the
image analysis-derived traits, only PCTLESAV and PCTLES4 had a line-mean heritability.0.8. Line and line-by-environment in-teraction were significant contributors to variance for all traits (Table S3).
Correlation analysis
Genetic correlations were estimated between thefield-derived HR-related traits and resistances to three different diseases of maize previously examined using the same association panel (Wisser et al.2011): SLB, NLB, and GLS. Correlation coeffi -cients were estimated while taking population structure into account (Wisseret al.2011). The traits measured on the Rp1-D21population (LES, HTR, and SWR) were highly genetically correlated with each otherðjrgj.0:85;p,0:001Þ(Table 1). Correlations between theseRp1-D21-asociated traits and the disease traits were moderately significant for only HTR and NLB (rg=20.11,P,0.10) and LES and SLB (rg=20.12,P
,0.10). Correlation coefficients estimated here among SLB, GLS, and NLB resistance traits (0.52–0.59) were similar to those estimated from the previous study (0.55–0.67) (Wisser et al. 2011) despite using a different marker data set for population structure estimation and a simplified approximate two-step estimation procedure in this study.
Assessment of population structure
Previous studies of similar samples of the same maize diversity panel employed 89 SSRs that detected 1694 alleles (Hamblin et al.2007) and 94 SSRs that detected 2039 alleles (Liuet al. 2003) for estimating population structure. Population struc-ture estimated here using 5000 SNPs gave largely similar results to those reported previously (Figure S2;Table S1;Table S2). Compared to the previous analyses, some lines were reas-signed from one of the three well-established maize germ-plasm groups [stiff stalk (SS), non-stiff stalk (NSS), or tropical–subtropical (TSS)] to the admixed group (containing lines with the probability of membership in each of the three major germplasm groups,0.8), but no lines were reassigned from one to another distinct population group. A large majority of the lines that were reassigned from one of the population groups to the mixed group in the current analysis had a high probability of membership (P= 0.6–0.79) in their previously assigned group (Table S1;Table S2),i.e., close to the arbitrary threshold used for group classification.
Table 1 Genetic correlation coefficients between select traits and disease resistance score values obtained from a previous study (Wisseret al.2011)
HTR SWR SLB GLS NLB
LES 20.91** 20.87** 20.12* NS NS
HTR 0.85** NS NS 20.11*
SWR NS NS NS
SLB 0.62** 0.67**
GLS 0.66**
LES, lesion score fromfield; HTR, height ratio; SWR, stalk width ratio; SLB, southern leaf blight resistance; GLS, gray leaf spot resistance; NLB, northern leaf blight resistance. Nonsignificant (NS,P.0.1) correlation estimates are not shown.**P,
Population structure (Q) accounted for 16.5 and 13.8% of the variation in HTR and LES line means, respectively (Table S4). The realized kinship matrix captured most of the genotypic variance (77.1 and 92.3% for HTR and LES, respectively) (Table S4).
Linkage disequilibrium in the diversity panel
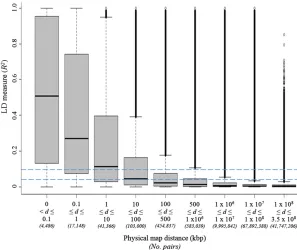
We estimated ther2values of LD between each SNP and all other SNPs on different chromosomes (“unlinked SNP pairs”) to determine the empirical distribution of LD for un-linked SNPs. The 95th percentile (Q95) ofr2values for un-linked SNP pairs was estimated to be 0.04. We used this value as a threshold representing an upper bound of un-linked LD expected throughout the genome (Breseghello and Sorrells 2006). Considering SNPs on the same chromo-some genome-wide, mean LDr2dropped below 0.1 for SNP pairs separated by.10 kbp (Figure 1). Mean LDr2for SNP pairs separated by.100 kbp was below the 0.04 threshold value defined for SNPs on different chromosomes.
Association mapping of loci modulating lesion mimic phenotype
Traits with a heritability .0.8 on a line-mean basis were used for association analysis. The following traits met this criterion: lesion scores (LES), mutant to wild-type HTR, mu-tant to wild-type SWR, PCTLES on the third or fourth leaf (PCTLES4), and average PCTLES (PCTLESAV). We per-formed association analysis using the least square mean val-ues of inbred lines and a mixed linear model to adjust for background genetic relationships implemented in TASSEL version 4.1.8. Then we estimated the false discovery rate (q) for each SNP based on the empirical distribution of all SNPP-values for a given trait using the approach of Storey and Tibshirani (2003) (Figure S3andFigure S4). One SNP
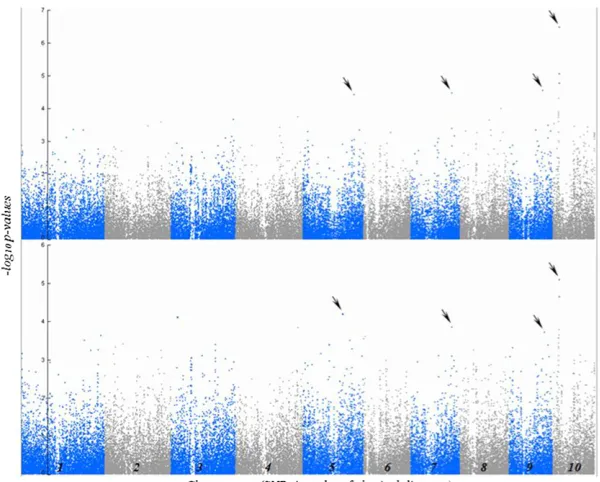
was associated with HTR at q#0.05, and four additional SNPs were associated with HTR at q# 0.3 (Figure 2 and Table 1). No SNPs hadq-values belowq = 0.3 for associa-tion tests with any of the other analyzed traits. Among these traits, however, analysis of LES yielded SNPs with the lowest P-values. LES and HTR are highly correlated traits (Table 2), and all SNPs significantly associated with HTR were also found to be the most significant (lowestq-value) for associ-ations with LES (Figure 2 and Table 1).
To characterize local LD structure more accurately and in the genome regions surrounding the associations initially identified with the 50,000 Illumina Array, we rescanned 2-Mbp windows surrounding each of these SNPs at higher marker density. This maize diversity panel was recently assayed for SNPs at.10-fold higher density using GBS. After rescanning with the GBS data set, we detected a new strong SNP association at a locus on chromosome 10 (Table 1 and
Figure S5). The new SNP was 29,198 bp downstream of the initially identified SNP. These two SNPs are located within a block of relatively high LD (Figure S5), located between 21,680,566 and 21,726,608 bp on chromosome 10. Fur-thermore, these two SNPs are in high LD with each other (r2= 0.36). We also detected one other SNP associated with HTR on chromosome 10. This third SNP is 100,526 and 129,724 bp from the other two significant SNPs, but despite its adjacent genomic location is nearly in linkage equilibrium with them.
Candidate gene colocalized with associated SNPs
Using the filtered predicted gene set from the annotated maize genome based on maize inbred B73 (Schnableet al. 2009; http://www.maizesequence.org), we examined the genes that contained the SNPs that showed statistically sig-nificant associations with the traits. Several of these genes
Figure 1Distribution of linkage disequilibrium measure (r2) over various physical map distance classes between
linked SNP marker pairs (d) over the entire maize genome. Horizontal dashed line indicates theQ95of ther2
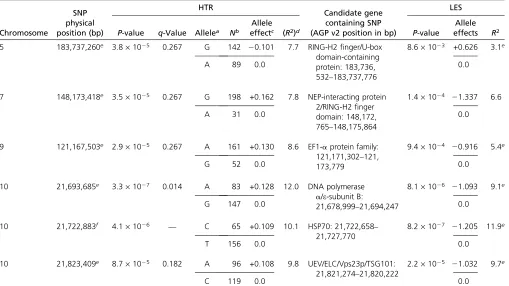
have predicted functions related to immune response pathways (Table 1), including a RING finger/U-box domain-containing protein, a nuclear encoded polymerase (NEP) interacting-protein 2 (NIP2)/RING-H2 zinc finger domain-containing potein, an elongation factor 1-aprotein, a DNA polymerase a/e-subunit B protein, a heat-shock 70-kDa protein (HSP70), and a ubiquitin E2 variant (UEV)/RING finger and WD domain-containing protein.
Allelic distribution at candidate genes
We estimated the frequency of alleles at the six SNPs significantly associated with HTR in the three major maize germplasm groups (SS, NSS, and TS). Alleles enhancing the HR associated with Rp1-D21 are over-represented in TS lines relative to other groups at all loci except the SNP on chromosome 9 (Table 3).
Discussion
In this study, we employed the MAGIC procedure (Johal et al.2008) using F1families derived from crosses between a reference line with an allele conferring an auto-active HR phenotype,Rp1-D21, and a densely genotyped collection of 231 inbred lines to perform a GWAS. The goal of this strat-egy was to identify genomic variation that interacted epis-tatically with the Rp1-D21 allele. These might include variation in defense response genes in pathways that are regulated by R genes, which are normally undetectable in a wild-type background. A shortcoming of the approach is that dominant alleles inherited from the reference line can mask functional variation harbored among the inbred lines. Although not implemented here, this can be addressed using different crossing schemes that allow for the detection of recessive alleles (Johalet al.2008).
ANOVA and heritability
The heritabilities of thefield observation-derived traits LES, HTR, and SWR were all .0.85 (Table S3). Of the image analysis-derived traits, the PCTLES traits had heritabilities between 0.65 and 0.83 on a line mean basis, but the herit-abilities of other traits were much lower (Table S3). The main reasons for the lower heritabilities for the image anal-ysis-derived traits likely included:
A difference in the amount of data utilized. Image traits were calculated based on images from only two leaves per row. Field-observation scores were assessed on the entire row.
The time period required to image the population. By neces-sity, images were captured over several days early in the season, a time of active growth when the plants were changing day to day. LES was scored on a single day for the whole population at each time point. HTR and SWR were scored at the end of the season when the plants had stopped growing.
Correlation between disease resistance and defense response traits
The same maize association population had previously been assessed for resistance to the three diseases SLB, GLS, and NLB (Wisseret al.2011). Strong correlations between resis-tances to these three diseases were identified, implying that the genetic mechanisms controlling these traits were par-tially shared. To determine whether some of the processes mediating the exaggerated defense response conferred by Rp1-D21might also be involved in mediating disease resis-tance to SLB, GLS, or NLB, we estimated the correlations
Figure 2Results of GWAS showing the significant SNP associations (arrows) with HTR (top) and HR LES (bottom). The vertical axis indicates the–log10ofP-value scores, and
between these traits measured in this population. Margin-ally significant correlations were observed between HTR and NLB (rg=20.11,P,0.1) and between LES and SLB (rg=20.12,P,0.1). While the HTR/NLB correlation was in the expected direction (i.e., a strongerRp1-D21-mediated defense response was associated with higher resistance), the LES/SLB correlation was not. Therefore, it seems that vari-ation affecting the severity of the maize HR was in large part unassociated with variation affecting resistance to SLB, NLB, and GLS. Since HR is a mechanism associated
pre-dominantly with resistance to biotrophic pathogens and these three diseases are, to varying extents, necrotrophic (Jennings 1957), it could be argued that this result is not surprising.
LD in the maize association population
The selection of candidate genes using GWAS was based on the premise that a causative polymorphism will be in LD with markers in close proximity. The extent of LD deter-mines resolution: i.e., the smaller the LD block, the better
Table 3 Allele frequencies of significantly associated SNPs in the maize germplasm groups
Allele frequency(%)a Nb
Chromosome SNP physical position (bp) Allele increasing HRc SS NSS TS P-value* SS NSS TS
5 183,737,260 G 83.3 41.5 93.8 0.000004 18 41 32
7 148,173,418 A 0.0 14.6 29.0 0.03 18 41 31
9 121,167,503 G 64.7 5.1 25.9 0.00001 17 39 27
10 21,693,685 G 38.9 63.4 81.3 0.01 18 41 32
10 21,722,883 T 33.3 71.8 86.7 0.0005 18 39 30
10 21,823,409 C 33.3 53.8 76.7 0.01 18 39 30
SS, stiff stalk; NSS, non-stiff stalk; TS, tropical subtropical.*P-values after testing the null that the proportions (probabilities of success) in subpopulations are the same (prop. test in R software).
aAlleles are from homozygote genotypes. bN, total number of lines included in analysis.
cAlleles that increase hypersensitive response in the LES (visual lesion score) and HTR (mutant:wild type ratio) traits.
Table 2 Chromosomal locations, candidate genes and other parameters of the six SNPs identified as being significantly associated with HTR in this study
Chromosome SNP physical position (bp) HTR Candidate gene containing SNP (AGP v2 position in bp)
LES
P-value q-Value Allelea Nb
Allele
effectc (R2)d P-value
Allele effects R2
5 183,737,260e 3.8·1025 0.267 G 142 20.101 7.7 RING-H2finger/U-box
domain-containing protein: 183,736, 532–183,737,776
8.6·1023 +0.626 3.1e
A 89 0.0 0.0
7 148,173,418e 3.5·1025 0.267 G 198 +0.162 7.8 NEP-interacting protein
2/RING-H2finger domain: 148,172, 765–148,175,864
1.4·1024 21.337 6.6
A 31 0.0 0.0
9 121,167,503e 2.9·1025 0.267 A 161 +0.130 8.6 EF1-aprotein family:
121,171,302–121, 173,779
9.4·1024 20.916 5.4e
G 52 0.0 0.0
10 21,693,685e 3.3·1027 0.014 A 83 +0.128 12.0 DNA polymerase
a/e-subunit B:
21,678,999–21,694,247
8.1·1026 21.093 9.1e
G 147 0.0 0.0
10 21,722,883f 4.1·1026 — C 65 +0.109 10.1 HSP70: 21,722,658–
21,727,770
8.2·1027 21.205 11.9e
T 156 0.0 0.0
10 21,823,409e 8.7·1025 0.182 A 96 +0.108 9.8 UEV/ELC/Vps23p/TSG101:
21,821,274–21,820,222
2.2·1025 21.032 9.7e
C 119 0.0 0.0
aAlleles are from homozygote genotypes.
bN, total number of lines with the specific SNP genotype.
cPositive allelic effects for HTR and LES imply a suppressive and enhancing effect on the HR phenotype, respectively. dR2, proportion of phenotypic variance explained by SNP.
the resolution to detect causative SNPs/genes. In this study, we present a comprehensive genome-wide LD analysis of the maize genome. As found previously (Yan et al. 2009; Van Inghelandt et al. 2011), LD was somewhat variable across chromosomes and germplasm groups. On average, marker pairs separated by .10 kbp had an r2value ,0.1
(Figure 1). This level of LD is broadly in line with, although somewhat higher than, previous estimates that were based on less extensive surveys of the genome. Remington et al. (2001) showed that LD around six genes in 102 inbred lines (a subset of the association population used here) generally declined rapidly, withr2values dropping below 0.1 within
1500 bp in most cases. A genome-wide LD scan of 327 loci in a population of 632 diverse inbred lines (which included the maize association population used here as well as other lines) showed that LD decay distances ranged between 1 and 10 kbp (Yanet al.2009). Selection of candidate genes needs to be considered on a case-by-case basis since LD is highly variable across the genome (Figure 1 andFigure S5).
False discovery rate estimation
We used the approach of Storey and Tibshirani (2003) to estimate the FDR q-value corresponding to each P-value obtained from GWAS. The relationship between FDR and P-values was estimated separately for each trait. This method attempts to estimate the proportion of true null hypotheses among all tests based on the observed distribution ofP -val-ues. If all null hypotheses (that the two alleles at each SNP have equal effects) were true, one would expect an equal distribution of P-values across equally sized intervals from P= 0 toP= 1. If some proportion of null hypotheses were false, then one would expect to observe a relatively constant proportion of tests with higher P-values (because these cor-respond to true null hypotheses) and an inflated proportion of tests withP-values below some threshold, corresponding to a mixture of true null hypotheses and true false hypotheses. The method of Storey and Tibshirani (2003) estimates the proportion of truly null hypothesis based on the region of the P-value distribution that is approximatelyflat for the purpose of computing the expected FDR corresponding to eachP-value. The two traits primarily studied here, HTR and LES, had high heritabilities, indicating strong genetic influence on the phenotypes, but the empirical distributions of GWASP -val-ues were skewed toward higher P-values for all traits ( Fig-ure S3 and Figure S4). Thus, we detected only a few significantly associated SNPs even at an FDR of 0.30; the probability of false discoveries increased very rapidly to near one with only a small increase in P-values above the very lowest levels observed (Figure S3andFigure S4). We expect that the remaining SNPs are truly null or have such small effects as to be undetectable with current sample sizes. These results suggest that many of the genes affecting these traits tend to have small effects, for which we have low power of detection due to a limited sample size and insuffi -cient marker density for the low level of LD in the panel.
Influence of coancestry and population structure on statistical power of GWAS
We used the realized kinship matrix to minimize the chance of reporting false-positive associations due to population structure or pedigree relationships among the lines of the diversity panel. The large amount of variation accounted for by the pairwise genetic relationships (Table S4) suggests that the inheritance of these traits is due primarily to addi-tive polygenic effects. Power to detect individual SNP asso-ciations with the traits depends on the magnitude of their effects, their allele frequencies, and their allelic distribution. In this case, it is likely that several SNPs that were associated with significant levels of variation were not detected since the effects of SNPs whose allelic distribution closely follows the background realized genetic relationships will contrib-ute to the background additive genetic variance component modeled by the K matrix, and we will have low power to detect them in GWAS.
Association analysis results
Six SNPs that were significantly associated with HTR were identified (Table 1); three of these were located in an 130-kbp genomic region on chromosome 10 at 21,693,685 bp, 21,722,883 bp, and 21,823,409 bp (which we will here call SNPs 1, 2, and 3, respectively). SNPs 1 and 2 are located in a region of high LD and are themselves in relatively high LD (r2= 0.36). Thus it is possible that SNPs 1 and 2 are asso-ciated with the same underlying causal variation. SNP 3, how-ever, is in low LD with SNPs 1 and 2, suggesting that SNP3 is associated with a causal polymorphism distinct from the causal polymorphism with which SNPs 1 and 2 are associated. These chromosome 10 SNPs precisely colocalize with the Hrml1 locus, a major QTL associated with variation in the same traits, which had been identified in an independent linkage analyses in several linkage mapping populations, most precisely in the advanced intercross line (sensuDarvasi and Soller 1995) Intermated B73·Mo17 (IBM) population that was derived from a cross between the inbreds B73 and Mo17 (Chintamananiet al.2010; Chaikamet al.2011). The present study provides a much higher resolution of theHrml1 region than before, narrowing the region of interest from3 Mb potentially to single-gene resolution. The fact that we identified precisely the same QTL with several entirely inde-pendent data sets and two different analysis techniques val-idates this QTL and suggests that our data sets and analysis methods are robust and accurate.
chromosome 9 is located close to a previously identified QTL interval in the IBM population (Chintamananiet al.2010). This SNP is not polymorphic between B73 and Mo17 (Table S5).
Alleles enhancing theRp1-D21HR phenotype were over-represented in the TS germplasm group relative to the SS and NSS groups (Table 3). An enhanced defense response would suggest higher disease resistance levels and agrees with observations that the TS germplasm group is in general more disease resistant than the other defined germplam groups (Negeriet al.2011; Wisseret al.2011).
Candidate genes
We used the publically available maize genome sequence to identify candidate genes encompassing or adjacent to these SNPs. Several of the candidate genes that we identified play a role in the ubiquitination protein degradation pathway. In mammalian systems, ubiquitin is critical for the regulation of several steps of the apoptosis pathway (Lee and Peter 2003). This was intriguing since both apoptosis and HR are forms of programmed cell death. Additionally, the plant ubiquitin pathway plays an important role in the plant defense response (Peart et al. 2002; Kadotaet al. 2010). Ubiquitin ligation is a multi-step process that requires three classes of enzymes (Ciechanover 1998): an E1-activating enzyme, a ubiquitin-conjugating enzyme E2, and an E3 ubiquitin-protein ligase.
Two of the identified candidate genes (on chromosomes 5 and 7, Table 1) contain RING-H2finger domains, known to possess E3 ubiquitin-protein ligase activity and exhibit binding activity toward E2 ubiquitin-conjugating enzymes, mediating ubiquitination and degradation of the protein by the proteasome. The chromosome 5-associated SNP is within a gene that belongs to a class of E3 ligases defined by pos-session of a so-called U-box, a highly conserved 70-amino-acid modified RING-finger domain (Koegl et al. 1999; Ara-vind and Koonin 2000). Interestingly, U-box proteins appear to interact with molecular chaperones including HSP70 (Hatakeyama et al. 2004), another of our candidate genes (see below). The associated SNP on chromosome 5 creates a premature stop codon immediately downstream of the RING-finger domain. The chromosome 7-associated SNP is within a gene with strong homology to the nuclear-encoded polymerase (NEP) interacting-protein 2 (NIP2), which contains three transmembrane domains and one RING-H2 domain. The NIP2 gene has been implicated in the pathogen defense re-sponse inNicotiana benthamiana(Chenget al.2010).
The closest annotated gene to the associated SNP on chromosome 9 is predicted to be a eukaryotic elongation factor 1-aprotein (EF1-a) gene, an evolutionarily conserved GTPase protein and part of the elongation factor-1 complex that catalyzes the enzymatic efficient delivery of charged transfer RNAs to the ribosome during protein elongation and has a critical role in translation fidelity and nuclear export of proteins (Uetsuki et al. 1989; Negrutskii and El’skaya 1998). A study by Talapatraet al.(2002) suggested that EF1-aexpression conferred selective resistance to apo-ptosis induced by growth factor withdrawal and ER stress.
The other three associated SNPs were all located in the Hrml1region on chromosome 10 as discussed above. SNP 1 and SNP 2 (as defined above) are in substantial LD with each other and define two candidate genes: SNP 1 is within a DNA polymerasea/e-subunit B gene, and SNP2 is within anHSP70 gene. Although, due to LD, it is difficult to tell precisely which of these two genes is more likely the causative gene, based on functional annotation, theHSP70gene seems the better can-didate. HSP70s are molecular chaperones, a component of the cell’s machinery involved in protein folding (Beere and Green 2001). The downregulation ofHSP70has been shown to facilitate induction of apoptosis while its stress-induced upregulation has been shown to inhibit apoptosis in animal and plant cells (Parsell and Lindquist 1993; Cronjéet al.2004). HSP70was shown to be essential for HR associated with non-host resistance in tobacco (Kanzakiet al.2003) and for basal resistance inArabidopsis(Jelenskaet al.2010).
SNP 3 on chromosome 10 (which is not in LD with the other two chromosome 10-associated SNPs) is 2135 bp upstream of the start codon of a gene that has significant sequence similarity to an inactive form of the E2 ubiquitin-conjugating enzyme predicted to be unable to catalyze ubiquitin transfer since it lacks the active cystine site. Nevertheless, the UEV domain has the ability to bind ubiquitin and may serve as a cofactor in ubiquitination reactions, as an ubiquitin sensor, or to couple protein and ubiquitin-binding functions to facilitate formation of multi-protein complexes (Pornillos et al.2002; Teoet al.2004). More recent studies (Spitzeret al.2006) have annotated homologs of this maize gene inArabidopsis as the ELC gene encoding the Vps23p/TSG101 homolog, a key com-ponent of the ESCRT I-III machinery in yeast and animals that recognizes mono-ubiquitylated proteins and sorts them into the endosomal multivesicular body (MVB). The Arabidopsis ELC was shown to bind ubiquitin and localizes to endosomes and the MVB, which contain numerous vesicles that are even-tually fused with the vacuole/lysosome where proteins are degraded by luminal proteases (Odorizziet al.1998).
In conclusion, we have used the MAGIC approach combined with GWAS in the maize association panel as a powerful way to survey the maize allelic diversity to precisely map loci associated with natural variation in the HR defense response. In this way, we identified six associated loci and a set of candidate genes that appear to be involved in connected functions controlling ubiquitination and programmed cell death. These novel fi nd-ings would not have been possible using more conventional approaches such as mutational analyses or mapping of variation in the wild-type defense response.
Acknowledgments
was funded by the U.S. Department of Agriculture–Agricultural Research Service, Purdue University, and by National Science Foundation grant 0822495.
Literature Cited
Altschul, S. F., T. L. Madden, A. A. Schaffer, J. Zhang, Z. Zhanget al., 1997 Gapped BLAST and PSI-BLAST: a new generation of pro-tein database search programs. Nucleic Acids Res. 25: 3389. Andorf, C. M., C. J. Lawrence, L. C. Harper, M. L. Schaeffer, D. A.
Camp-bellet al., 2010 The Locus Lookup tool at MaizeGDB: identification of genomic regions in maize by integrating sequence information with physical and genetic maps. Bioinformatics 26: 434–436. Aravind, L., and E. V. Koonin, 2000 The U box is a modified RING
finger—a common domain in ubiquitination. Curr. Biol. 10: R132–R134.
Beere, H. M., and D. R. Green, 2001 Stress management: heat shock protein-70 and the regulation of apoptosis. Trends Cell Biol. 11: 6–10.
Bent, A. F., and D. Mackey, 2007 Elicitors, effectors, and R genes: the new paradigm and a lifetime supply of questions. Annu. Rev. Phytopathol. 45: 399–436.
Bradbury, P. J., Z. Zhang, D. E. Kroon, T. M. Casstevens, Y. Ramdoss
et al., 2007 TASSEL: software for association mapping of com-plex traits in diverse samples. Bioinformatics 23: 2633. Breseghello, F., and M. E. Sorrells, 2006 Association mapping of
kernel size and milling quality in wheat (Triticum aestivumL.) cultivars. Genetics 172: 1165–1177.
Cavanagh, C., M. Morell, I. Mackay, and W. Powell, 2008 From mutations to MAGIC: resources for gene discovery, validation and delivery in crop plants. Curr. Opin. Plant Biol. 11: 215–221. Chaikam, V., A. Negeri, R. Dhawan, B. Puchaka, J. Jiet al., 2011 Use of mutant-assisted gene identification and characterization (MAGIC) to identify novel genetic loci that modify the maize hy-persensitive response. Theor. Appl. Genet. 123: 985–997. Cheng, S.-F., Y.-P. Huang, Z.-R. Wu, C.-C. Hu, Y.-H. Hsu et al.,
2010 Identification of differentially expressed genes induced by bamboo mosaic virus infection inNicotiana benthamianaby cDNA-amplified fragment length polymorphism. BMC Plant Biol. 10: 286.
Chintamanani, S., S. H. Hulbert, G. S. Johal, and P. J. Balint-Kurti, 2010 Identification of a maize locus that modulates the hyper-sensitive defense response, using mutant-assisted gene identifi -cation and characterization. Genetics 184: 813–825.
Ciechanover, A., 1998 The ubiquitin-proteasome pathway: on protein death and cell life. EMBO J. 17: 7151–7160.
Coll, N. S., P. Epple, and J. L. Dangl, 2011 Programmed cell death in the plant immune system. Cell Death Differ. 18: 1247–1256. Collins, N., J. Drake, M. Ayliffe, Q. Sun, J. Ellis et al., 1999 Molecular characterization of the maize RP1-D rust re-sistance haplotype and its mutants. Plant Cell 11: 1365–1376. Conesa, A., S. Götz, J. M. García-Gómez, J. Terol, M. Talón et al.,
2005 Blast2GO: a universal tool for annotation, visualization and analysis in functional genomics research. Bioinformatics 21: 3674– 3676.
Conrad, D. F., M. Jakobsson, G. Coop, X. Wen, J. D. Wall et al., 2006 A worldwide survey of haplotype variation and linkage dis-equilibrium in the human genome. Nat. Genet. 38: 1251–1260. Cook, J. P., M. D. McMullen, J. B. Holland, F. Tian, P. Bradbury
et al., 2011 Genetic architecture of maize kernel composition in the nested association mapping and inbred association pan-els. Plant Physiol.
Cronjé, M. J., I. E. Weir, and L. Bornman, 2004 Salicylic acid-me-diated potentiation of Hsp70 induction correlates with reduced apoptosis in tobacco protoplasts. Cytometry A 61A: 76–87.
Darvasi, A., and M. Soller, 1995 Advanced intercross lines, an experimental population for fine genetic mapping. Genetics 141: 1199–1207.
Elshire, R. J., J. C. Glaubitz, Q. Sun, J. A. Poland, K. Kawamoto
et al., 2011 A robust, simple genotyping-by-sequencing (GBS) approach for high diversity species. PLoS ONE 6: e19379. Falush, D., M. Stephens, and J. K. Pritchard, 2007 Inference of
population structure using multilocus genotype data: dominant markers and null alleles. Mol. Ecol. Notes 7: 574–578. Flint-Garcia, S. A., A. C. Thuillet, J. M. Yu, G. Pressoir, S. M. Romero
et al., 2005 Maize association population: a high-resolution plat-form for quantitative trait locus dissection. Plant J. 44: 1054–1064. Ganal, M. W., G. Durstewitz, and A. Polley, A. L. Bérard, E. S. Buckler
et al., 2011 A large maize (Zea mays L.) SNP genotyping array: development and germplasm genotyping, and genetic mapping to compare with the B73 reference genome. PLoS ONE 6: e28334. Gerdes, J. T., and W. F. Tracy, 1993 Pedigree diversity within the Lancaster Surecrop Heterotic group of maize. Crop Sci. 33: 334–337. Green, J. M., H. Appel, E. M. Rehrig, J. Harnsomburana, J.-F. Chang
et al., 2012 PhenoPhyte: aflexible affordable method to quan-tify visual 2D phenotypes. Plant Methods 8: 45.
Hamblin, M. T., M. L. Warburton, and E. S. Buckler, 2007 Empirical comparison of simple sequence repeats and single nucleotide polymorphisms in assessment of maize diversity and relatedness. PLoS ONE 2: e1367.
Harjes, C. E., T. R. Rocheford, L. Bai, T. P. Brutnell, C. B. Kandianis
et al., 2008 Natural genetic variation in lycopene epsilon cyclase tapped for maize biofortification. Science 319: 330–333.
Hatakeyama, S., M. Matsumoto, M. Yada, and K. I. Nakayama, 2004 Interaction of U-box-type ubiquitin-protein ligases (E3s) with molecular chaperones. Genes Cells 9: 533–548.
Hill, W. G., and A. Robertson, 1968 Linkage disequilibrium in
finite populations. Theor. Appl. Genet. 38: 226–231.
Hirschhorn, J. N., and M. J. Daly, 2005 Genome-wide association studies for common diseases and complex traits. Nat. Rev. Genet. 6: 95–108.
Hu, G., T. E Richter, S. H Hulbert, and T. Pryor, 1996 Disease lesion mimicry caused by mutations in the rust resistance gene
rp1. Plant Cell 8: 1367–1376.
Hulbert, S. H., 1997 Structure and evolution of therp1complex conferring rust resistance in maize. Annu. Rev. Phytopathol. 35: 293–310.
Jelenska, J., J. A. Van Hal, and J. T. Greenberg, 2010 Pseudomonas syringaehijacks plant stress chaperone machinery for virulence. Proc. Natl. Acad. Sci. USA 107: 13177–13182.
Jennings, P., and A. J. Ullstrup, 1957 A histological study of three
Helminthosporium leaf blights on corn. Phytopathology 47: 707–714.
Johal, G. S., P. Balint-Kurti, and C. F. Well, 2008 Mining and har-nessing natural variation: a little MAGIC. Crop Sci. 48: 2066–2073. Kadota, Y., K. Shirasu, and R. Guerois, 2010 NLR sensors meet at the SGT1–HSP90 crossroad. Trends Biochem. Sci. 35: 199–207. Kang, H. M., N. A. Zaitlen, C. M. Wade, A. Kirby, D. Heckerman
et al., 2008 Efficient control of population structure in model organism association mapping. Genetics 178: 1709–1723. Kanzaki, H., H. Saitoh, A. Ito, S. Fujisawa, S. Kamoun et al.,
2003 Cytosolic HSP90 and HSP70 are essential components of INF1-mediated hypersensitive response and non-host resis-tance to Pseudomonas cichoriiinNicotiana benthamiana. Mol. Plant Pathol. 4: 383–391.
Koegl, M., T. Hoppe, S. Schlenker, H. D. Ulrich, T. U. Mayeret al., 1999 A novel ubiquitination factor, E4, is involved in multi-ubiquitin chain assembly. Cell 96: 635–644.
Littell, R. C., G. A. Milliken, W. A. Stroup, R. D. Wolfinger, and O. Schabenberger, 2006 SAS System for Mixed Models, Ed. 2. SAS Institute, Cary, N.C.
Liu, K., M. Goodman, S. Muse, J. S. Smith, E. Buckler et al., 2003 Genetic structure and diversity among maize inbred lines as inferred from DNA microsatellites. Genetics 165: 2117–2128. Liu, W., M. Gowda, J. Steinhoff, H. Maurer, T. Würschumet al., 2011 Association mapping in an elite maize breeding popula-tion. Theor. Appl. Genet. 123: 847–858.
Lu, Y., S. Zhang, T. Shah, C. Xie, Z. Haoet al., 2010 Joint linkage-linkage disequilibrium mapping is a powerful approach to de-tecting quantitative trait loci underlying drought tolerance in maize. Proc. Natl. Acad. Sci. USA 107: 19585–19590.
Marchler-Bauer, A., J. B. Anderson, P. F. Cherukuri, C. Deweese-Scott, L. Y. Geeret al., 2005 CDD: a Conserved Domain Data-base for protein classification. Nucleic Acids Res. 33: D192–D196. McMullen, M. D., S. Kresovich, H. S. Villeda, P. Bradbury, H. H. Li
et al., 2009 Genetic properties of the maize nested association mapping population. Science 325: 737–740.
Negeri, A. T., N. D. Coles, J. B. Holland, and P. J. Balint-Kurti, 2011 Mapping QTL controlling southern leaf blight resistance by joint analysis of three related recombinant inbred line pop-ulations. Crop Sci. 51: 1571–1579.
Negrutskii, B. S., and A. V. El’skaya, 1998 Eukaryotic translation elongation factor 1 alpha: structure, expression, functions, and possible role in aminoacyl-tRNA channeling. Prog. Nucleic Acid Res. Mol. Biol. 60: 47–78.
Odorizzi, G., M. Babst, and S. D. Emr, 1998 Fab1p PtdIns(3)P 5-kinase function essential for protein sorting in the multivesicular body. Cell 95: 847–858.
Parsell, D. A., and S. Lindquist, 1993 The function of heat-shock proteins in stress tolerance: degradation and reactivation of damaged proteins. Annu. Rev. Genet. 27: 437–496.
Peart, J. R., R. Lu, A. Sadanandom, I. Malcuit, P. Moffett et al., 2002 Ubiquitin ligase-associated protein SGT1 is required for host and nonhost disease resistance in plants. Proc. Natl. Acad. Sci. USA 99: 10865–10869.
Penning, B. W., G. S. Johal, and M. M. McMullen, 2004 A major suppressor of cell death,slm1, modifies the expression of the maize (Zea maysL.) lesion mimic mutation les23. Genome 47: 961–969. Pornillos, O., S. L. Alam, R. L. Rich, D. G. Myszka, D. R. Daviset al., 2002 Structure and functional interactions of the Tsg101 UEV domain. EMBO J. 21: 2397–2406.
Pritchard, J. K., M. Stephens, and P. J. Donnelly, 2000 Inference of population structure using multilocus genotype data. Genet-ics 155: 945–959.
R Development Core Team, 2008 R: A language and environment for statistical computing. R Foundation for Statistical Computing, Vienna.
Remington, D. L., and M. D. Purugganan, 2003 Candidate genes, quantitative trait loci, and functional trait evolution in plants. Int. J. Plant Sci. 164: S7–S20.
Remington, D. L., J. M. Thornsberry, Y. Matsuoka, L. M. Wilson, S. R. Whitt et al., 2001 Structure of linkage disequilibrium and phenotypic associations in the maize genome. Proc. Natl. Acad. Sci. USA 98: 11479–11484.
SAS Institute Inc. 2000–2004 SAS 9.2 Help and Documentation. SAS, Cary, NC.
Schnable, P. S., D. Ware, R. S. Fulton, J. C. Stein, F. Weiet al., 2009 The B73 maize genome: complexity, diversity, and dy-namics. Science 326: 1112–1115.
Shaner, G., and P. E. Finney, 1977 The effect of nitrogen fertilizer on expression of slow mildewing resistance in Knox wheat. Phy-topathology 67: 1051–1056.
Smith, S., M. Steinau, H. Trick, and S. Hulbert, 2010 Recom-binantRp1genes confer necrotic or nonspecific resistance phe-notypes. Mol. Genet. Genomics 283: 591–602.
Spitzer, C., S. Schellmann, A. Sabovljevic, M. Shahriari, C. Kesha-vaiah et al., 2006 The Arabidopsis elch mutant reveals func-tions of an ESCRT component in cytokinesis. Development 133: 4679–4689.
Storey, J. D., and R. Tibshirani, 2003 Statistical significance for genomewide studies. Proc. Natl. Acad. Sci. USA 100: 9440– 9445.
Sudupak, M. A., J. L. Bennetzen, and S. H. Hulbert, 1993 Unequal exchange and meiotic instability of disease-resistance genes in the Rp1 region of maize. Genetics 133: 119–125.
Szalma, S., E. Buckler, M. Snook, and M. McMullen, 2005 Asso-ciation analysis of candidate genes for maysin and chlorogenic acid accumulation in maize silks. Theor. Appl. Genet. 110: 1324–1333.
Talapatra, S., J. D. Wagner, and C. B. Thompson, 2002 Elongation factor-1 alpha is a selective regulator of growth factor with-drawal and ER stress-induced apoptosis. Cell Death Differ. 9: 856–861.
Teo, H., D. B. Veprintsev, and R. L. Williams, 2004 Structural insights into endosomal sorting complex required for transport (ESCRT-I) recognition of ubiquitinated proteins. J. Biol. Chem. 279: 28689–28696.
Thornsberry, J. M., M. M. Goodman, J. Doebley, S. Kresovich, D. Nielsenet al., 2001 Dwarf8 polymorphisms associate with var-iation inflowering time. Nat. Genet. 28: 286–289.
Uetsuki, T., A. Naito, S. Nagata, and Y. Kaziro, 1989 Isolation and characterization of the human chromosomal gene for polypep-tide chain elongation factor-1 alpha. J. Biol. Chem. 264: 5791– 5798.
Van Inghelandt, D., J. Reif, B. Dhillon, P. Flament, and A. Mel-chinger, 2011 Extent and genome-wide distribution of linkage disequilibrium in commercial maize germplasm. Theor. Appl. Genet. 123: 11–20.
VanRaden, P. M., 2008 Efficient methods to compute genomic predictions. J. Dairy Sci. 91: 4414–4423.
Wilson, L. M., S. R. Whitt, A. M. Ibanez, T. R. Rocheford, M. M. Goodmanet al., 2004 Dissection of maize kernel composition and starch production by candidate gene association. Plant Cell 16: 2719–2733.
Wisser, R. J., J. M. Kolkman, M. E. Patzoldt, J. B. Holland, J. Yu
et al., 2011 Multivariate analysis of maize disease resistances suggests a pleiotropic genetic basis and implicates a GST gene. Proc. Natl. Acad. Sci. USA 108: 7339–7344.
Yan, J., T. Shah, M. L. Warburton, E. S. Buckler, M. D. McMullen
et al., 2009 Genetic characterization and linkage disequilib-rium estimation of a global maize collection using SNP markers. PLoS ONE 4: e8451.
Yan, J., M. Warburton, and J. Crouch, 2011 Association mapping for enhancing maize (Zea mays L.) genetic improvement. Crop Sci. 51: 433–449.
Yu, J., and E. S. Buckler, 2006 Genetic association mapping and ge-nome organization of maize. Curr. Opin. Biotechnol. 17: 155–160. Yu, J. M., G. Pressoir, W. H. Briggs, I. V. Bi, M. Yamasakiet al., 2006 A unified mixed-model method for association mapping that accounts for multiple levels of relatedness. Nat. Genet. 38: 203–208. Yu, L.-X., A. Lorenz, J. Rutkoski, R. Singh, S. Bhavani et al.,
2011 Association mapping and gene–gene interaction for stem rust resistance in CIMMYT spring wheat germplasm. Theor. Appl. Genet. 123: 1257–1268.
Zhang, Z., E. S. Buckler, T. M. Casstevens, and P. J. Bradbury, 2009 Software engineering the mixed model for genome-wide as-sociation studies on large samples. Briefings Bioinform. 10: 664–675. Zhang, Z., Z. Zhang, E. Ersoz, C.-Q. Lai, R. J. Todhunter et al., 2010 Mixed linear model approach adapted for genome-wide association studies. Nat. Genet. 42: 355–360.
GENETICS
Supporting Information http://www.genetics.org/lookup/suppl/doi:10.1534/genetics.112.147595/-/DC1
A Connected Set of Genes Associated with
Programmed Cell Death Implicated in Controlling
the Hypersensitive Response in Maize
Bode A. Olukolu, Adisu Negeri, Rahul Dhawan, Bala P. Venkata, Pankaj Sharma, Anshu Garg, Emma Gachomo, Sandeep Marla, Kevin Chu, Anna Hasan, Jiabing Ji, Satya Chintamanani, Jason Green, Chi-Ren Shyu, Randall Wisser, James Holland, Guri Johal, and Peter Balint-Kurti
Figure S1 Examples of segregation of F1 families from a) Ki3 x Rp1-‐D21-‐H95 and b) Tx303 x Rp1-‐D21-‐H95. Taller individuals are
wild-‐type siblings. Black arrows indicate some of the F1 plants heterozygous for Rp1-‐D21. Insets show details of leaves of plants
Figure S3 Estimating the false discovery rate for SNP marker association with HTR: (a) A density histogram showing p-‐value distribution of 44,520 SNP markers following genome-‐wide association analysis. (b) The q-‐values plotted against their
respective p-‐values. (c) The number of SNPs plotted against each of the respective q-‐value estimates. (d) The expected number of false positive SNPs versus the total number of significant SNPs given by the q-‐values.
d
c
Figure S4 Estimating the false discovery rate for SNP marker association with LES: (a) A density histogram showing p-‐value distribution of 47,253 SNP markers following genome-‐wide association analysis. (b) The q-‐values plotted against their
respective p-‐values. (c) The number of SNPs plotted against each of the respective q-‐value estimates. (d) The expected number of false positive SNPs versus the total number of significant SNPs given by the q-‐values.
c
b
a
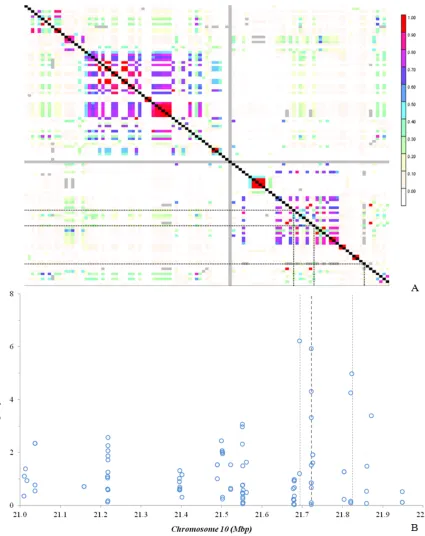
Figure S5 (A) LD heatmap above showing LD measure (r2) calculated (for each pairwise comparison of SNPs (colors red to
white correspond to 1 to 0 r2 values, while black diagonal compares the same SNP to itself) within a chromosome 10 genomic
region (21 – 22 mbp) containing 3 significantly associated SNPs indicated by dashed lines (21,693,685 bp, 21,722,883 bp and 21,823,409 bp). (B) Chart with markers indicating –log10 of p-‐values of SNPs following genome-‐wide association analysis with HTR (mutant-‐to-‐wildtype height ratio).
Files S1-‐S10
Supporting data
Available for download as at http://www.genetics.org/lookup/suppl/doi:10.1534/genetics.112.147595/-‐/DC1.
File S1 Least square means of phenotypic data (LES) computed from raw data over 2 environments and 2 years.
File S2 Least square means of phenotypic data (HTR) computed from raw data over 2 environments and 2 years.
File S3 Genotype based on the Illumina maize 50k array. Only homozygous genotypes included in data set.
File S4 Genotype_pop structure_STRUCTURE format.txt: contains 5,000 SNP genotypes (heterozygous and homozygous) with no missing data. Formatted for analysis in STRUCTURE software.
File S5 Genotype_kinship matrix_Tassel format.txt: contains 4,000 SNP genotypes (only homozygous) with no missing data. Formatted for analysis in Tassel software.
File S6 Matrix of pairwise relatedness between lines.
File S7 SNP genotypes based genotyping-‐by-‐sequencing (GBS). Only SNPs on chromsome 5 and within aproximately 2 Mbp window around candidate SNP are included.
File S8 SNP genotypes based genotyping-‐by-‐sequencing (GBS). Only SNPs on chromsome 7 and within aproximately 2 Mbp window around candidate SNP are included.
File S9 SNP genotypes based genotyping-‐by-‐sequencing (GBS). Only SNPs on chromsome 9 and within aproximately 2 Mbp window around candidate SNP are included.
File S10 SNP genotypes based genotyping-‐by-‐sequencing (GBS). Only SNPs on chromsome 10 and within aproximately 2 Mbp window around candidate SNPs are included.