DOI:
IM
F
Ka Abstr findin alway for a on th accur Keyw 1. IN N Gene analy vario exist regu disco simil clust In c simil for dista alwa appr the s netw activ of E corre and studi 2. RE T of v over learn addit it is diffe they that metr diffe : http://dx.doi.MPACT O
FUZZY C
Depart avikulguru Ins Dract: Data clu ng regularities ys perform bett given dataset i he performance racy of the algo
words: data min
NTRODUCTI
Now-a-days d erated data is ysis of such ous supervised t for this purp
larity or simil over in what
lar or differ tering is popu clustering da larity measur similarity me ance, Chebysh ays remain qu ropriate. In thi student’s inte working, intern vities for cour
Euclidian dis elation coeffic Fuzzy C-Mea ied and presen
ELATED WO
This section re arious distanc rlap metric. In ning are most
tional informa a rough meas erence metric.
have more si value differe ric. Daniel T erence measu .org/10.26483/
Interna
F DISTA
C-MEAN
PERF
V.P. Matment of Com stitute of Tech Dist:Nagpur,
stering has man in the data obj ter. Distance me is a great challe of k-means and orithm. This stu
ning; k-means c
ION
data is incre s of high dim
data is very d and unsuper pose. In data m
larity is carryi way data ar rent. Among ularly being us ata objects a e. Most comm easure are Eu
hev distance, uestion in min is research, st erest in use o net surfing for se studies. In stance, Manh cient on the pe
ans (FCM) cl nted.
ORK
eviewed earlie ce metrics. A nstance based l
tly used over ation given by sure. Standfill It is presum imilar classifi ence metric is Tunkelang et ure specifica /ijarcs.v9i1.541
Volu
ational Jou
Av
ANCE ME
S CLUST
FORMAN
ahatme mputer Techno hnology & Sci (MS), Indiany applications jects. Mostly d etric does not e enge. In this pap
d fuzzy c-mean udy helps the res
lustering; fuzzy
easing in ex mensionality. A much impor rvised data mi mining techniq
ing attention o re interrelated
various dat sed to get the are grouped
monly used d uclidian dista , Minkowski nd that which tudy is carried of programmi
r casual usage the present p hattan distanc erformance of lustering algor
er work in clu Aha K. D. et. learning and l rlap metric. I y nominal attri l C. et. al.[2] med that attribu cations. Their s more preci t.al.[3] showe ally for ca
17
ume 9, No.
urnal of Ad
RESE
vailable On
ETRICS O
TERING
NCE IN E
ology
ience, Ramtek
s in the various distance based exhibit well in c per, impact of t ns clustering is p
searchers to tak
y c-means clust
xponential ra Appropriate da
rtant. There a ining techniqu ques, concept of researchers d, how they a
a mining ta e insight of da
together usi distance metr ance, Manhatt
distance. It h metric is mo d out to analy ing tools, soc e and e-learni aper, the impa ce and Pears f K-Means (KM
rithms has be
ustering and us al.[1] describ locally weight It does not u ibute values. S proposed val ute are closer r results show se than overl ed data driv ategorical da
1, January
dvanced Re
EARCH PA
nline at ww
ON THE P
– AN APP
E-LEARN
k,
s research areas metrics are use capturing correl
three different m presented. In cl ke quick decisio
tering; distance ate. ata are ues of to are sk, ata. ing rics tan is ore yze cial ing act son M) een ses bed ted use So, lue r if wed lap ven ata. D fr th th ac of G an at U ba Li Se in D se m cl al de Pe lin ex of M co pr N Eu N an al te cl co
y-February
esearch in C
APER
ww.ijarcs.in
PERFOR
PROACH
NING ENV
Depa Yeshwa Ns. In clustering ed as similarity lations among t metrics Euclide lustering, detect on about choice
metrics; e-learn
Difference bet equency of th hat data object here is no clus cross all probl f clustering, it Generally, algo nd favor some ttributes review UCI datasets of
ased on attribu i [6] used a elective Val nvestigated the Difference Met election metho metrics Euclidi lustering meth ll three metric epends on t erformance o nkage and a xamined by K f clustering t Manhattan, M orrelation dis resented the im Nearest Neighb uclidean dista Neighbor cluste nd correlation l.[10] review echniques and lustering tech ombination mo
y 2018
Computer
nfo
RMANCE
H TO ASS
VIRONM
Dr. K.K
artment of Inf antrao Chavan Nagpur, Dist:N
algorithm, dis y measures in c the data objects ean, Manhattan tion of similarit e of metric for c
ning
tween two d he categories ts have in com stering algorit lems. Further, t is difficult to orithms are de e type of biase
wed by Chao f Weka platfor ute weighting attribute selec lue Differen e attribute ind tric and then p ods for SVDM ian, Manhattan hod. They obt cs. They sugge
the complex of six distanc
average linka Kumar V.et.al.
they referred Mahalanobis, c stance metri mpact of four bor clustering ance function
ering approac distance mea wed variou d expressed t hniques. To odel of cluster
Science
ISSNE OF K-M
SESS STU
MENT
K. Bhoyar
formation Tec n College of E Nagpur, (MS),
stance metrics i clustering. Dist s. Choosing the n and Pearson c
ty using distanc clustering.
data objects or combinat mmon. Xu R thm that can b
they claimed o say that it is esigned with c es. Distance m oqm Li. et. al.
rm and sugge and attribute ction approac nce Metric dependence as
presented two M. Peter Grab n and correlat tained similar ested that acc xity of task
ce metrics o age clusterin . [8]. To asses
Euclidean, E cosine simila
cs. Anil ku r similarity m g. Their ana
works best w ch in contrast asures function us distance the limitation
overcome th ring.
N No. 0976-56
MEANS A
UDENT’S
hnology Engineering,
India
is a key constit tance metrics d
right distance m orrelation coeff ce metrics affec
depends on tions of categ . [4] reviewed be commonly d that in the co
the best cluste certain assump metrics for nom
.[5]. They use ested improvem
selection. Cha ch and sugg
(SVDM). ssumption of V o effective attr
busts[7] used tion in hierarc result by app curacy of algo k and data
on k-means, s ng algorithms ss the perform Euclidean squ arity and Pe umar Patidar measures on Sh
alysis showed with Shared Ne
to cosine, Ja n. Jasmine Ira based clust ns of the ex his they prop
3. DATA MINING
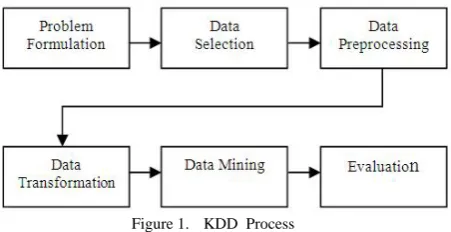
[image:2.595.51.277.157.273.2]Data mining process helps to automatically understand process and summarize high dimensional data. This extract novel, valid, useful knowledge patterns from large data sets [11]. In fact, data mining is one step in the process of Knowledge Discovery from Database (KDD). KDD process is given in figure 1.
Figure 1. KDD Process
Following steps are required for KDD process.
Data selection: In this step, relevant information from database is selected.
Data pre-processing: This is the process of identification and elimination of missing, inaccurate, noisy and duplicate data value from the data set.
Data transformation: In this process, data are transformed into correct form to perform different operations like summary, aggregation, generalization and normalized operation.
Data mining: It is a technique through which various descriptive and predictive operations perform on the data to extract the hidden knowledge.
Evaluation: In this step, extracted knowledge is evaluated.
There are two types of goals for in data mining process. A. Descriptive Mining
Descriptive mining recognize the relationship or dependencies among the data objects.
B. Predictive Mining
Predictive mining creates a model of future behavior based on the current available data.
4. DATA CLUSTERING
Data clustering discover semantically meaningful group of data objects. Given a dataset, clustering divide data objects based on similarity measures which follow two important criterions that the similarity between any two data objects within a group is maximized and the similarity between any two data objects within any two groups is minimized. Clustering is used by the researchers of any domain who wish to process data. Domain varies from social studies, engineering, computing, medical and so on. Data clustering is also called as Q-analysis, clumping and taxonomy depending on the domain where it is used [12]. Clustering roughly categorized into two groups viz. partition clustering and hierarchical clustering. Partition clustering algorithm partitioned data into appropriate clusters whereas hierarchical clustering is recursively finds nested clusters. Hierarchical
clustering either works in bottom-up or in top-down manner which is called as agglomerative or divisive algorithm respectively. The most popular and the simplest partition algorithm is k-mean clustering. It is a simple, scalable, easily understandable and can be adopted to deal with high dimensional data. It is unsupervised learning, used when data is unlabeled.
C. K-means clustering
It is a partition based clustering method. Basic intension of this is to categorize given data set into k clusters. Given algorithm shows the process of k-means clustering. It follows iterative refinement method. The process starts with randomly generated initial kcentroids from the data set then iterates between two steps: ‘Data assignment’ and ‘Centroids update ’.
Data assignment: Each centroid defines one of the clusters. Based on the distance function data objects are assigned to its nearest centroid.
Centroid update: Centroids are recalculated by taking the mean of all data objects assigned to the respective centroid's cluster.
The algorithm iterates between these two steps until convergence criteria is met. Convergence criteria may be one of the following.
No data object change clusters.
Sum of the distances is minimized.
Maximum number of iterations is reached.
Algorithm
1. Initialization of number of clusters. 2. Initialization of cluster centers. 3. Repeat
Assign each item to the cluster which has the closest centroid;
Calculate new mean for each cluster; Until convergence criteria is met.
D. Fuzzy c-means clustering
In machine learning, blending of fuzzy logic and data mining is extensively used. Non-unique partitioning of the data objects in cluster formation is the key in fuzzy clustering. Data objects are assigned with a membership value for each of the clusters. It designates the proximity of the data object to a particular cluster. It is the most popular classical fuzzy clustering technique. Major domains such as image analysis, medical diagnosis, astronomy, chemistry and agricultural where fuzzy c-means clustering are widely used [13]. Fuzzy c-means clustering has two phases. In the first phase, cluster centers are calculated and in the second phase data objects are assigned to these clusters using a membership value as distance measure. This process repeats until the cluster centers become stable. For each data object, there is a coefficient that specifies the membership degree (µij) of being in the kth cluster as follows.
∑
Where,
The presence of a data object in multiple cluster depends on the fuzzification value say ‘m’ which is defined by the user in the range of [0,1]. It decides the fuzzy membership degree in the cluster. Data object which is on the boundary of cluster might be in that cluster with lesser membership degree than other data object in the center of the cluster [14][15]. Whenever ‘m’ reaches the value of 1 the algorithm works like a crisp partitioning algorithm. The principle goal of fuzzy clustering algorithm is to segment the data objects into clusters so that the intra-cluster similarity of data objects is boosted and the inter-cluster similarity of data objects is minimized.
Algorithm
1. Initialize number of clusters. 2. Initialize fuzzification parameter. 3. Initialize cluster centers.
4. Repeat
Update membership of data point,
Update center of the cluster with current membership of data point,
Until cluster centers estimate stabilize.
5. NEED OF DISTANCE METRICS IN CLUSTERING
Clustering is based on a similarity measure to group data objects together [16]. Similarity is a standard unit to express closeness of two data objects. Distance metric is a most widely used technique to quantify the similarity among the data objects. Distance metric specifies how the distance between two data objects is measured. In many of the applications, Euclidean distance, Manhattan distance, Minkowski distance are used. K-means clustering and fuzzy c-means clustering are unsupervised learning. Clustering results of these algorithms may be affected by several parameters such as algorithm initialization, distance metric, data size and so on. So, it is worth to evaluate the impact of distance metrics on k-means and fuzzy c-means algorithms in clustering data. This paper is aimed to analyze the impact distance metrics such as Euclidean distance, Manhattan distance and Pearson correlation coefficient in k-means and fuzzy c-means clustering algorithms. Various distance metrics are reviewed below.
Euclidean distance: In clustering task, Euclidean distance is commonly used. Basically, it is geometrical distance between two points. The Euclidean distance calculates the root of square differences between the coordinates of objects pair [9]. It is shown in equation 2.
∑
Manhattan distance: Manhattan distance calculates the absolute differences between coordinates of objects pair [10]. It is shown in equation 3.
Chebyshev distance: Chebyshev distance is maximum
value distance. This compute the absolute magnitude of the differences between coordinate of objects pair [10] as given in equation 4.
Minkowski distance: Minkowski distance is generalized distance metric [10]. It is given in equation 5.
∑
When p=2, the distance becomes the Euclidean distance. When p=1 it becomes Manhattan distance.
Pearson correlation coefficient: This distance depends on the Pearson correlation coefficient. This is calculated from the sample values and their standard deviations. It shows the closeness between two continuous variables [17]. The correlation coefficient 'r' takes values from +1 to -1. It is given in equation 6. A value of 0 indicates that there is no association between the two variables. A value greater than 0 indicates a positive association. Effectively, Pearson distance ‘dp’ is computed as dp = 1 - r as shown in equation 7. It lies between 0 and 2. 0 when correlation coefficient is +1, i.e. the two samples are most similar and 2 when correlation coefficient is -1[7].
∑
∑ ∑
, 1
6. EXPERIMENTAL DESIGN
Proposed work involved application of data mining technique specifically K-Means (KM) and Fuzzy C-Means (FCM) clustering and to study the impact of distance metrics on the performance of these algorithms. Experimentation is carried out which include following steps.
E. Data Gathering
In this experiment, data set consists of review questions for illustration purpose. There were 28 questions in the data set which were attempted by 54 students. Questions were set to finds the student’s interest in the various activities such as social networking, use of programming tools, internet surfing for casual usage and referring e-learning resources for course study. Questions were of multiple choice and text formatted. If student response to question is positive, then it was graded by 1. It is 0 otherwise. If student didn’t answer the question then it was graded by 0. All required data for this research work is collected from Moodle log file through Moodle server. Collected log data was used for preprocessing. Basically, intension of the preprocessing is to cleanse the data and to transform it into a suitable form so that it will be used in later stages. Preprocessed data set consist of questions and student’s response.
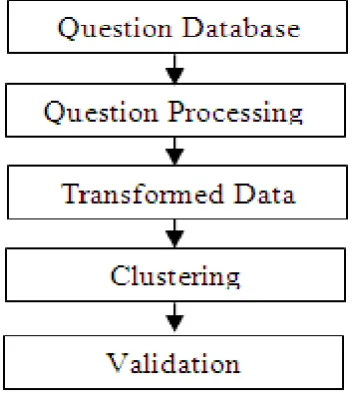
F. Methodology
before clustering, Later it must be transformed into a simpler form which acts as an input to the clustering algorithm [18][19]. Clustering algorithm have tendency to discover natural grouping of data objects based on some similarity. It also finds the centroid of a group of data objects. Data clustering has been used mainly for three purposes: underlying structure, natural classification and compression. Later, clustering result is validated by identifying correctness of the clusters.
Figure 2. Proposed Methodology
7. EXPERIMENTAL RESULTS
The purpose of the experiment was to test the performance of the KM and FCM clustering algorithms by applying three different metrics. Euclidean distance, Manhattan distance and Pearson correlation coefficient have been selected as metrics. Preprocessed data set was grouped into four clusters by applying KM and FCM clustering with three different distance metrics. Basically, in this research, student’s interest in social networking, programming tools, internet surfing for casual usage and referring e-learning resources for course study have been considered. Clustering result and group of students in each cluster with k-means are shown in tables 1, 2, 3 and with fuzzy c-means shown in table 4, 5, 6.
Table I. K-means Clustering with Euclidian Distance Cluster Dimension’s Centroid No. of
students
Programming tools
Social networkin
g
Internet surffing for casual usage
E-learning activities for course
study
C1 0.669 0.80 0.60 0.286 14
C2 0.642 0.64 1.00 0.453 20
C3 0.902 0.94 0.98 0.649 10
[image:4.595.310.565.65.307.2]C4 0.646 0.91 0.82 0.771 10
Table II. K-Means Clustering with Manhatton Distance Cluster Dimension’s centroid No. of
Programming tools
Social networkin
g
Internet surffing for casual usage
E-learning activities for course
study
students
C1 0.818 0.952 1.00 0.704 14
C2 0.643 0.636 1.00 0.428 22
C3 0.569 0.733 0.45 0.285 05
C4 0.723 0.846 0.75 0.571 13
Table III. K-means Clustering with Pearson Correlation Coefficient Cluster Dimension’s centroid No. of students
Programmin g tools
Social networkin
g
Internet surffing for casual
usage E-learnin
g activitie
s for course
study
C1 0.825 0.889 0.82 0.457 15
C2 0.678 0.575 0.97 0.467 22
C3 0.607 1.00 0.82 0.449 10
[image:4.595.78.255.169.373.2]C4 0.637 0.857 0.89 0.857 07
Table IV. FCM Clustering with Euclidian Distance Cluster Dimension’s centroid No. of
student s Programming
tools
Social networkin
g
Internet surffing for casual usage
E-learning activities for course
study
C1 0.669 0.80 0.60 0.286 10
C2 0.642 0.64 1.00 0.453 23
C3 0.902 0.94 0.98 0.649 11
C4 0.646 0.91 0.82 0.771 10
Table V. FCM Clustering with Manhatton Distance Cluster Dimension’s centroid No. of
students Programming
tools
Social networkin
g
Internet surffin
g for casual
usage E-learning activities
for course
study
C1 0.572 0.67 1.00 0.412 16
C2 0.603 0.73 0.50 0.286 06
C3 0.838 0.80 0.94 0.514 20
C4 0.692 0.92 0.85 0.798 12
Table VI. FCM Clustering with Pearson Correlation Coefficient Cluster Dimension’s centroid No. of
[image:4.595.310.563.411.566.2]Programming tools
Social networking
Internet surffin
g for casual usage
E-learning activities
for course
study
C1 0.604 0.976 0.91 0.612 14
C2 0.636 0.515 0.89 0.662 11
C3 0.722 0.641 1.00 0.385 13
C4 0.813 0.896 0.78 0.455 16
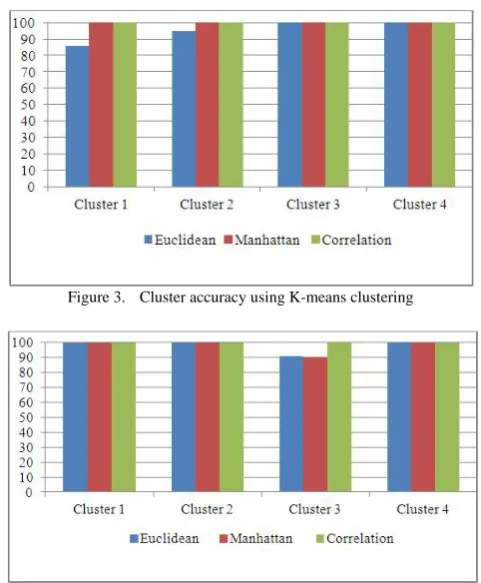
[image:5.595.29.289.54.187.2]Result shows that grouping of students varies with different distance metric in both K-means and FCM clustering. In the presented work, to see the impact of metrics, correctness of four clusters has been analyzed. Cluster correctness using K-means algorithm is shown in table 7 and depicted in figure 3. Result shows that data set are correctly classified in four clusters using Manhattan and Pearson correlation coefficient distance metric. Whereas with Euclidian distance, cluster 3 and cluster 4 are correctly classified but correctness of cluster 1 and cluster 2 using Euclidian distance is 85.71% and 95% respectively. Further, cluster correctness using Fuzzy c-means clustering algorithm is shown in table 8 and depicted in figure 4. It shows that in FCM, data set is correctly classified in four clusters using Pearson correlation coefficient distance metric. Whereas with Euclidian distance cluster 1, cluster 2, cluster 4 are correctly classified and correctness of cluster 3 is 90.9 %.With Manhattan distance, cluster 1, cluster 2, cluster 4 are correctly classified and correctness of cluster 3 is 90 %. From this, it is concluded that Pearson correlation coefficient distance metric performs best in both K-means and Fuzzy c-means clustering algorithms compared to other two distance
[image:5.595.317.558.109.401.2]metrics. Traditionally Euclidian metric is being used but choice of the Pearson correlation coefficient distance metric proved to be better.
Figure 3. Cluster accuracy using K-means clustering
[image:5.595.106.490.466.789.2] [image:5.595.106.490.468.783.2]Figure 4. Cluster accuracy using Fuzzy c-means clustering
Table VII. Potentiality of Distance Metric in K-Means Clustering
Euclidean Manhattan Pearson correlation
coefficient
Cluster 1 Contains
Records from cluster 1 =12 Records from cluster 2=1 Records from cluster 3=0 Records from cluster 4=1
Records from cluster 1=14 Records from cluster 2=0 Records from cluster 3=0 Records from cluster 4=0
Records from cluster 1=15 Records from cluster 2=0 Records from cluster 3=0 Records from cluster 4=0
Cluster 2 Contains
Records from cluster 1=1 Records from cluster 2=19 Records from cluster 3=0 Records from cluster 4=0
Records from cluster 1=0 Records from cluster 2=22 Records from cluster 3=0 Records from cluster 4=0
Records from cluster 1=0 Records from cluster 2=22 Records from cluster 3=0 Records from cluster 4=0
Cluster 3 Contains
Records from cluster 1=0 Records from cluster 2=0 Records from cluster 3=10 Records from cluster 4=0
Records from cluster 1= 0 Records from cluster 2= 0 Records from cluster 3= 5 Records from cluster 4= 0
Records from cluster 1=0 Records from cluster 2=0 Records from cluster 3=10 Records from cluster 4=0
Cluster 4 Contains
Records from cluster 1=0 Records from cluster 2=0 Records from cluster 3=0 Records from cluster 2=10
Records from cluster 1=0 Records from cluster 2=0 Records from cluster 3=0 Records from cluster 4=13
Records from cluster 1=0 Records from cluster 2=0 Records from cluster 3=0 Records from cluster 4=7
Correctness
Cluster 1 = 85.71% Cluster 2 = 95% Cluster 3 = 100% Cluster 4 = 100%
Cluster 1 = 100% Cluster 2 = 100% Cluster 3 = 100% Cluster 4 = 100%
Cluster 1 =100% Cluster 2 =100% Cluster 3 =100% Cluster 4 =100%
Table VIII. Potentiality of Distance Metric in Fuzzy C-means Clustering
Euclidean Manhattan Pearson correlation coefficient
Cluster 1 Contains
Records from cluster 1 =10 Records from cluster 2=0 Records from cluster 3=0 Records from cluster 4=0
Records from cluster 1=16 Records from cluster 2=0 Records from cluster 3=0 Records from cluster 4=0
Records from cluster 1=14 Records from cluster 2=0 Records from cluster 3=0 Records from cluster 4=0
Cluster 2 Contains
Records from cluster 1=0 Records from cluster 2=23 Records from cluster 3=0 Records from cluster 4=0
Records from cluster 1=0 Records from cluster 2=6 Records from cluster 3=0 Records from cluster 4=0
Cluster 3 Contains
Records from cluster 1=0 Records from cluster 2=1 Records from cluster 3=10 Records from cluster 4=0
Records from cluster 1= 2 Records from cluster 2= 0 Records from cluster 3= 18 Records from cluster 4= 0
Records from cluster 1=0 Records from cluster 2=0 Records from cluster 3=13 Records from cluster 4=0
Cluster 4 Contains
Records from cluster 1=0 Records from cluster 2=0 Records from cluster 3=0 Records from cluster 2=10
Records from cluster 1=0 Records from cluster 2=0 Records from cluster 3=0 Records from cluster 4=12
Records from cluster 1=0 Records from cluster 2=0 Records from cluster 3=0 Records from cluster 4=16
Correctness
Cluster 1 = 100% Cluster 2 = 100% Cluster 3 = 90.9% Cluster 4 = 100%
Cluster 1 = 100% Cluster 2 = 100% Cluster 3 = 90% Cluster 4 = 100%
Cluster 1 =100% Cluster 2 =100% Cluster 3 =100% Cluster 4 =100%
8. CONCLUSION
In clustering algorithms, distance metric plays significant role. For a given dataset, choice of correct distance metric is an exigent task. In this research, study is carried out to analyze the student’s interest in use of programming tools, social networking, internet surfing for casual usage and e-learning activities for course studies. In this paper, the impact of three distance metrics viz. Euclidean, Manhattan and Pearson correlation coefficient on two different clustering algorithms namely K-means and Fuzzy c-means clustering were investigated. Distance based similarity measures are generally used in clustering and Euclidean distance in particular. K-means clustering with Euclidian distance is popularly used combination. Distance metrics are not always proving as a good option. It does not perform well to capture correlations among the data objects. Through this experiment, the impact of distance metrics on clustering algorithms is analyzed. It is observed that Pearson correlation coefficient metric forms more coherent clusters. With this study, it is concluded that the Pearson correlation coefficient works better than Euclidean distance and Manhattan distance metrics. This study helps the researchers to analyze the impact of distance metrics on clustering algorithms and to take decision about preference of metric for clustering.
REFERENCES
[1] K. D. Aha, D. and M. K. Albert, “Instance-based learning algorithms,”Machine Learning, vol. 6, pp. 37–66, 1991.
[2] R. D. Short and K. Fukunaga, “A new nearest neighbor distance measure,” Proc. of the 5th IEEE Conf. on Pattern Recognition, pp. 81–86, 1990.
[3] T. Daniel and T. E. Daniel, “Making the nearest neighbor meaningful,” Proc. of Workshop on Clustering High Dimensional Data and its Applications, 2002.
[4] R. Xu and D. Wunsch, “Survey of clustering algorithms,” IEEE Transaction Neural Networks, vol. 16, no. 3, pp. 645– 678 , 2005.
[5] Chaoqun Li and Hongwei Li, “A Survey of Distance Metrics for Nominal Attributes,” Journal of Software, vol. 5, no. 11, pp. 1262-1269, 2010.
[6] Chaoqun Li, Hongwei Li, “Selective Value Difference Metric,”Journal of Computers, vol. 8, no. 9,. pp. 2232-2238, 2013.
[7] Peter Grabusts “The choice of metrics for clustering algorithms,”8th International Scientific and Practical Conference, vol.2, 2011.
[8] Kumar V., Chhabra J.K., Kumar D., “Impact of distance measures on the performance of clustering algorithms,” Intelligent Computing, Networking, and Informatics, Advances in Intelligent Systems and Computing, vol. 243, Springer, 2014.
[9] Anil Kumar Patidar , Jitendra Agrawal , Nishchol Mishra, “Analysis of different similarity measure functions and their impacts on shared nearest neighbor clustering approach,” International Journal of Computer Applications, vol. no.16, 2012.
[10] Jasmine Irani, Nitin Pise and Madhura Phatak, “Clustering techniques and the similarity measures used in clustering: a
survey,” International Journal of Computer
Applications vol.134, no. 7, pp. 9-14, 2016.
[11] J. Han and M. Kamber, Data mining: concepts and techniques, second edition, San Francisco, CA, USA: Morgan Kaufmann; Boston, MA,USA: Elsevier, 2006.
[12] Anil K.Jain, “Data clustering: 50 years beyond k-means,” Pattern Recognition Letters, vol. 31, no.8, pp. 651-666, 2010.
[13] Ali, Ameer M., Karmakar, Gour C. and Dooley, Laurence S., “Review on fuzzy clustering algorithms,”Journal of Advanced Computations, vol.2, no.3, pp. 169–181, 2008.
[14] Yinghua Lu, TinghuaiMa, Changhong Yin, Xiaoyu Xie, Wei Tian and ShuiMing Zhong, “Implementation of the fuzzy c-means clustering algorithm in meteorological data,” International Journal of Database Theory and Application vol.6, no.6 , pp.1-18, 2013.
[15] Nikhil R. Pal, Kuhu Pal, James M. Keller, and James C. Bezdek, “A Possibilistic fuzzy c-means clustering algorithm,” IEEE Transactions on Fuzzy Systems, vol.13, no. 4, pp.517-530, 2005.
[16] Yung-Shen Lin, Jung-Yi Jiang and Shie-Jue Lee, “A Similarity measure for text classification and clustering,”IEEE Transactions on Knowledge and Data Engineering, 2014.
[17] I. M. Hanafy, A. A. Salama, K. M. Mahfouz, “Correlation Coefficients of Neutrosophic Sets by Centroid Method,” International Journal of Probability and Statistics, vol. 2, no.1, pp.9-12. 2013.
[18] V. P. Mahatme, K. K. Bhoyar, “Data Mining with Fuzzy Method Towards Intelligent Questions Categorization in E-Learning,” 8th International Conference on Computational Intelligence and Communication Networks, pp. 682-687, 2016.