International Conference “
INTELINC 18
”, 12
& 13
October 2018
Molecular Spectroscopic Study On Binding Of
Quercetin To Egg Albumin In CTAB
S.Bakkialakshmi & V.Barani
Department of Physics, Annamalai University, Annamalai nagar, Tamilnadu, India.
E-mail: [email protected]
Abstract- Steady – state and time – resolved fluorescence spectroscopy techniques were used to study the interaction of the flavonoid, quercetin [QCT] with egg albumin (EA) in different concentrations of cationic (Cetyl trimethyl ammonium bromide (CTAB) micelle. The binding constant and the binding site have been calculated. Micelle parameters such as aggregation number (Nagg), Radius of micelle (Ro), Head group area (ao) and critical aggregation parameter (ρ) have been calculated. To conform the complex formation, UV absorption spectra, FTIR spectra and SEM analysis have also been carried out.
Key words- Cetyl trimethyl ammonium bromide, Egg albumin, Quercetin, Fluorescence, FTIR.
1.INTRODUCTION
Flavonoids are a large class of naturally occurring polyphenols widely distributed in plants. Being both dietary and biologically active compounds, flavonoids have attracted much attention as investigators as potent species capable of affecting various biological process in living organism. It has been recognized that flavonoids display anticancer, antiviral, anti-inflammatory, and heart disease protective activities [1,2]. They are able to modulate various enzymes [3,4]. These highly potent biological activities of flavonoids are thought to result from their antioxidant and free radical scavenging properties. Flavonoids are also capable of chelating transition and noble metal ions what may result in enhancing their anti-inflammtory and anti – oxidant properties [5].
Quercetin (QCT) is a member of flavonoids, which are ubiquitous phenolic secondary metabolites found in plants, flowers, and plant derived foods [6]. The basic structure of flavonoids (Fig. 1) is usually characterized by three rings. They are two aromatic rings (A and B) which are joined by a three – carbon linked pyrone ring (C), forming a C6 – C3 – C6 skeleton unit where side group is usually hydroxyl, methoxyl or glycosyl. Abundant in the human diet, QCT posses various biological and biochemical effects including anti-inflammatory, antineoplastic and cardioprotective activities [7,1]. Additionally, QCT is among the group of phytoestrogens (Plant derived molecular with estrogenic or anti-estrogenic effects) suggested to reduce risks of certain cancers [8]. A full understanding of the modes of action of Bioflavonoids, however requires the study of their interaction with all possible biological
target, including nucleic acids [9], enzymes [10,11], and other proteins [12].
In this work, the interaction of Egg albumin with QCT has been performed in CTAB solutions under physiological conditions utilizing fluorescence method in combination with time – resolved fluorescence and UV absorption spectrum. Furthermore FTIR spectra and SEM analysis also support to confirm the complex formation of egg albumin and quercetin in CTAB solution.
2.EXPERIMENTALDETAILS
2.1 Materials
Egg albumin, Quercetin and Cetyl trimethyl ammonium bromide (CTAB) was purchased from Sigma Aldrich Company, Bangalore. Triply distilled water was used throughout the study.
2.2. Sample Preparation
International Conference “
INTELINC 18
”, 12
& 13
October 2018
2.3 Methods2.3.1. UV/Vis Absorption Experiments
The absorption spectra of Egg albumin in water and in different micellar concentrations of CTAB both in presence and absence of the quencher, quercetin, have been recorded using Shimadzu 1650 PC UV-Visible Spectrophotometer. .
2.3.2. Fluorescence Steady – State
Measurements
The steady – state fluorescence quenching measurements were carried out in a Shimadzu RF5301PC Spectrofluorophotometer. The excitation wavelength was 280 nm. The emission was monited at 339nm. The excitation and emission slit width (5nm) and scan rate (200 nm/s) were constantly maintained for all the experiments.
2.3.3 Fluorescence Quenching Experiments
For the quenching experiments, various concentrations of quencher were chosen. Fluorescence intensities were obtained for different quencher concentration and plotted according to the equation,
(1)
[Q]
τ
K
1
I
I
0 q
o
The slopes afforded the Ksv values. The lifetime o of EA without any added quencher and with different concentrations of the quencher were recorded. To extract Kq values, the experimental lifetimes were plotted against quencher concentration according to the Stern – Volmer equation,
0 / = 1+ Kq 0 [Q] (2)
where 0 and are lifetime of EA in the absence and presence of quencher.
2.3.4. Fluorescence Lifetime Measurement
Fluorescence lifetime measurements were carried out in a Hariba – Jobin Yvon [spex-sf 13-11] spectrofluorimeter. The interchangeable nano LED (280 nm) was used as excitation source. The fluorescence decay of EA was measured with a monochromator – Photo multiplier setup. The data points were fitted by mono exponential decay functions. The data analysis was carried out by the software.
2.3.5 FTIR Measurements
FTIR spectra of Egg albumin without and with quercetin in different concentrations of CTAB were recorded using Thermonicolet is5 FTIR spectrophotometer.
2.3.6 SEM Analysis
Joel Sem Model, Jsm – 5610 Lv Scanning Electron Microscope was used to record the SEM photographs of Egg albumin with
different concentrations of CTAB in the presence and absence of quercetin.
3. RESULTS AND DISCUSSION
3.1 UV/Vis Absorption Studies
The ground state complex formation if any between Egg albumin and quercetin was checked by recording the absorption spectra of a mixture of EA and quercetin in different concentrations of CTAB using concentration similar to those used in quenching studies. The absence of any new peak and the fact that absorption spectrum of EA was unaltered in the presence of the quencher eliminate the possibility of ground state charge transfer complex formation. For example, as a typical case, the absorption spectrum of Egg albumin in the absence and presence of quercetin in 0.02 m concentration of CTAB is shown in fig. 2. It may be noted that other concentrations, (0.04, 0.06, 0.08 and 0.10M) of CTAB also exhibited a similar behavior.
International Conference “
INTELINC 18
”, 12
& 13
October 2018
fluorescence intensity of Egg albumin in allconcentrations of CTAB (0.02, 0.04, 0.06, 0.08, 0.10M) without the appearance of any new band in the presence of quercetin indicates that no emissive exciplex is formed between the Egg albumin and quercetin.
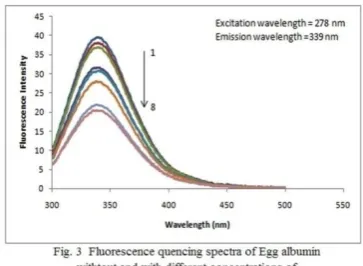
Fig. 3 shows the effect of increasing concentration of quercetin on the fluorescence emission of Egg albumin in 0.02 M concentration of CTAB. Addition of quercetin to the solution of Egg albumin resulted in the quenching of its fluorescence emission. According to eqn (1) we got linear plot [shown in Fig. 4] of the I0/I against quercetin
concentration in the CTAB solution.Stern volmer quenching constants (Ksv) have been
calculated from the slope of the plot. The bimolecular quenching rate constant (Kq) was
obtained and the corresponding electrochemical data were compiled in Table 1.
Table 1 Stern – volmer (KSV) and
bimolecular quenching rate constant (Kq) of
Egg Albumin with Quercetin in different concentrations of CTAB
Concentration of CTAB (M)
KSV
x 105 (L Mol-1)
Kq
x 1013L mol-1s
-1
R2 SD
0.02 0.45 1.21 0.92 0.34
0.04 0.55 1.55 0.99 0.19
0.06 0.70 1.97 0.99 0.24
0.08 0.95 2.72 0.98 0.22
0.10 1.15 3.25 0.91 0.27
The obtained Kq values differ among the
different concentrations of CTAB studied. The observed minimum Kq value may be due to a
weak quenching.
3.3 Binding Constant and Number of Binding Sites
Large Kq beyond the diffusion – controlled limit indicates that some type of binding interaction exists between fluorophore and quencher [14].For static quenching, the relationship between the intensity and the concentration of the quencher can be described by the binding constant formula [15].
The relationship between the fluorescence intensity and the quencher medium can be deduced from the following equation.
nQ + B Qn…. B (3)
where B is the fluorophore, Q is the quencher and Qn….B is the postulated complex between a fluorophore and n molecules of the quencher. The constant K is given by,
K = [Qn….B] / [Q] [B] (4)
if the overall amount of biomolecules (bound or unbound with the quencher) is B0, then [B0] = [Qn….B] + [B], here [B] is the concentration of unbound biomolecules, then the relationship between fluorescence intensity and the unbound biomolecular as [B] / [B0] = I/Io that is,
Log 0
F -F
=log k + n log[Q]
F
(5)International Conference “
INTELINC 18
”, 12
& 13
October 2018
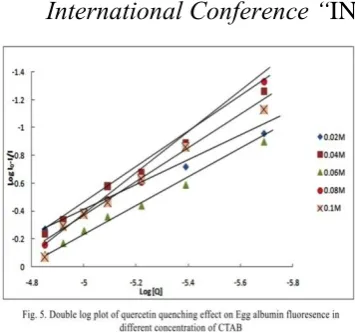
The value of K was determined from the intercept of log [(Io – I)/I] versus log[Q] as shown in Fig. 5. The value of binding constant [K] and number of binding sites (n) for quercetin in all CTAB concentrations have been calculated and shown in Table. 2. The correlation coefficient for all the 0.97 curves were larger than indicating that the interaction between Egg albumin and quercetin in CTAB solution agrees well with the site binding model underlying eqn. (5).
Table 2 Binding constant (Ka), binding
numbers (n), correlation coefficient (R), change in free energy Gg (for ground state)
3.4. Mechanism of Quenching
The quenching of Egg albumin can be explained by a number of possible mechanisms such as electron transfer, energy transfer, and proton transfer on hydrogen atom transfer. Fig. 3 shows the fluorescence emission spectra of EA with various quantities of quercetin 0.02M concentration of CTAB.. it can be seen from a scrutiny of the all the concentration of CTAB (0.02, 0.04, 0.06, 08, 0.1M) figures, fluorescence intensity of EA decreases steadily and with the addition of quencher there is almost no shift in the emission wavelength (λemi = 339nm). The quenching rate constant
Kq are much higher than the maximum scatter collision quenching constant of the various quenchers [2.0 x 10¹⁰ L mol-1 s1] which indicates that the quenching mechanism of quercetin – EA interaction is not initiated by dynamic collision but by compound formation [16]. That is, drug is bound to EA and a drug – EA complex is formed, which resulted in the quenching of the fluorescence of the fluorophore.
Essentially, there exist four types of non-covalent interactions in the binding of the ligands to proteins. These are hydrogen bonds, van der waals forces, hydrophobic and electrostatic interactions [17]. Thermodynamic parameters, free energy (G), standard enthalpy (H) and standard entropy (S) will provide an insight into the binding mode. Among these parameters, G reflects the possibility of reaction; H and S are principal evidence for determining the active forces. Through, the binding constant ka, thermodynamic parameter is evaluated using the following equation,
G = - RT ln Ka (6)
R is the gas constant; G value is given in Table 2.
The negative sign for G means that interaction is spontaneous and also indicates that the electron transfer processes studied are thermodynamically favourable. The hydrophobic force may play a major role in the reaction [18].
3.5 Fluorescence Lifetime Measurements Of Egg Albumin With Quercetin In Different Ctab Concentrations
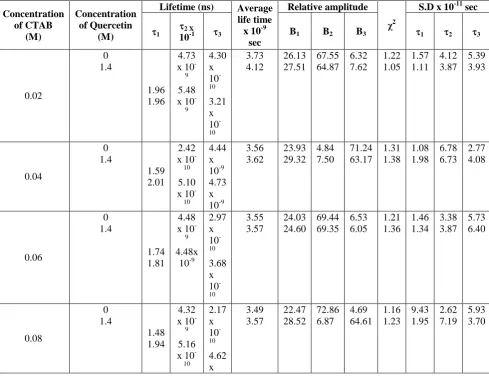
Fluorescence lifetime measurement is a very useful technique for understanding the type of interaction between the donor and the acceptor systems. In general, the measurement of fluorescence lifetime is the most definite method to distinguish static quenching and dynamic quenching [19].
International Conference “
INTELINC 18
”, 12
& 13
October 2018
micelles, the well-established quenching method firstly proposed by Turro and Yekta [20] on the basis of previous analysis performed by Tachiya [21]. This procedure is based upon the quenching of a luminescentprobe by a known concentration of quenchers. The quenching experiments were analysed by using the following equation,
(7)
where Io and I are the fluorescence intensities in the absence and presence of the quenchers respectively. Nagg is the mean aggregation number, [S] is the total surfactant concentration in the micellar system increase. Fig.7 shows the obtained quenching results according to equation (7). The mean aggregation number of CTAB micelles are listed in Table 4.
Table 3 Fluorescence life time and amplitudes of egg albumin without and with quercetin in different concentrations of ctab
Concentration
Lifetime (ns) Average
International Conference “
INTELINC 18
”, 12
& 13
October 2018
factor for micelle size. According to Tanford [23], the hydrophobic chain volume of the micelle v, and the critical chain length lc, can be obtained from,v, = (27.4 + 26.9 nc) (A° assuming a spherical geometry, the micellar radius, Ro, and the surface area per head group were obtained. The corresponding values are listed in Table 5
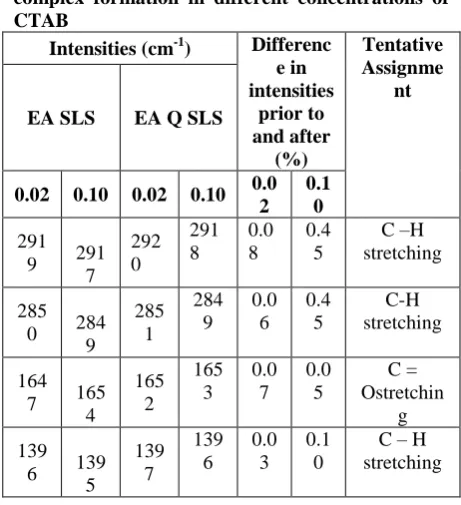
Table : 5 Difference in FTIR absorption peak Intensities of Egg Albumin before and after complex formation in different concentrations of CTAB
Intensities (cm-1) Differenc
e in
3.7. Fourier Transform Infrared Spectra
The changes of the FTIR spectra shown in Figs. 8 & 9 can reveal the formation of the Egg albumin and quercetin complexes in 0.02 M concentration of CTAB. The same can be observed for all other concentrations of CTAB (0.04, 0.06, 0.08 and 0.1 M) and the values are shown in Table 5.
International Conference “
INTELINC 18
”, 12
& 13
October 2018
The absorption intensity of the complexes is significantly weaker than that of Egg albumin. The complex infra-red peaks are observed in the range 1000 cm-1– 3000 cm-1 and are 0.03 to 0.45 % weaker than that of the Egg albumin molecule. As there is no changing in the wavenumber other than, change in the absorption intensities, it can be concluded that 0.03 to 0.45 % weaker complexes were formed of Egg albumin and quercetin in different CTAB concentration.
3.8. Scanning electron microscope (SEM) observation of Egg albumin with quercetin in CTAB
Egg albumin in CTAB was powdered separately and the structure of their particles in
International Conference “
INTELINC 18
”, 12
& 13
October 2018
4. CONCLUSION
International Conference “
INTELINC 18
”, 12
& 13
October 2018
exhibit a various biological and pharmaceuticalproperties. In view of their broad incidence in nature and considerably low toxicities. Prospective development and use of these compounds as efficient pharmaceutical agents. Particularly as anticancer drugs is a matter of significant current interest. This paper has focused on the general features of the quercetin interaction with egg albumin in CTAB solution.
In this work, the interaction quercetin with EA in CTAB was studied by spectroscopic methods including fluorescence spectroscopy, UV-Visible absorption spectroscopy, time-resolved fluorescence spectroscopy, FTIR spectroscopy and SEM analysis. This experimental result indicates that the quenching mechanism of flourescne of EA by quercetin is a dynamic process; binding parameters calculated from Stern-Volmer method and scatcherd method showed that quercetin binds to EA with the binding affinities of the order 104L mol-1were discussed. The binding reaction is spontaneous and hydrophobic interaction play a major role in the reaction. Binding site was also determined.
The interaction study of quercetin with EA and structure – affinity relationships is of good importance in pharmacy, pharmacology and biochemistry.
REFERENCES
[1] E. Jr. Middleton, C. Kandaswami, TC. Theoharides, Rev .52 (2000) 673-751. [2] B.H. Havsteen,Pharmacol.Ther.
96(2002)67–72.
[3] Michael R.Webb and Susan E. Ebeler, Biochem.J 384 (2004) 527–541.
[4] C. Ende, R. Gebhardt, Planta Med. 70 (2004)1006-1008.
[5] IB.Afanas’eva, EA.Ostrakhovitch, EV.Mikhal’chik, GA Ibragimova, LG.
Korkina. Biochem
Pharmacol.61(2001)677-684.
[6] J.B.Harborne, and C. A. Williams, Phytochemistry. 55(2005) 481–504. [7] N.C.Cook and S.Samman, Journal of
Nutritional Biochemistry. 7 (1996)66–76. [8] CS. Yang, JM. Landau, MT. Huang, HL. New mark. Annu Rev Nutr. 21(2001)381-406.
[9] Riccardo Solimani,. Biochimica Biophysica Acta.1336 (1997) 281–294. [10]TM. Kitson, KE Kitson, SA. Moore,
Chem. Biol. Interact. 130(2001)57-69. [11]C.Martin-Cordeo, M. Lopez-Lazaro, J.
Pinero, T. Oritz, F Cortes, MJ. Ayuso. J. Enzyme.Inhib. 154(2000)55-60.
[12]Olivier Dangles, Claire Dufour, Claudine Manach, Christine Morand, Christian Remesy, Methods in Enzymology. 335 (2001)319–333.
[13]H.C. Gao., R.X. Zhu , X.Y. Yang, S.Z. Mao, S. Zhao,, J.Y. Yu, and Du,. Journal of Colloid and Interface Science, 273 (2), 2004. 626-631.
[14]H.R. Park, K.Y Chung, H.C. Lee, J.K Lee, K.M.Bark ,Bull.KoreanChem.Soc. 21 (2000) 849–854.
[15]Y.Xu,H.X.Shen, H.G.Huan, Anal.Chem.25,(1997), 419
[16]J. Wang, Y.Y Zhang , Y. Guo, L. Zhang, R. Xu, Z.Q. Xing,. Dyes and Pigments 80 (2009) 271–278.
[17]Deborah Leckband,Annu-Rev.Biophys.Biomol.Struct. 29 (2000) 1–26.
[18]P. D. Ross and S. Subramanian, , Biochemistry, 20 (1981) 3096–3102. [19] Yao-haiZhang,
Hua-shanZhang, MingMa,
Xiao-fengGuo, Hong Wang,.Applied Surface Science, 255( 2009) 4747–4753.
[20]N.J. Turro and A. Yekta, , J. Am. Chem. Soc., 100(1978) 5951.
[21]M.Tachiya, Chem. Phys. Lett. 33(1975) 289-292.
[22]J.N.Israelachvili, V. Degiorgio and M. Corti, eds., North Holland, Amsterdam. Vesicles and Microemulsions, (1985), 24-58.