Overview of the 2018 ALTA Shared Task: Classifying Patent Applications
Diego Moll´a Department of Computing
Macquarie University Sydney, Australia [email protected]
Dilesha Seneviratne
Queensland University of Technology (QUT) Brisbane, Australia
Abstract
We present an overview of the 2018 ALTA shared task. This is the 9th of the se-ries of shared tasks organised by ALTA since 2010. The task was to classify Aus-tralian patent classifications following the sections defined by the International Pa-tient Classification (IPC), using data made available by IP Australia. We introduce the task, describe the data and present the results of the participating teams. Some of the participating teams outperformed state of the art.
1 Introduction
When a patent application is submitted there is a process where the application is classified by ex-aminers of patent offices or other people. Patent classifications make it feasible to search quickly for documents about earlier disclosures similar to or related to the invention for which a patent is applied for, and to track technological trends in patent applications.
The International Patent Classification (IPC) is a hierarchical patent classification system that has been agreed internationally. The first edition of the classification was established by the World In-tellectual Property Organization (WIPO) and was in force from September 1, 1968 (WIPO, 2018). The classification has undertaken a number of re-visions since then. Under the current version, a patent can have several classification symbols but there is one which is the primary one. This is what is called theprimary IPC mark.
An IPC classification symbol is specified ac-cording to a hierarchy of information. The generic form of the symbol is A01B 1/00, where each component has a special meaning as defined by WIPO(2018). The first character of the IPC
clas-Symbol Section
A Human necessities
B Performing operations, transporting C Chemistry, metallurgy
D Textiles, paper E Fixed constructions
F Mechanical engineering, lighting, heating, weapons, blasting
G Physics
H Electricity
Table 1: Sections of the IPC
sification symbol denotes the first level of the hi-erarchy orsection symbol. This is a letter from A to H as defined in Table1.
The goal of the 2018 ALTA Shared Task is to automatically classify Australian patents into one of the IPC sections A to H. Section2 introduces the ALTA shared tasks. Section3 presents some related work. Section 4describes the data. Sec-tion5 describes the evaluation criteria. Section6 presents the results, and Section 7concludes this paper.
2 The 2018 ALTA Shared Task
The 2018 ALTA Shared Task is the 9th of the shared tasks organised by the Australasian Lan-guage Technology Association (ALTA). Like the previous ALTA shared tasks, it is targeted at uni-versity students with programming experience, but it is also open to graduates and professionals. The general objective of these shared tasks is to intro-duce interested people to the sort of problems that are the subject of active research in a field of nat-ural language processing.
— there should be no human intervention. As in past ALTA shared tasks, there are two cat-egories: a student category and an open category.
• All the members of teams from the student category must be university students. The teams cannot have members that are full-time employed or that have completed a PhD.
• Any other teams fall into theopen category.
The prize is awarded to the team that performs best on the private test set — a subset of the eval-uation data for which participant scores are only revealed at the end of the evaluation period (see Section5).
3 Related Work
Extensive research has been conducted on au-tomating patent classification in the IPC hierarchy and a wide variety of approaches have been pro-posed. These approaches use features that are gen-erated/extracted from patent content (claim, de-scription, etc), patent metadata (title, applicant name, filing date, inventor name, etc) and cita-tions to represent patent documents in classifica-tion (Liu and Shih, 2011). Patent content-based features are the most popular choice among the different types of features to address patent classi-fication (Liu and Shih,2011). In addition, features based on patent metadata which are considered to have strong classification power have been used to boost the classification performance (Richter and MacFarlane, 2005). Further, patents are not isolated but they are connected through citations which provide rich information about the patent network. Thus, researchers have utilised patent ci-tation information to generate features for patent classification (Liu and Shih,2011;Li et al.,2007). While all these types of features have served to build classifiers, which features can represent the patents well is still an open question (Gomez and Moens,2014b).
Some of the widely used classification algo-rithms in the literature for building patent clas-sification systems are Naive Bayes (NB), Artifi-cial Neural Network (ANN), Support Vector Ma-chines (SVM), K-Nearest Neighbour (KNN), De-cision Trees (DT) and Logistic Regression (LR). The greater part of these systems has focused on achieving classification effectiveness. SVM has shown superior performance in terms of effective-ness with some datasets (Fall et al., 2003), yet
it has not been able to scale with large datasets. Seneviratne et al. (2015) have proposed a doc-ument signature-based patent classification ap-proach employing KNN which can address the scalability and efficiency with a competitive effec-tiveness.
Given that there are different evaluation mea-sures and different datasets, it is difficult to com-pare the performance between many patent classi-fication approaches. Apart from the shared eval-uation tasks of patent classification like CLEF-IP 2010 (Piroi et al.,2010) and CLEF-IP 2011 (Piroi et al., 2011), where the performance of systems were evaluated using benchmark datasets, a lim-ited number of approaches — e.g. by Fall et al. (2003), Tikk et al. (2005) and Seneviratne et al. (2015) — have evaluated their methods using publicly available complete data sets like WIPO-alpha1 and WIPO-de.2 The majority of other sys-tems have been evaluated using ad-hoc datasets, making it difficult to extrapolate their perfor-mance (Gomez and Moens,2014b).
The CLEF-IP 2010 and 2011 classification tasks required to classify patents at the IPC sub-class level (Piroi et al.,2010,2011), which is finer grained than the section level used in the ALTA shared task. Both of these classification tasks used evaluation measures such as Precision@1, Preci-sion@5, Recall@5, Map and F1 at 5, 25 and 50. While the best results of these experiments varied, the best results were fromVerberne and D’hondt (2011), who achieved 0.74, 0.86, and 0.71 for pre-cision, recall, and F1 score respectively.
Most of the researchers who have conducted experiments with complete WIPO-alpha and WIPO-de datasets have reported their results at IPC section and subclass levels. For example, the hierarchical classification method by Tikk et al. (2005) has achieved an accuracy of 0.66 at the sec-tion level with the WIPO-alpha dataset and 0.65 with the WIPO-de dataset. Gomez and Moens (2014a) have reported their classification results for WIPO-alpha at the section level and the re-ported values for accuracy and macro-averaged F1 score are 0.74 and 0.71 respectively.
1 http://www.wipo.int/classifications/ ipc/en/ITsupport/Categorization/dataset/ wipo-alpha-readme.html
ID Label
0 A
1 G
2 A
3 A
4 D
5 A
Table 2: First 5 rows of the training data
4 Data
The data used in the 2018 ALTA Shared Task con-sists of a collection of Australian patents parti-tioned into 3,972 documents for training and 1,000 documents for test. The documents are plain text files which are the result of applying a text ex-tracting tool on the original PDF files. As a result, there are errors in the documents, some of which are documented by the participants of the shared task (Benites et al., 2018; Hepburn, 2018). In particular, 61 documents contain the string “NA[newline]parse failure”. In addition, meta-data information such as titles, authors, etc. are not marked up in the documents.
The data have been anonymised by replacing the original file names with unique IDs starting from number 1. Prior to assigning the IDs, the files have been shuffled and split into the training and test sets. Two CSV files are used to specify the training and test data, so that the training data contains the annotated sections, and the test data only contain the IDs of the test documents. Table2 shows the first lines of the CSV file specifying the training data.
Figure 1 shows the label distributions of the training and test data. There was no attempt to ob-tain stratified splits and consequently there were slight differences in the distributions of labels. We can also observe a large imbalance in the distribu-tion of labels, where the most frequent label (“A”) occurs in more than 30% of the data, and the least frequent label (“D”) occurs in only 0.2% to 0.3% of the data.
5 Evaluation
As in previous ALTA shared tasks, the 2018 shared task was managed and evaluated using Kaggle in Class, with the name “ALTA 2018
Chal-D F E H B C G A
0.3 4.5
7.2 8.3
11.1 16
19.7
32.8
0.2 3.8
6.3 10.2
13 14.6
20
31.9
Train Test
Figure 1: Distribution of labels in percentages
lenge”.3 This enabled the participants to submit runs prior to the submission deadline for immedi-ate feedback and compare submissions in a leader-board.
The framework provided by Kaggle in Class al-lowed the partition of the test data into a public and a private section. Whenever a participating team submitted a run, the evaluation results of the public partition were immediately available to the team, and the best results of each team appeared in the public leaderboard. The evaluation results of the private partition were available to the com-petition organisers only, and were used for the fi-nal ranking after the submission deadline. To split the test data into the public and private partitions, we used the defaults provided by Kaggle in Class. These defaults performed a random partition with 50% of the data falling into the public partition, and the remaining 50% falling into the private par-tition. The participants were able to see the entire unlabelled evaluation data, but they did knot know what part of the evaluation data belonged to which partition.
Each participating team was allowed to submit up to two (2) runs per day. By limiting the number of runs per day, and by not disclosing the results of the private partition, the risks of overfitting to the private test results were controlled.
The chosen evaluation metric was the micro-averaged F1 score. This metric is common in
multi-label classification tasks, and measures the harmonic mean of recall and precision according to the formula:
F1 = 2 p·r
p+r
Wherepis the precision computed as the ratio of true positives to all predicted positives, andris the recall computed as the ratio of true positives to all actual positives. In particular:
p=
P
k∈Ctpk
P
k∈Ctpk+Pk∈Cf pk
r=
P
k∈Ctpk
P
k∈Ctpk+Pk∈Cf nk
Wheretpk,f pkandf nkare the number of true
positives, false positives, and false negatives, re-spectively, in classk∈ {A, B, C, D, E, F, G, H}.
6 Results
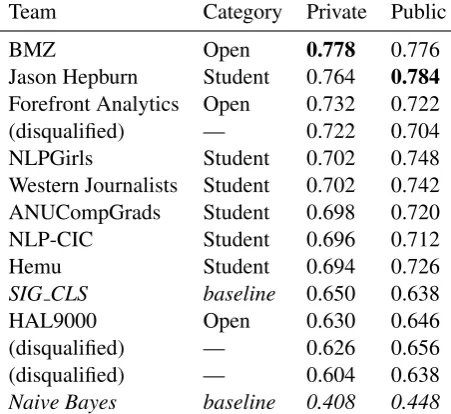
A total of 14 teams registered in the student cate-gory, and 3 teams registered in the open category. Due to the nature of the Kaggle in Class frame-work, Kaggle users could register to the Kag-gle system and submit runs without notifying the ALTA organisers, and therefore a number of runs were from unregistered teams. In total, 14 teams submitted runs, of which 6 were registered in the student category and 3 were registered in the open category. The remaining teams were disqualified for the final prize. Table 3 shows the results of the public and private submissions of all teams, in-cluding the runs of disqualified teams.
Table3also includes two baselines. The Naive Bayes baseline was made available to the partic-ipants as a Kaggle kernel.4 The baseline imple-mented a simple pipeline using the sklearn envi-ronment5that implemented a Naive Bayes classi-fier using tf.idf features. Both the Naive Bayes classifier and thetf.idf vectoriser used the defaults provided by sklearn and were not fine-tuned. All of the participant’s best runs outperformed the baseline.
The SIG CLS baseline is the system reported by Seneviratne et al. (2015). The system was retrained with the shared task data with small
4
https://www.kaggle.com/dmollaaliod/ naive-bayes-baseline
5https://scikit-learn.org/stable/
Team Category Private Public
BMZ Open 0.778 0.776
Jason Hepburn Student 0.764 0.784
Forefront Analytics Open 0.732 0.722
(disqualified) — 0.722 0.704
NLPGirls Student 0.702 0.748
Western Journalists Student 0.702 0.742
ANUCompGrads Student 0.698 0.720
NLP-CIC Student 0.696 0.712
Hemu Student 0.694 0.726
SIG CLS baseline 0.650 0.638
HAL9000 Open 0.630 0.646
(disqualified) — 0.626 0.656
(disqualified) — 0.604 0.638
Naive Bayes baseline 0.408 0.448
Table 3: Micro-averaged F1 of the best public and private runs
changes on the system settings.6 Virtually all par-ticipants obtained better results than this second baseline.
In past competitions of the ALTA shared task there were some differences between the rankings given in the public and the private submissions. This is the first time, however, that the best teams in the public and the private runs differ. Fol-lowing the rules of the shared task, the winning team was BMZ, and the best team in the student category was Jason Hepburn. These two teams describe their system in separate papers (Benites et al.,2018;Hepburn,2018).
7 Conclusions
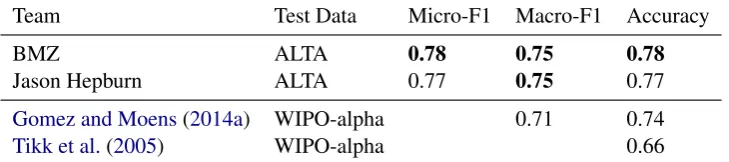
The 2018 ALTA Shared Task was the 9th of the series of shared tasks organised by ALTA. This year’s task focused on document classification of Australian patent applications following the sec-tions defined by the International Patent Classifi-cation (IPC). There was very active participation, with some teams submitting up to 30 runs. Par-ticipation was increasingly active near the final submission date, and the top rows of the public leaderboard changed constantly. To the best of our knowledge, prior to this shared task the best-performing system using the WIPO-alpha set re-ported an accuracy of 0.74 and a macro-averaged F1 score of 0.71 (Gomez and Moens,2014a).
Team Test Data Micro-F1 Macro-F1 Accuracy
BMZ ALTA 0.78 0.75 0.78
Jason Hepburn ALTA 0.77 0.75 0.77
Gomez and Moens(2014a) WIPO-alpha 0.71 0.74
Tikk et al.(2005) WIPO-alpha 0.66
Table 4: Micro-F1, Macro-F1 and Accuracy of best-performing systems and comparison with literature.
ble4 shows the accuracy and micro- and macro-averaged F1 score of the two top-performing sys-tems in the test set of the ALTA shared task.7 Both systems achieved better results in all comparable metrics, which indicates that they appear to have outperformed the state of the art.
Acknowledgments
This shared task was made possible thanks to the data provided by the Digital Transformation Agency and IP Australia.
References
Fernando Benites, Shervin Malmasi, and Marcos Zampieri. 2018. Classifying patent applications with ensemble methods. In Proceedings ALTA 2018.
Caspar J Fall, Atilla T¨orcsv´ari, Karim Benzineb, and Gabor Karetka. 2003. Automated categorization in the international patent classification. InAcm Sigir Forum. ACM, volume 37, pages 10–25.
Juan Carlos Gomez and Marie-Francine Moens. 2014a. Minimizer of the reconstruction error for multi-class document categorization. Expert Systems with Ap-plications41(3):861–868.
Juan Carlos Gomez and Marie-Francine Moens. 2014b. A survey of automated hierarchical classification of patents. In Professional Search in the Modern World, Springer, pages 215–249.
Jason Hepburn. 2018. Universal language model fine-tuning for patent classification. In Proceedings ALTA 2018.
Xin Li, Hsinchun Chen, Zhu Zhang, and Jiexun Li. 2007. Automatic patent classification using citation network information: an experimental study in nan-otechnology. InProceedings of the 7th ACM/IEEE-CS joint conference on Digital libraries. ACM, pages 419–427.
7
Due to a glitch with the Kaggle framework we were un-able to determine the public and private partitions of the test set. Consequently, the systems were tested on thecombined
public and private partitions.
Duen-Ren Liu and Meng-Jung Shih. 2011. Hybrid-patent classification based on Hybrid-patent-network analy-sis.Journal of the American Society for Information Science and Technology62(2):246–256.
Florina Piroi, Mihai Lupu, Allan Hanbury, Alan P Sexton, Walid Magdy, and Igor V Filippov. 2010. Clef-ip 2010: Retrieval experiments in the intel-lectual property domain. In CLEF (notebook pa-pers/labs/workshops).
Florina Piroi, Mihai Lupu, Allan Hanbury, and Veronika Zenz. 2011. Clef-ip 2011: Retrieval in the intellectual property domain. In CLEF (notebook papers/labs/workshop).
Georg Richter and Andrew MacFarlane. 2005. The impact of metadata on the accuracy of automated patent classification. World Patent Information
27(1):13–26.
Dilesha Seneviratne, Shlomo Geva, Guido Zuccon, Gabriela Ferraro, Timothy Chappell, and Magali Meireles. 2015. A signature approach to patent clas-sification. In Asia Information Retrieval Sympo-sium. Springer, pages 413–419.
Domonkos Tikk, Gy¨orgy Bir´o, and Jae Dong Yang. 2005. Experiment with a hierarchical text catego-rization method on wipo patent collections. In Ap-plied Research in Uncertainty Modeling and Analy-sis, Springer, pages 283–302.
Suzan Verberne and Eva D’hondt. 2011. Patent classi-fication experiments with the linguistic classiclassi-fication system lcs in clef-ip 2011. InCLEF (Notebook Pa-pers/Labs/Workshop).