Discriminative Language Models as a Tool for
Machine Translation Error Analysis
Koichi Akabe Graham Neubig Sakriani Sakti Tomoki Toda Satoshi Nakamura
Graduate School of Information Science Nara Institute of Science and Technology 8916-5 Takayama-cho, Ikoma-shi, Nara, Japan
{akabe.koichi.zx8, neubig, ssakti, tomoki, s-nakamura}@is.naist.jp
Abstract
In this paper, we propose a new method for effective error analysis of machine translation (MT) systems. In previous work on error analysis of MT, error trends are often shown by frequency. However, if we attempt to perform a more detailed analysis based on frequently erroneous word strings, the word strings also often occur in correct translations, and analyzing these correct sen-tences decreases the overall efficiency of error analysis. In this paper, we propose the use of regularized discriminative language models (LMs) to allow for more focused MT error analysis. In experiments, we demonstrate that our method is more efficient than frequency-based analysis, and examine differences across systems, language pairs, and evaluation measures.1
1 Introduction
Accuracy of Statistical Machine Translation (SMT) systems is continually increasing, but systems are now more complex than ever before. As a result, not all effects of making modifications to a system are known without actually making the modification and generating translations. Therefore, in the process of developing an SMT system, it is common to evaluate actual translations to identify problems to make improvements. This process is time consuming, as it is often necessary to analyze a large number of translations to get an overall grasp of the system’s error trends. In addition, many sentences will contain no errors, or only errors from the long tail that are not representative of the system as a whole. On the other hand, if we are able to detect and rank important errors automatically, we will likely be able to find representative errors of the SMT system more efficiently.
Previous work has proposed methods for automatic error analysis of MT systems based on automati-cally separating errors into classes and sorting these classes by frequency (Vilar et al., 2006; Popovic and Ney, 2011). These classes cover common mistakes of MT systems, e.g. conjugation, reordering, word deletion, and insertion. This makes it possible to view overall error trends, but when the goal of analysis is to identify errors to make some concrete improvement to the system, it is often necessary to perform a more focused analysis, looking at actual errors made by a particular language pair or system. We show examples of errors types that are informative, but are language- or task-specific, and not covered by pre-vious methods in Figure 1. In this example, the type given by more standard error typologies is indicated by “Traditional type,” but we would prefer a more detailed analysis such as “Fine-grained type,” would allows us to take specific steps to fix the machine translation system (such as ensuring that Wikipedia titles are not punctuated, or normalizing full-width characters to half-width). These fine-grained types are difficult to conceive without actually observing the MT system output, but if we are able to group ac-tual errors into fine-grained classes based on, for example, lexical clues, this sort of analysis will become possible and more efficient.
Previous research on improving the efficiency of error analysis has generally focused on grouping error types by frequency, but try to apply such frequency-based techniques to individual errors, selected errors
1
Our implementation is available open-source athttps://github.com/vbkaisetsu/dlm-analyzer
This work is licensed under a Creative Commons Attribution 4.0 International License. Page numbers and proceedings footer are added by the organizers. License details:http://creativecommons.org/licenses/by/4.0/
Src 学術 交流 協定
Ref the academic exchange agreement MT academic exchange agreement . Traditional type Insertion error
Fine-grained type Insertion error (unneeded period)
Src 覚行 法 親王 ( 1075 - 1105 ) - 仁和 寺門 跡
Ref prince kakugyoho -lrb- 1075 - 1105 -rrb- ninna-ji monzeki
MT imperial prince kakugyo -lrb-1075- 1105 -rrb- : ninna-ji temple ruins Traditional type Replacement error or Unknown word
Fine-grained type Unknown word (number) or Half-/Full-width error
Figure 1: Example of errors in Japanese to English translation, classified into traditional, or more fine-grained and useful classes.
1-gram 2-gram the 61 (BOS) the 42 , 47 . (EOS) 41 and 43 , and 32 of 42 of the 27 : 42 in the 21
Table 1: Frequently occurring erroneousn-grams
are often dominated by frequently occurring linguistic phenomena that are not necessarily indicative of translation errors. To show examples of this problem, in Table 1 we provide a list of erroneous n-grams that were produced by an MT system (described in Section 4.1) but not contained in the respective references. From this table, we can see that frequently occurring erroneousn-grams are simplyn-grams that frequently occur in English, and because of this we cannot discover characteristic errors of the system for improvement just from this information.
In this paper, we propose a new method that uses regularized discriminative LMs to solve the above problem. Discriminative LMs are LMs trained to fix common output errors of a particular system. From the viewpoint of error analysis, if we train a discriminative LM usingn-gram features and examine the weights learned by this model,n-grams with large negative or positive weights will be indicative of pat-terns that are over- or under-produced by the MT system. Because the weights are specifically trained to fix errors, it is likely that these patterns will be more informative than mistakes that are simply frequently occurring. We can also use a number of features of discriminative LMs to perform a more focused and efficient analysis. For example, if we perform training with L1 regularization, many features will be removed and only important patterns will remain in the model. Additionally, we can focus on specific varieties of errors by changing the evaluation measure used for training the LMs.
In our experiments, we validate the effectiveness of error analysis based on discriminative LMs. We perform a manual evaluation of then-gram patterns discovered by random selection, by frequency-based analysis, and by the proposed method. As a result, the proposed method is more effective at identifying errors than other methods.
2 Discriminative Language Models
In this section, we first introduce the discriminative LM used in our method. As a target for our analysis, we have input sentencesF ={F1, . . . , FK},n-best outputsEˆ={E1ˆ , . . . ,EˆK}of an MT system, and reference translationsR = {R1, . . . , RK}. Discriminative LMs define feature vectorsϕ(Ei)for each candidate inEˆk={E1, E2, . . . , EI}, and calculate inner productsw·ϕ(Ei)as scores.
We choose the sentence with the highest evaluationEV as an oracleEk∗. Oracles are chosen for each n-best, and we trainwso that the oracle’s score becomes higher than the other candidates.
2.1 Structured Perceptron
While there are a number of methods for training discriminative LMs, we follow Roark et al. (2007) in using the structured perceptron as a simple and effective method for LM training. The structured perceptron is a widely used on-line learning method that examines one training instance and updates the weight vector using the difference between feature vectors generated from the oracle E∗ and the hypothesis Eˆ calculated by the current model. For each iteration, w is updated using the difference betweenE∗ andE. Ifˆ Eˆ is equal toE∗, the difference becomes0, so no update is performed. This process is run for allF sequentially, and iterated until weights converge or we reach a fixed iteration limitN. We show the above procedure in Algorithm 1.
Algorithm 1Structured perceptron training of the discriminative LM
forn= 1toN do for allEˆ ∈Eˆdo
E∗ ←arg max E∈Eˆ
EV(E) ˆ
E ←arg max E∈Eˆ
w·ϕ(E) w←w+ϕ(E∗)−ϕ( ˆE) end for
end for
2.2 Learning Sparse Discriminative LMs
While the structured perceptron is a simple and effective method for learning discriminative LMs, it also has no bias towards reducing the number of features used in the model. However, if we add a bias towards learning smaller models, we can keep only salient features (Tsuruoka et al., 2009).
In our work, we use L1 regularization to add this bias. L1 regularization gives a penalty to w pro-portional to the L1 norm∥w∥1 =∑i|wi|, pushing a large number of elements inwto 0, so ineffective features are removed from the model.
To train L1 regularized discriminative LMs, we use the forward-backward splitting (FOBOS) algo-rithm proposed by Duchi and Singer (2009). FOBOS splits update and regularization, and lazily calcu-lates the regularization upon using the weight to improve efficiency.
2.3 Features of Discriminative LMs
In the LM, we used the following three features:
1. System score featureϕs: As our goal is fixing the output of the system, we add this feature to allow a default ordering ofn-bests by score.
2. n-gram featureϕn: We add a binary feature counting the frequency of eachn-gram in the hypothesis. The weights of these features will be the main target of our analysis.
3. Hypothesis length featureϕl: If the evaluation measure has a penalty for the number of words, this allows us to adjust it.
In this work, we do not use other features, but our method theoretically allows for addition of other features such as POS tags or syntactic information, which could also potentially be used as a target for analysis.
3 Discriminative LMs for Error Analysis
Error types
Replacement (Context dependent) (Context independent) Insertion
Deletion Reordering Conjugation Polarity
Unknown words
Table 2: Error categories for annotation
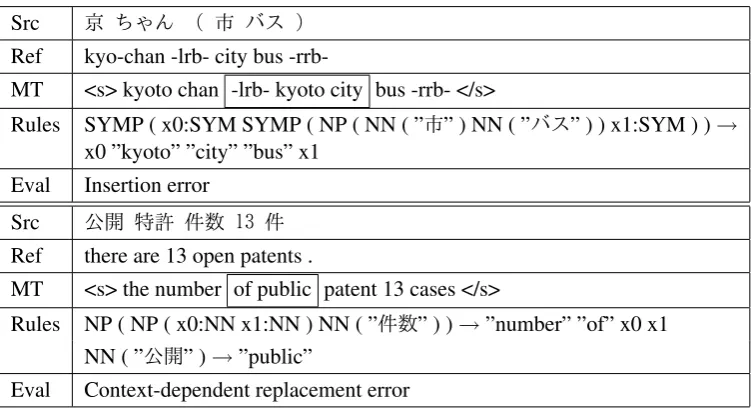
Src 京 ちゃん ( 市 バス )
Ref kyo-chan -lrb- city bus
-rrb-MT <s> kyoto chan -lrb- kyoto city bus -rrb- </s>
Rules SYMP ( x0:SYM SYMP ( NP ( NN ( ”市” ) NN ( ”バス” ) ) x1:SYM ) )→ x0 ”kyoto” ”city” ”bus” x1
Eval Insertion error
Src 公開 特許 件数 13 件
Ref there are 13 open patents .
MT <s> the number of public patent 13 cases </s>
Rules NP ( NP ( x0:NN x1:NN ) NN ( ”件数” ) )→”number” ”of” x0 x1 NN ( ”公開” )→”public”
Eval Context-dependent replacement error
Figure 2: Example of the evaluation sheet. Boxed words are chosenn-grams.
3.1 Focused Error Analysis of MT output
We first define the following general framework for focused analysis of errors in MT output. Using this, we can find error trends of chosen n-grams:
1. Automatically choose potentially erroneousn-grams in the MT output.
2. Select one or more 1-best translations that contain each chosenn-gram.
3. Show selected translations to an annotator with the selectedn-gram highlighted.
4. The annotator looks at the indicatedn-gram, and marks whether or not by examining then-gram whether they were able to identify an error in the MT output. If the answer is “yes,” the annotator additionally indicates which variety of error was found according to Table 2.
A part of the actual evaluation sheet is shown in Fig. 2. The first four rows are the input, and the final row is the annotator’s evaluation.
3.2 Selection of Targetn-grams
We can think of the following three methods for choosing potentially erroneousn-grams:
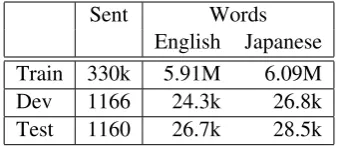
Sent Words English Japanese Train 330k 5.91M 6.09M Dev 1166 24.3k 26.8k Test 1160 26.7k 28.5k
Table 3: Data size of KFTT
Frequency: n-grams that are most frequently over-generated (occur in the hypothesis, but not in the references). This corresponds to a focused version of the frequency-based automatic error analysis methods of Vilar et al. (2006) and Popovic and Ney (2011).
LM: n-grams that have the lowest weight according to the discriminative LM. This is our proposed
method.
In particular, for discriminative LMs, n-gram features that have large positive or negative weights indicaten-grams that are under-generated or over-generated by the system. Therefore, by examining high-weighted or low-weighted n-grams, it is likely that we will be able to get a grasp of the system mistakes. When performing actual evaluation, we want to analyze n-grams with 1-best translations. Almost high-weightedn-grams are only contained in oracle translations, and not contained in 1-best translation. Therefore, we use low-weightedn-grams for evaluation. If the discriminative LM is properly trained, low-weightedn-grams will often correspond to actual errors.
3.3 System Comparison
When developing MT systems, it is common to not only evaluate a single system, but also compare multiple systems, such as when comparing a new system with baselines.
To do this in the current work, we create discriminative LMs from n-bests generated by multiple translation systems, and choose representativen-grams using the proposed method. Then we examine the selectedn-grams in context and then compare the result of this analysis.
4 Experiments
We evaluate the effectiveness of our method by performing a manual evaluation over three translation systems, two translation directions, and two evaluation measures.
4.1 Experiment Setup
For each MT system, we use Japanese-English data from the KFTT (Neubig, 2011) as a corpus. The size of the corpus is shown in Table 3. In our experiment, we use a forest-to-string (f2s) system trained using the Travatar toolkit (Neubig, 2013) for single system evaluation. For system comparison, we compare the abovef2ssystem with a phrase based (pbmt) system and a hierarchical phrase based (hiero) system built using Moses (Koehn et al., 2007).
The f2s system is built using Nile2 for making word alignments, and syntax trees generated with Egret3.pbmtandhieroare built using GIZA++ (Och and Ney, 2003) for word alignments. Each system is optimized using MERT (Och, 2003) with BLEU (Papineni et al., 2002) as an evaluation measure. For single system evaluation, we also use the reordering-oriented evaluation metric RIBES (Isozaki et al., 2010) as additional metric for training the discriminative LM.
For training discriminative LMs, our method uses the structured perceptron with 100 iterations and FOBOS for L1 regularization as described in Section 2.2. The regularization factor is chosen from the range10−6-10−2 to give the highest performance on the KFTT test data.
LMs are trained using 500-bests from each MT system and features described in Section 2.3. We use 1-grams to 3-grams asn-gram features.
2http://code.google.com/p/nile/
System BLEU(dev) BLEU(test) Original LM applied Original LM applied
pbmt 0.2929 0.3521 0.2460 0.2485
hiero 0.2953 0.3859 0.2616 0.2562
f2s 0.2958 0.3887 0.2669 0.2676
Table 4: Translation accuracy of each system, without LMs and with LMs
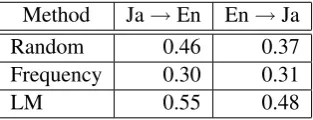
Method Ja→En En→Ja
Random 0.46 0.37
Frequency 0.30 0.31
LM 0.55 0.48
Table 5: Precision of top 30n-grams that select errors in both directions
We show translation accuracies of each system before and after training in Table 4. From this table, we can see that the LM increases the accuracy of all dev data, but it does not necessarily have a large effect for the test data. The main reason for this is because the development set used to train the LM is relatively small, at only 1166 sentences. However, as our goal in this paper is to perform error analysis on set of data which we already have parallel references (in this case, the development set), the generalization ability of the model is not necessarily fundamental to our task at hand. We directly identify the ability to identify errors in the next section.
4.2 Evaluation of Error Identification Ability
This section evaluates the ability of our method to identify errors in MT output. As we are proposing our method as a tool for manual analysis of MT output, it is necessary to perform manual evaluation to ensure that our method is identifying locations that are actually erroneous according to human subjective evaluation. To measure the accuracy of each method, we perform an evaluation as described in Section 3.1 and use the precision of selectedn-grams (the percentage of selectedn-grams for which then annotator indicated that an error actually existed) as our evaluation measure. The annotator is an MT specialist who is proficient in English and Japanese. The order of the evaluation sentences is shuffled so the annotator can not determine which method was responsible for choosing eachn-gram.
0 10 20 30 40 50 60 70 80 90 100 0.0
0.5 1.0
# of selected n-grams
Precision
Frequency LM
Random
Figure 3: Precision ofn-grams that select errors (Japanese to English)
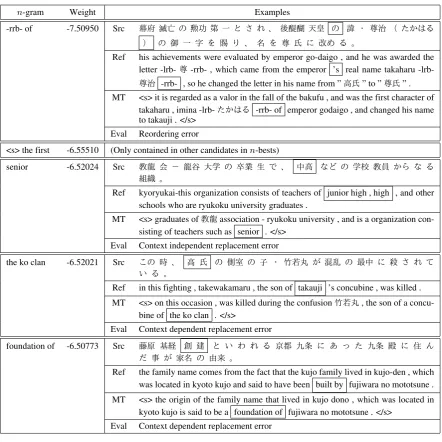
n-gram Weight Examples
-rrb- of -7.50950 Src 幕府 滅亡 の 勲功 第 一 と さ れ 、 後醍醐 天皇 の 諱 ・ 尊治 ( たかはる ) の 御 一 字 を 賜 り 、 名 を 尊 氏 に 改め る 。
Ref his achievements were evaluated by emperor go-daigo , and he was awarded the letter -lrb-尊-rrb- , which came from the emperor ’s real name takaharu
-lrb-尊治 -rrb- , so he changed the letter in his name from ”高氏” to ”尊氏” . MT <s> it is regarded as a valor in the fall of the bakufu , and was the first character of
takaharu , imina -lrb-たかはる -rrb- of emperor godaigo , and changed his name to takauji . </s>
Eval Reordering error
<s> the first -6.55510 (Only contained in other candidates inn-bests)
senior -6.52024 Src 教龍 会 - 龍谷 大学 の 卒業 生 で 、 中高 など の 学校 教員 から な る 組織 。
Ref kyoryukai-this organization consists of teachers of junior high , high , and other schools who are ryukoku university graduates .
MT <s> graduates of教龍association - ryukoku university , and is a organization con-sisting of teachers such as senior . </s>
Eval Context independent replacement error
the ko clan -6.52021 Src この 時 、 高 氏 の 側室 の 子 ・ 竹若丸 が 混乱 の 最中 に 殺 さ れ て い る 。
Ref in this fighting , takewakamaru , the son of takauji ’s concubine , was killed .
MT <s> on this occasion , was killed during the confusion竹若丸, the son of a concu-bine of the ko clan . </s>
Eval Context dependent replacement error
foundation of -6.50773 Src 藤原 基経 創 建 と い わ れ る 京都 九条 に あ っ た 九条 殿 に 住 ん だ 事 が 家名 の 由来 。
Ref the family name comes from the fact that the kujo family lived in kujo-den , which was located in kyoto kujo and said to have been built by fujiwara no mototsune .
MT <s> the origin of the family name that lived in kujo dono , which was located in kyoto kujo is said to be a foundation of fujiwara no mototsune . </s>
Eval Context dependent replacement error
Table 6: Top 5 erroneousn-grams learned by the discriminative LM and examples. Boxes on MT indi-cates the selectedn-gram, and boxes in Src and Ref indicate the corresponding words.
these results, we can see that each method is able to detect erroneousn-grams, but the proposed method achieves a precision that outperforms other methods.
To demonstrate why this is the case, in Table 6 we show examples, in context, of potentially erroneous n-grams chosen by our proposed method. Compared to the baselinen-grams in Table 1, we can see that thesen-grams are not limited to frequently occurringn-grams in English, and are more likely to have a high probability of indicating actual errors.
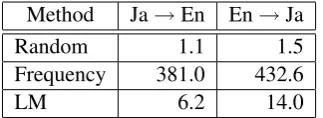
In addition, to give a better idea of the prominence of the selected n-grams, in Table 7, we show the mean number of locations of the KFTT test data that contain the top 100n-grams selected by each method. We can see that randomly selectedn-grams are rarely contained in the separate test set, while the proposed method tends to selectn-grams that are more frequent than random, and thus have a better chance of generalizing.
4.3 Effect of Evaluation Measure Choice
Method Ja→En En→Ja
Random 1.1 1.5
Frequency 381.0 432.6
LM 6.2 14.0
Table 7: Mean number of occurrences of selectedn-grams in the test set
Type +BLEU +RIBES
Actual Error 0.55 0.41
Replacement (Context dependent) 0.36 0.30 (Context independent) 0.15 0
Insertion 0.17 0.25
Deletion 0.18 0.10
Reordering 0.14 0.27
Conjugation 0 0.08
Polarity 0 0
Unknown words 0 0
Table 8: Error statistics found when optimizing different metrics. Bold indicates the higher score.
LM optimized with BLEU and another with RIBES, which is a reordering-oriented evaluation metric. We show a breakdown of the identified errors in Table 8. From this table, we can see that the BLEU-optimized LM is able to detect more deletion errors than the RIBES-BLEU-optimized LM. This is a natural result, as the BLEU metric puts a heavier weight on the brevity penalty assigned to shorter translations. On the other hand, the RIBES-optimized LM detects more reordering errors than the BLEU-optimized LM. The RIBES metric is sensitive to reordering errors, and thus reordering errors will cause larger decreases in RIBES. From this experiment, we can see that it is possible to focus on different error types by using different metrics in the optimization of the LM.
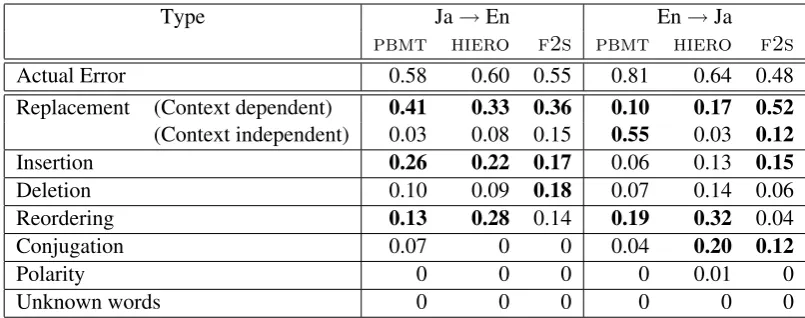
4.4 Result of System Comparison
Finally, we examine whether discriminative LMs allow us to grasp characteristic errors for system com-parison. Similarly with single system analysis, we generated the top 30 potentially erroneousn-grams forpbmt,hiero, andf2sin two directions, and evaluated them manually. The result is listed in Table 9. From this table, we can see thatpbmtandhierocount reordering errors as one of the three most frequent types, whilef2sdoes not, especially for English to Japanese. This is consistent with common knowledge that syntactic information can be used to improve reordering accuracy. We can also see in-sertion is a problem when translating into English, and conjugation is a problem when translating into morphologically-rich Japanese. While these are only general trends, they largely match with intuition, even after analysis of only the top 30n-grams.
5 Conclusion
In this paper, we proposed a new method for efficiently analyzing the output of MT systems using L1 regularized discriminative LMs, and evaluate its effectiveness. As a result, weights trained by discrim-inative LMs are more effective at identifying errors thann-grams chosen either randomly or by error frequency. This indicates that our method allows an MT system engineer to inspect fewer sentences in the course of identifying characteristic errors of the MT system.
Type Ja→En En→Ja
pbmt hiero f2s pbmt hiero f2s
Actual Error 0.58 0.60 0.55 0.81 0.64 0.48
Replacement (Context dependent) 0.41 0.33 0.36 0.10 0.17 0.52
(Context independent) 0.03 0.08 0.15 0.55 0.03 0.12
Insertion 0.26 0.22 0.17 0.06 0.13 0.15
Deletion 0.10 0.09 0.18 0.07 0.14 0.06
Reordering 0.13 0.28 0.14 0.19 0.32 0.04
Conjugation 0.07 0 0 0.04 0.20 0.12
Polarity 0 0 0 0 0.01 0
Unknown words 0 0 0 0 0 0
Table 9: Error statistics of three systems with in both directions. Bold scores are the top 3 most occuring error types in each system.
an MT system. In addition, we plan on examining the effect of using larger training data for the LM, incorporating different features based on POS patterns or syntactic features, and using more sophisticated training methods.
References
John Duchi and Yoram Singer. 2009. Efficient online and batch learning using forward backward splitting. In Journal of Machine Learning Research, volume 10.
Hideki Isozaki, Tsutomu Hirao, Kevin Duh, Katsuhito Sudoh, and Hajime Tsukada. 2010. Automatic evaluation of translation quality for distant language pairs. InProc. EMNLP, pages 944–952.
Philipp Koehn, Hieu Hoang, Alexandra Birch, Chris Callison-Burch, Marcello Federico, Nicola Bertoldi, Brooke Cowan, Wade Shen, Christine Moran, Richard Zens, Chris Dyer, Ondrej Bojar, Alexandra Constantin, and Evan Herbst. 2007. Moses: Open source toolkit for statistical machine translation. InProc. ACL, pages 177–180.
Chin-Yew Lin and Franz Josef Och. 2004. Orange: a method for evaluating automatic evaluation metrics for machine translation. InProc. COLING, pages 501–507.
Graham Neubig. 2011. The Kyoto free translation task.http://www.phontron.com/kftt.
Graham Neubig. 2013. Travatar: A forest-to-string machine translation engine based on tree transducers. InProc. ACL.
Franz Josef Och and Hermann Ney. 2003. A systematic comparison of various statistical alignment models. Computational Linguistics, 29(1):19–51.
Franz Josef Och. 2003. Minimum error rate training in statistical machine translation. InProc. ACL.
Kishore Papineni, Salim Roukos, Todd Ward, and Wei-Jing Zhu. 2002. BLEU: a method for automatic evaluation of machine translation. InProc. ACL, pages 311–318.
Maja Popovic and Hermann Ney. 2011. Towards automatic error analysis of machine translation output. In Computational Linguistics, pages 657–688.
Brian Roark, Murat Saraclar, and Michael Collins. 2007. Discriminative n-gram language modeling. Computer Speech & Language, 21(2):373–392.
Yoshimasa Tsuruoka, Jun’ichi Tsujii, and Sophia Ananiadou. 2009. Stochastic gradient descent training for l1-regularized log-linear models with cumulative penalty. InProc. ACL, pages 477–485.