Semi-Supervised Clustering for Short Answer Scoring
Andrea Horbach and Manfred Pinkal
University of Duisburg-Essen & Saarland University, Germany[email protected], [email protected]
Abstract
This paper investigates the use of semi-supervised clustering for Short Answer Scoring (SAS). In SAS, clustering techniques are an attractive alternative to classification because they provide structured groups of answers in addition to a score. Previous approaches use unsupervised clustering and have teachers label some items after clustering. We propose to re-allocate some of the human annotation effort to before and during the clustering process for (i) feature selection, (ii) for creating pairwise constraints and (iii) for metric learning. Our methods improve clustering performance substantially from 0.504 kappa for unsupervised clustering to 0.566.
Keywords:Short-Answer Scoring, Clustering, Computer-Assisted Language Learning
Prompt (ASAP dataset):During the story, the reader gets background information about Mr. Leonard. Explain the effect that background information has on Paul. Support your response with details from the story.
Answer (2 points):Paul sees himself in Mr. Leonard. They both can’t read but both are good at track.
Answer (0 points): He (the narrator) finds out that Mr. Leonard was once a star athelete at his college but dropped out because of grades.
Prompt (PG dataset): What did the Declaration of Inde-pendence do?
Answer (correct):declare independance from britain
Answer (incorrect):protect the constitution and people
Figure 1: Example prompts and answers
1.
Introduction
In an educational context, short answer questions are a type of exercise asking for short free-form answers of a few words or sentences in response to a given prompt. They oc-cur, for example, in the form of science questions or read-ing comprehension exercises and can address both native speakers, such as high school students, and foreign lan-guage learners. Automatic Short Answer Scoring (SAS) is the task of automatically assigning a score to such answers, either in numeric form (points) or by a binary true/false label. Figure 1. shows two example prompts with some scored answers.
Automatic scoring of short answer exercises is a challenge: in contrast to multiple choice or simple gap-filling exer-cises, SAS has to assess the semantic correctness of an-swers, and it is thus related to fields such as natural lan-guage understanding, paraphrase detection or textual en-tailment. In addition, it has to deal with noisy user input containing spelling and grammar errors.
Most approaches to SAS consider automatic scoring as a classification task, relying on supervised machine learning (ML) techniques which require manually labeledtraining data In contrast Basu et al. (2013),Brooks et al. (2014) and Horbach et al. (2014) have focused on the use of clustering techniques for SAS. The rationale behind this procedure is that answers that are similar to each other – and therefore end up in the same cluster – are also likely to receive the
same label for scoring and can thus be scored in one grad-ing step by a teacher. Ideally, a teacher has to label only a single answer representative for the whole cluster which is thenpropagatedto all members of the cluster.
An added value of clustering is that it provides valuable structural information, while ML classifiers just assign a score (Brooks et al., 2014). As an example, automatic clus-tering of the answers for the question from the PG dataset, ”What is one right or freedom from the First Amendment of the U.S. Constitution?” yields different groups of cor-rect and incorcor-rect answers, such as, {freedom of speech, the right of free speech, to have freedom of speech, . . .} or {freedom of religion, freedom to practise religion, the freedom of religion, . . .},{to bear arms, the right to bare arms, right to arms, . . .}. The first two clusters contain correct answers referring to different facts, the last one con-tains answers making the same error. Teachers may use the output clusters to identify common misconceptions among students and assign feedback to whole groups of answers. Some amount of human scoring is required for both super-vised ML and clustering: annotation of training data in the one case and annotation of representative cluster members as a basis for propagation in the other case. Zesch et al. (2015) compared the performance of clustering with that of ML methods, keeping the number of manually labeled items constant. They carried out their study on the PG dataset and in addition on the ASAP dataset (see below, Section 3.). They reported that clustering proved benefi-cial only on the short and simple answers (a few words) of the PG dataset. On the ASAP dataset with more complex, longer answers, clustering falls far behind ML methods in their experiments.
In this paper, we show thatsemi-supervised clusteringcan substantially improve clustering results. While existing clustering approaches use manually labeled data only for post clustering label propagation, we distribute human ef-fort and use human-labeled data in multiple ways before, during and after clustering:
• Clustering with constraints: We employ two meth-ods of using labeled instances asseeds duringthe clus-tering: (i) for guiding the clustering process through relational constraints, that indicate whether two in-stances cannot or must belong to the same cluster, and (ii) for metric learning, i.e. adapting the distance met-ric according to those constraints. We reuse the items labelled for feature selection as seeds, so the second step does not require additional annotation effort.
• Label propagation: We use label propagationafter clustering to assign a label to each cluster based on the teacher-assigned label of just one item of the clus-ter. Following Horbach et al. (2014), we annotate the the item closest to the centroid and propagate its la-bel to all cluster members, as this procedure selects prototypical instances and is superior to propagating a random label.
To the best of our knowledge, we are the first to use semi-supervised clustering for SAS. We show that the multi-purpose usage of labeled instances can overcome half of the the gap between clustering and supervised ML meth-ods, also for the complex ASAP dataset. We conclude that clustering with label propagation is an alternative to super-vised ML methods, since it has the advantage of providing teachers with structured sets of answers.
After this introduction, Section 2. report about related work. We then present in Section 3. the used data and fea-ture set. We describe our experiments in Section 5. and conclude with Section 6..
2.
Related Work
A variety of approaches for automatic SAS have been pro-posed (see Burrows et al. (2014) for an overview), ranging from rule-based systems, (Sukkarieh and Pulman, 2005), to ML systems using various kinds of automatically extracted features. ML-based approaches can be generally classified in two ways: those that assess an answer based on the simi-larity with some sort of teacher-specified target answer and those where a target answer is not used or not even avail-able. Approaches of the first type create feature vectors for each answer that express their similarity to the target an-swer based on semantic similarity or lexical overlap. The resulting classifier is not restricted to answers for just one question, but generalizes to different prompts (Mohler et al., 2011; Meurers et al., 2011). Approaches that do not compare to a target answer build one classifier per prompt using features based on the content of individual answers, such as lemma or character n-grams or dependency triples occurring in an answer. With our work, we follow the fea-ture extraction of the second approach by creating feafea-ture vectors for clustering representing the content of each an-swer and clustering anan-swers per prompt.
Our work is related to studies that address the number of an-swers needed as training data for SAS. Heilman and Mad-nani (2015) show that – as in many ML scenarios – the SAS task profits from larger training set sizes. Active learning (AL) is an ML technique that aims at selecting training in-stances in such a way that the classifier can learn most from
them (Settles, 2010); AL methods have been used success-fully in a variety of NLP tasks. In the SAS context, Hor-bach and Palmer (2016) explore active learning methods to select ML training instances and find that uncertainty sam-pling methods have an advantage over random samsam-pling of training instances.
Within the field of clustering for SAS, the most prominent contribution is the Powergrading (PG) study by Basu et al. (2013) who use k-medoids and LDA clustering for answers to US citizenship exam questions. They learn a similarity metric between answers on a part of the data which contains gold standard information about semantic equivalence be-tween answers. As features for this decision, they use var-ious kinds of similarities between answers including both surface similarity on string and lemma level and wikipedia-based LSA similarity. They use a two-layered clustering technique that separates the answer space into clusters and subclusters.
Basu et al. (2013) propose a novel measure to evaluate their clustering approach: they count the number of “actions” a teacher has to take in order to label a complete (sub)-cluster with one label for all cluster members or to label individ-ual answers until all answers in a clustering are correctly graded. This approach is not directly comparable to label propagation. Also, it does not provide a fully realistic mea-sure of the teacher’s effort because teachers do not know in advance which individual answers within a cluster are in-correctly labeled and therefore need to inspect all answers in a cluster in order to identify those which they need to re-label. Their evaluation is more comparable to an oracle variant of label propagation where we propagate the major-ity labelof a cluster instead of the one closest to the cen-troid: when assigning a label to a complete cluster in the style of Basu et al. (2013), a teacher will select the label that fits the majority of the data. We also calculate the re-sults of majority-based propagation as an oracle condition, but retain centroid-based propagation as the relevant evalu-ation method.
3.
Datasets
We run experiments on two datasets:
ASAP:We use the 10 individual prompts from the ASAP 2 dataset1from the Kaggle automatic scoring competition. Each prompt contains around 1800 items with humanly an-notated scores from 0 to 2 or 3 (depending on the dataset) in steps of 1.0. Answers are between one and a few sentences in length. The average number of tokens per prompt varies between 26 and 66.
PG:The PG dataset consists of 10 annotated answer sets (out of a total of 20 prompts) from immigration tests that tend to be very short (average number of tokens per prompt between 1.3 and 5) and therefore also much more repeti-tive. While the ASAP dataset does not contain duplicates, they occur very frequently in PG. Answers are annotated as either correct or incorrect.
1
4.
Method
4.1.
Features and Feature Selection
In congruence with previous work, we concentrate mainly on lexical features as they are highly predictive for this task. In the Kaggle competition for the ASAP dataset, the top 5 best-performing systems used mainly lexical features for scoring (Higgins et al., 2014) (the best-performing sys-tem (Tandalla, 2012) was indeed one that additionally used hand-crafted regular expressions for each prompt). For the more complex answers of ASAP, which usually consist of complete sentences instead of short phrases, we use lemma and character n-grams, and dependency subtrees as fea-tures. For the PG dataset with very short phrasal answers, dependency parsing provided unsatisfying results, so we re-stricted ourselves to character and word n-gram features. We use the labeled seeds to perform supervised feature se-lection, as clustering is particularly sensitive to noisy fea-tures (Alelyani et al., 2013).
We use Weka’s information gain-based attribute selection and test different numbers of features including the full fea-ture set. For most prompts, we reach optimal clustering re-sults with either 200 or 100 features. We use the optimal size of feature sets per prompt in all experiments for both clustering and supervised ML. We tried other linear feature selection algorithms but found no significant differences in performance. We also explored subset evaluation as an al-ternative, using Weka’s Cfs Subset evaluation and found it to be less suitable than Information Gain.
4.2.
Semi-supervised Clustering
Clustering algorithms aim at grouping similar objects to-gether, where similarity is measured by a distance metric. Standard clustering algorithms work completely unsuper-vised, only based on the distance metric. Semi-supervised clustering makes use of seed data gained through human annotation. Seed data can either be given in the form of la-beled items expressing cluster membership, or as relational information stating that two items should or should not be-long to the same cluster.
In our SAS scenario, we assume that there is a one-to-many rather than a one-to-one relation between scores and clusters. I.e. one score (out of the maximum of 4 differ-ent scores for the ASAP dataset) can contain answers that fall into different groups of semantically similar answers (see the example given in Section 1.). Especially for low-scoring answers there is certainly more than one way to “get it wrong”, and thus we cluster into more clusters than there are labels. Answers with different scores should definitely go into different clusters, answers with the same score may or may not belong to the same cluster, dependent on their semantic relatedness. Therefore, we cannot use categorical seed information to estimate the number of clusters and to initialize seed clusters as it is done for instance by Basu et al. (2002), but have to use relational information. Since scoring of individual answers is a much more natural task for teachers than assessing the similarity between different answers, we derive the relational pairwise constraints re-quired for semi-supervised clustering from individually la-beled items, the seeds. More specifically, we create a can-not link (CL) constraintstating that two answers should not
go into the same cluster for each pair of seeds with differ-ent scores. In general, semi-supervised clustering can also usemust link constraintsstating that two items belong two the same cluster. We cannot derive reliablemust link in-formation from answer scores, so we employcannot links only.
Implementation Setup We use the Weka implementa-tion (Hall et al., 2009) of the unsupervised k-means algo-rithm (KM) (Lloyd, 1982) as our baseline algoalgo-rithm, as do Zesch et al. (2015): k-means minimizes an objective func-tion that sums over the squared distances of each item to its cluster centroid. We use as distance metric Euclidian distance between feature vectors.
For semi-supervised clustering, we use extensions of k-means introduced in the metric pairwise constrained k-means(MPCKM) algorithm by Bilenko et al. (2004), who integrate the usage of pairwise constraints and metric learn-ing into the k-means algorithm and provide an extension of the Weka API for that.2 Constraints are integrated into the clustering in the form of penalties for constraint violations that are added to the objective function. Each constraint is associated with an importance weight.
Metric learning is done in the MPCKM algorithm after each k-means iteration by adjusting the weights of individual features in two ways: first, by moving existing clusters from the previous iteration further away from each other and sec-ond, by increasing the distance between items with violated CL constraints.
4.3.
Label Propagation
For our experiments, we assume the following scenario: a teacher is given one item per cluster for scoring, and the score is propagated to all members of the cluster. Accord-ingly, we evaluate our experiments using label propaga-tionfollowing both Horbach et al. (2014) and Zesch et al. (2015).
We usecentroid propagationas a realistic method, where the label for all answers in a cluster is based on just one labeled instance. We select an item for labelling which is prototypical for its cluster by selecting the one closest to the cluster centroid.
We consider majority propagation to provide an upper bound of performance that we could reach when labeling a cluster based on the label of one instance: the scoring of a cluster is optimal if the one labeled element belonged to the majority class for that cluster. This evaluation is an or-acle condition that indicates the quality and potential of a given clustering, as there is no reliable way to automatically select such an element.
4.4.
Treatment of Duplicate Items in Clustering
The PG dataset contains high numbers of duplicate an-swers; there are 2434 unique answer for a total of 6980 individual answers. Multiple annotation of duplicates does not add any information. Hence, we make sure that we never select duplicates when sampling answers for human annotation. However, the negative impact of performance is higher if we get a very frequent answer wrong compared
2
to erring on an answer that is only given by one student. Therefore we do not remove duplicates for cluster on all answers, such that multiple occurrences of an answer have more influence in the clustering process, as they have, e.g., a higher probability to be selected for centroid-based label propagation.
4.5.
Baselines
We compare our clustering results to two baselines: un-supervised k-means clustering on the full feature set and supervised ML. To enable meaningful comparison between the methods, we keep the number of annotated instancesn constant across all experimental conditions. Thus we cre-atenclusters in unsupervised k-means clustering as all hu-man annotation effort can be used to label cluster centroids, we create fewer clusters in the semi-supervised case, where some annotations are used for labeling seeds. Accordingly, the ML baseline, implemented by Weka’s SMO algorithm (Hall et al., 2009), is trained onnlabeled items, as done in Zesch et al. (2015).
In addition to their approach, we do not only calculate the baseline with the complete feature set. Supervised ML al-gorithms also profit from feature selection and it would be an unfair comparison to optimize features just for cluster-ing. We also performed feature selection for ML and report results for the best configuration per prompt. We randomly sample the data for the classifier 100 times and report aver-age results. For the optimized feature set we also report the best individual run as an upper bound.
5.
Experiments
Our experiments address the question how a set of answers can be optimally graded with only a limited amount of available human annotation effort:
Experiment 1compares variants of the k-means algorithm that correspond to different degrees of supervision to con-firm the contribution of the individual components of the MPCKM algorithm. Experiment 2 investigates the opti-mal tradeoff for distributing a given amount of human an-notations between labeling seeds before clustering and la-beling cluster centroids after clustering. InExperiment 3 we cross-check that our semi-supervised results cannot be reached with approaches that use unsupervised feature se-lection. InExperiment 4we investigate how human anno-tation effort can be further minimized by reusing seeds for label propagation.
5.1.
Experimental Setup
Dataset Sizes In order to evaluate always on the same number of answers per dataset, we use the first 1000 an-swers to each ASAP prompt and all 698 anan-swers to each PG prompt.
Evaluation Metric We report Cohen’s quadratically weighted kappa (Cohen, 1968) after label propagation. In our grading scenario, where we want to measure the qual-ity of the resulting grading of a set of answers and compare to supervised classification methods. This type of evalua-tion is more meaningful than evaluaevalua-tion measures applied in other clustering tasks, such as the widely used bCubed metric (Amig´o et al., 2009).
5.2.
Experiment 1: Different Degrees of
Supervision in Clustering
In our first experiment, we measure the influence of dif-ferent levels of supervision. We go from unsupervised k-means clustering (KMall), over k-means clustering that uses seeds only for feature selection (KMsel) and semi-supervised clustering that additionally derives CL con-straints from the seeds (KMCL), to the fullMPCKM clus-tering algorithm with feature selection, CL constraints, and metric learning. We aim at investigating the effect of a fixed “small” number n of labelled data on clustering per-formance, which at the same time should be large enough to induce clusters of reasonable quality. We decided for n = 150 (out of a total of 1,000 answers per question) for ASAP, and n = 50 for PG (the comparably low number is due to the high amount of duplicates in the answers). This over-all number of annotation steps is split into those answers that are used for both feature selection and constraints (the seeds), and those that are used to label the centroid of each cluster; i.e., the number of annotations for labeling clusters centroids determines the number of clusters created. In this experiment, the split of the n labelled items between seeds and labelled cluster centroids is 110:40 for ASAP and 40:10 for PG. These proportions of seeds and cluster cen-troids are selected as the optimal ones, based on the results of Experiment 2 (see below).
Tables 1 and 2 show the results for the different k-means variants. In addition to centroid-based label propagation, we report majority propagation MPCKMbest for the full MPCKM algorithm as an upper bound for clustering per-formance.
We can learn the following from the experiment: first, in-vesting labeled items into feature selection pays off (KMall vs KMsel) for the ASAP dataset. Second, we see that adding constraints alone gives us an additional small im-provement (KMCL vs KMsel), while adding metric learn-ing (MPCKM) adds substantially to the performance. The improvement is consistent for centroid based label prop-agation and for the majority propprop-agation upper bound MPCKMbest. Third, we see that the best clustering method comes closer to the ML baseline trained on the full dataset (M Lall. By making optimal use of the manually labelled data, we could thus close more then half of the gap between the performance of clustering and machine learning stated in Zesch et al. (2015).
For the PG dataset, basic clustering already outperforms ML methods, arguably because the very short answers of the PG dataset yield an already small feature set that con-tains little noise. For the following experiments, we there-fore report results on the more challenging ASAP dataset only. Note that our scores for ASAP are not directly com-parable to the scores of the top performing systems from the Kaggle competition, as the evaluation setup, especially the number of training and test instances used, is different.
5.3.
Experiment 2: Finding a Tradeoff between
the Numbers of Seeds and the Number of
Clusters
se-Clustering supervised ML
40 cluster, 110 seeds 150 items
p. KMall KMsel KMCL MPCKM MPCKMbest MLall MLsel MLbest
1 0.462 0.541 0.547 0.593 0.668 0.651 0.673 0.711
2 0.432 0.47 0.469 0.496 0.574 0.571 0.571 0.62
3 0.343 0.378 0.377 0.379 0.451 0.384 0.384 0.437
4 0.543 0.547 0.549 0.581 0.651 0.639 0.655 0.693
5 0.617 0.622 0.631 0.69 0.756 0.68 0.72 0.782
6 0.682 0.646 0.64 0.74 0.765 0.692 0.745 0.787
7 0.352 0.398 0.402 0.447 0.533 0.565 0.565 0.622
8 0.448 0.44 0.437 0.471 0.556 0.553 0.566 0.61
9 0.546 0.564 0.567 0.61 0.686 0.647 0.66 0.698
10 0.614 0.614 0.614 0.651 0.715 0.629 0.684 0.738
[image:5.595.105.489.69.257.2]avg 0.5039 0.522 0.5233 0.5658 0.6355 0.6011 0.6223 0.6698
Table 1: Result on the ASAP dataset
Clustering supervised ML
10 cluster. 40 seeds 50 items
p. KMall KMsel KMCL MPCKM MPCKMbest MLall MLsel MLbest
[image:5.595.56.285.393.538.2]avg 0.7928 0.7244 0.7493 0.7695 0.7864 0.7001 0.7213 0.8848
Table 2: Average results on the PG dataset
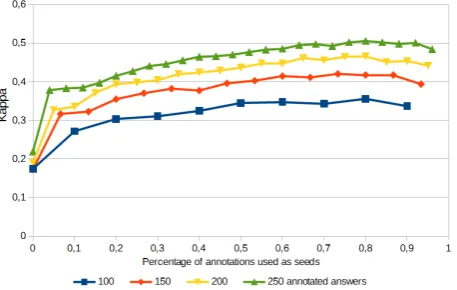
Table 3: Tradeoff between the number of seeds and the number of clusters for different overall amounts of human annotation steps.
lection and constraints before clustering, and the number of clusters, where the centroid of each cluster is labeled after clustering. To do so, we evaluate the effect of differ-ent splits between labelled seeds and cluster cdiffer-entroids for MPCKM clustering with centroid-based label propagation for different sizes of n. The results obtained for n = 100, 150, 200, 250 are shown in the curves of Table 3; plotted on the x-axis is the percentage of annotation steps used as seeds. The curves cover distributions from 0 seeds (n clus-ters) to n-10 seeds (10 clusclus-ters).
Unsurprisingly, we see that a higher overall number of an-notated data yields a better clustering performance. As an interesting result of the experiment, we observe that the curves peak always between 75 and 80% of annotated data used as seeds, i.e., we profit more from adding more seeds
then from adding more clusters.
5.4.
Experiment 3: Comparison with
Unsupervised Dimensionality Reduction
In Experiment 1, we used labeled seeds for supervised at-tribute selection. The clustering literature, however, also proposes unsupervised dimensionality reduction methods (Alelyani et al., 2013). Since this might have a similar ef-fect without using any seeds, we compare our results on su-pervised feature selection from Experiment 1 to two meth-ods of unsupervised feature selection. Principal Compo-nent Analysis (PCA, (Pearson, 1901)) is a dimensional-ity reduction technique that converts high-dimensional data into a smaller number of independent variables. We per-formed PCA using the t-SNE toolkit (van der Maaten and Hinton, 2008) for the ASAP dataset, reducing it to 500 fea-tures. As a second option, we consider feature selection by frequency, following the rationale that features occurring in only a few items are less helpful: in thefrequency-filtered feature set condition, we only use features that occur in at least 20 answers.
First, we compare whether these two feature selection methods are beneficial for unsupervised k-means cluster-ing, i.e., we compare to the unsupervised baseline KMall with 150 cluster from Experiment 1 that uses all features. To account for the fact that metric learning as used in the MPCKM algorithm might be beneficial even in the absence of constraints, we also evaluate using metric learning with-out pairwise constraints (MKM). Results are presented in the second and third column of Table 4.
features KMall MKM MPCKM
all features 0.504 0.566
PCA 0.323 0.317 0.374
frequency-filtered 0.500 0.489 0.563
Table 4: Unsupervised feature selection for two versions of completely unsupervised clustering: means (KM) and k-means with metric learning (MKM) and unsupervised fea-ture selection as a preprocessing step for semi-supervised clustering (MPCKM).
in Experiment 1, does not help here: MKM performance decreases compared to KMall. PCA shows in general a much worse performance on both the KMall and MKM conditions.
Next we explore whether a combination of unsupervised feature reduction withsemi-supervised clusteringhelps. To do that we run the MPCKM algorithm from Experiment 1 including supervised feature selection, but with each of the two unsupervised feature reduction methods as a pre-processing step. We can see in the last column of Table 4 that we do not beat our previous results using PCA, but reach very similar results with frequency-reduced features. Such unsupervised feature selection methods thus provide the additional benefit of reducing runtime substantially, and we will investigate them in future work.
5.5.
Experiment 4: Reusing Seeds for Label
Propagation
In this experiment, we examine how seeds selected before clustering can be reused for labelling cluster centroids af-ter clusaf-tering. In experiments 1 to 3, we have selected the seeds for feature selection and constraints randomly; and by chance some seeds will overlap with cluster centroids, which have to be labeled for label propagation. Our goal in this experiment is to select seeds in such a way that they will have a higher overlap with the cluster centroids. For random seed selection and our setting with 40 clusters and 110 seeds out of 1000 answers, we can expect to find on average 11% of the cluster centroids among the seeds, i.e., on average 4.4 out of 40 centroids.
We increase this random overlap through an informed itera-tive selection of seeds. We start with a small set of 20 initial seed items for clustering. We then select one new seed at a time based on the previous clustering, recluster, and re-peat this procedure until 110 seeds (as in experiment 1) are reached. We use a sampling strategy inspired bydiversity samplingin AL, cf. (Brinker, 2003) where the goal is to cover the complete feature space. In order to cover as many clusters as possible by our seeds, we select the cluster with the lowest frequency of labeled items (and the bigger one in case of ties) to choose the new seed for the next itera-tion. In order to get a good representative for that cluster that will be reusable in label propagation, we choose the item closest to the centroid as the next one to be labelled. To avoid artifacts of randomization, we average all results over 5 random seed sets per prompt.
We find that selecting seeds throughdiversity sampling
in-creases the overlap between seeds and cluster centroids to on average 11; the actual clustering performance does not differ substantially from random sampling. Those saved 12 human annotation steps can of course be used as additional seeds in our assumed setup of 150 available human anno-tation steps. We thus use an additional annoanno-tation setup where we keep adding seeds using diversity sampling un-til the total number of labeling steps reaches or surpasses a fixed number of labeling steps for the first time. (As the number of actually labeled data does not always increase completely linearly in each sampling step, we adapted this value to 148 instead of 150 in order to make sure that we do not label on average more than 150 items.) In that setup, we get some further performance improvement up to on aver-age0.577, our overall best result for 150 human annotation steps.3
6.
Conclusion
In this paper, we have examined semi-supervised clustering methods for short answer scoring in a scenario where a set of items has to be graded with a fixed limited amount of human annotations. We have shown how this limited effort can best be used in the form of seeds for feature selection and constraints and post clustering for centroid-based label propagation. We have found that using MPCKM cluster-ing with pairwise CL constraints and metric learncluster-ing com-bined with supervised feature selection brings a large per-formance boost that (i) cannot be reached using unsuper-vised methods alone and (ii) comes closer to the perfor-mance of supervised machine learning methods. Selecting seeds based on diversity additionally reduces human effort as such seeds can be efficiently used for label propagation without having to label new examples.
As direction for future work, we will also explore the usage of different similarity metrics such as sentence similarity of answers pairs, which are potentially highly useful for clustering but not applicable in an ML-based approach.
Acknowledgments
This work has been funded by the Cluster of Excellence ”Multimodal Computing and Interaction” of the German Excellence Initiative.
7.
Bibliographical References
Alelyani, S., Tang, J., and Liu, H. (2013). Feature selection for clustering: A review. InData Clustering: Algorithms and Applications, pages 29–60.
Amig´o, E., Gonzalo, J., Artiles, J., and Verdejo, F. (2009). A comparison of extrinsic clustering evaluation metrics based on formal constraints. Inf. Retr., 12(4):461–486, August.
Basu, S., Banerjee, A., and Mooney, R. J. (2002). Semi-supervised clustering by seeding. InProceedings of the Nineteenth International Conference on Machine Learn-ing, ICML ’02, pages 27–34, San Francisco, CA, USA. Morgan Kaufmann Publishers Inc.
3We also investigated a more extreme reusing strategy that
Basu, S., Jacobs, C., and Vanderwende, L. (2013). Power-grading: A clustering approach to amplify human effort for short answer grading. Transactions of the Associa-tion for ComputaAssocia-tional Linguistics, 1:391–402.
Bilenko, M., Basu, S., and Mooney, R. J. (2004). Integrat-ing constraints and metric learnIntegrat-ing in semi-supervised clustering. In Proceedings of the Twenty-first Interna-tional Conference on Machine Learning, ICML ’04, pages 11–, New York, NY, USA. ACM.
Brinker, K. (2003). Incorporating diversity in active learn-ing with support vector machines. InIn Proceedings of the 20th International Conference on Machine Learning, pages 59–66. AAAI Press.
Brooks, M., Basu, S., Jacobs, C., and Vanderwende, L. (2014). Divide and correct: Using clusters to grade short answers at scale. InProceedings of the First ACM Con-ference on Learning @ Scale ConCon-ference, L@S ’14, pages 89–98, New York, NY, USA. ACM.
Burrows, S., Gurevych, I., and Stein, B. (2014). The eras and trends of automatic short answer grading. Inter-national Journal of Artificial Intelligence in Education, 25(1):60–117, October.
Cohen, J. (1968). Weighted kappa: nominal scale agree-ment with provision for scaled disagreeagree-ment or partial credit.Psychol Bull., (70):213–220.
Hall, M., Frank, E., Holmes, G., Pfahringer, B., Reute-mann, P., and Witten, I. H. (2009). The WEKA Data Mining Software: An Update. SIGKDD Explor. Newsl., 11(1):10–18, November.
Heilman, M. and Madnani, N. (2015). The impact of train-ing data on automated short answer scortrain-ing performance. Silver Sponsor, pages 81–85.
Higgins, D., Brew, C., Heilman, M., Ziai, R., Chen, L., Cahill, A., Flor, M., Madnani, N., Tetreault, J. R., Blan-chard, D., Napolitano, D., Lee, C. M., and Blackmore, J. (2014). Is getting the right answer just about choos-ing the right words? the role of syntactically-informed features in short answer scoring. Computation and Lan-guage.
Horbach, A. and Palmer, A. (2016). Investigating active learning for short-answer scoring. In Proceedings of BEA 2016, pages 629–637.
Horbach, A., Palmer, A., and Wolska, M. (2014). Find-ing a tradeoff between accuracy and rater’s workload in grading clustered short answers. In Proceedings of the 9th Language Resources and Evaluation Conference (LREC), pages 588–595, Reykjavik, Iceland.
Lloyd, S. P. (1982). Least squares quantization in pcm. IEEE Transactions on Information Theory, 28:129–137. Meurers, D., Ziai, R., Ott, N., and Kopp, J. (2011). Eval-uating answers to reading comprehension questions in context: Results for german and the role of information structure. InProceedings of the TextInfer 2011 Workshop on Textual Entailment, pages 1–9, Edinburgh, Scottland, UK. Association for Computational Linguistics.
Mohler, M., Bunescu, R., and Mihalcea, R. (2011). Learn-ing to grade short answer questions usLearn-ing semantic sim-ilarity measures and dependency graph alignments. In Proceedings of the 49th Annual Meeting of the
Associ-ation for ComputAssoci-ational Linguistics: Human Language Technologies - Volume 1, HLT ’11, pages 752–762, Stroudsburg, PA, USA. Association for Computational Linguistics.
Pearson, K. (1901). On lines and planes of closest fit to systems of points in space. Philosophical Magazine, 2(6):559–572.
Settles, B. (2010). Active learning literature survey. Uni-versity of Wisconsin, Madison, 52(55-66):11.
Sukkarieh, J. Z. and Pulman, S. G. (2005). Information ex-traction and machine learning: Auto-marking short free text responses to science questions. InArtificial Intelli-gence in Education - Supporting Learning through In-telligent and Socially Informed Technology, Proceedings of the 12th International Conference on Artificial Intelli-gence in Education, AIED 2005, July 18-22, 2005, Ams-terdam, The Netherlands, pages 629–637.
Tandalla, L. (2012). Scoring short answer essays.
van der Maaten, L. and Hinton, G. (2008). Visualizing high-dimensional data using t-sne.