Communication
1
Better Resolution of High-Spin Cobalt Hyperfine at
2
Low Frequency: Co-doped Ba(Zn
1/3Ta
2/3)O
3as a Model
3
Complex
4
William E. Antholine 1,*, Shengke Zhang 2, Justin Gonzales 2, and Nathan Newman 2
5
1 Department of Biophysics, Medical College of Wisconsin, Milwaukee, WI 53226, USA; [email protected]
6
2 Materials Program, Arizona State University, Tempe, AZ 85287, USA; [email protected] (S.Z.);
7
[email protected] (J.G.); [email protected] (N.N.)
8
* Correspondence: [email protected]; Tel.: 414-955-4032
9
10
Abstract: Low-frequency electron paramagnetic resonance (EPR) is used to extract the EPR
11
parameter A-mid and support the approximate X-band value of g-mid for Ba(CoyZn1/3-yTa2/3)O3.
12
Although cobalt hyperfine structure for the [+/-1/2> state is often unresolved at X-band or S-band, it
13
is resolved in measurements on this compound. This allows for detailed analysis of the molecular
14
orbital for the [+/-1/2> state, which is often the ground state. Moreover, this work shows that the
15
EPR parameters for Co substituted into Zn compounds gives important insight into the properties
16
of zinc binding sites.
17
Keywords: electron paramagnetic resonance; EPR; multi-frequency EPR; high-spin cobalt complex;
18
resolution of A-mid
19
20
1. Introduction
21
The electron paramagnetic resonance (EPR) parameters of high-spin cobalt(II) [Co(II)]
22
complexes in small molecules and enzymes consist of g-values, zero field splitting parameters D and
23
E/D, and sometimes resolution of the Co hyperfine for the [+/-3/2> doublet; most often, they do not
24
include resolution of the Co hyperfine for the [+/-1/2> doublet [1-3]. Copper hyperfine and
25
superhyperfine lines, particularly the hyperfine lines about g-parallel, are better resolved at low
26
frequencies due to less g- and A-strain [4-7]. To the best of our knowledge, this is the first paper to
27
show that the hyperfine lines for high-spin Co for the Co site in Co-doped barium zirconate titanate
28
(BZT) are resolved for the [+/-1/2> doublet at low frequencies. The determination of Co A-mid
29
provides an EPR parameter that is more sensitive to adduct formation and the electron density
30
distribution in the [+/-1/2> state. A-mid for Co is also a sensitive parameter to characterize zinc (Zn)
31
sites, where Co is substituted for Zn.
32
2. Results and Discussion
33
2.1. No Resolvable Hyperfine Structure at X-band
34
EPR spectra are obtained for Ba(CoyZn1/3-yTa2/3)O3. The X-band spectrum gives a central geff-value
35
of 4.76 and possibly exchange, narrowed, and/or dipolar broadened lines for the interaction of the
36
nearest neighbors, but the Co hyperfine structure is unresolved (Figure 1) [8].
37
Preprints (www.preprints.org) | NOT PEER-REVIEWED | Posted: 16 October 2018 doi:10.20944/preprints201810.0339.v1
© 2018 by the author(s). Distributed under a Creative Commons CC BY license.
Figure 1. X-band (9.488 GHz) spectrum at 12 K for Co-doped BZT; eight short vertical lines for
38
expected but unresolved Co hyperfine lines; vertical lines with arrows may depict exchange narrowed
39
and/or dipolar broadened lines for the interaction of the nearest neighbors. Weak lines at g=9.39 and
40
2.26 are not assigned.
41
2.2. Cobalt Hyperfine Lines Resolved at Low Frequencies, S-band and L-band
42
The S-band spectrum (3.216 GHz) has four of eight resolved Co hyperfine lines, for which a geff
-43
mid value of 4.76 and an A-mid of 65 G (432 MHz) are readily apparent (Figure 2). A simulation using
44
Easyspin and a least squares fitting routine gives geff-values of 4.83, 4.56, and 2.14, and A-values of
45
432, 402, and 130 MHz (Figure 2). The simulation is consistent with, but not proof of, the parameters
46
for the experimental spectrum, because other parameters such as line width variation, Euler angles,
47
etc., are not included and the simulation may not be unique. The number of variables are
48
underdetermined for three multifrequency spectra. Simulations suggest that the structure is slightly
49
rhombic, but the geff-value of 4.76 confirms that E/D falls close to the tetragonal value. Nevertheless,
50
clear values for geff-mid and A-mid are obtained. A geff-value of 4.8 suggests that the g-mid and
A-51
mid are for the [+/-1/2> state from the rhombogram [8].
52
Figure 2. S-band (3.216 GHz) spectrum (black) for Co-doped BZT at 17 K. Exp: 28 dB, 5 G mod., time
53
constant 0.1285 sec. Simulation (red): Easyspin, least squares, simplex, geff: 4.83, 4.56, 2.14; A: 432, 402,
54
130 (fixed) MHz, HStrain: 200, 200, 200 MHz.
55
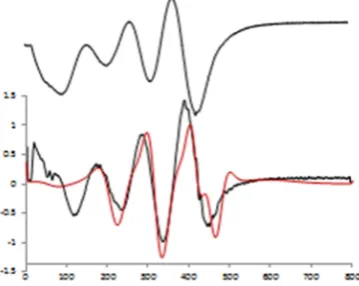
The L-band spectrum is well resolved but complicated (Figure 3). None of the splittings between
56
the resolved lines directly correspond to the 65 G for A-mid obtained at S-band, presumably from the
57
overlap of lines. It is difficult to determine whether the resolved lines are S-shaped, as would be
3 of 5
obtained for geff-mid and A-mid, or hills and valleys, as would be obtained for the low- and
high-59
field EPR parameters. The second harmonic of the L-band spectrum was measured to accurately
60
characterize the line shape (Figure 3), as it does very well for sharp lines. Starting with parameters
61
from S-band, a simulation (red spectrum) is obtained using Easyspin with least squares fitting by
62
Monte Carlo (Figure 3). The EPR parameters obtained are geff: 5.04, 4.01, 2.14, where 2.14 is arbitrarily
63
fixed, i.e., set without resolved or even unresolved lines, and A: 472, 393, 130 (fixed) MHz. A-max
64
from the simulation equals 67 G and A-mid equals 67 G, which are in good agreement with the
S-65
band value of 65 G. The simulation is also consistent with the experimental parameters (Table 1). It
66
is noted that the simulations come with a warning that there are looping transitions and possible
67
discontinuities at the ends of the spectrum, but the agreement with the experimental spectrum is
68
evidence that the simulated parameters are sensitive to geff- and A-values.
69
Figure 3. L-band (1.362 GHz) spectrum (black, top) at 16.7 K. Exp: 28 dB, 5 G mod., time constant
70
0.128 sec; second harmonic (black, bottom) 1% Bessel function using Sumspc, see Exp. Section for
71
details; Simulation (red), Easyspin, least squares, Monte Carlo: g: 5.04, 4.01, 2.14 (fixed), A: 472, 393,
72
130 (fixed) MHz.
73
Table 1. EPR A-mid values and geff for Co-doped BZT from spectra and simulations.
74
g-max g-mid A-max A-mid
X-band (9.488 GHz, exp) --- 4.76 --- ---
S-band (3.216 GHz, exp) --- 4.76 --- 64.9 G
S-band (3.216 GHz, sim) 4.83 4.56 63.8 G 63.0 G
L-band (1.362 GHz, sim) 5.04 4.01 66.9 G 67.0 G
2.3. Summary
75
A-mid and geff-mid from low-frequency spectra for Co-doped Ba(Zn1/3Ta2/3)O3 were determined
76
from the experimental S-band spectrum and from simulation of S-band and L-band EPR spectra. It is
77
estimated that E/D from a rhombogram is less than or equal to 0.1, indicating the crystal field is
78
tetragonal, almost octahedral. This study shows that the Co hyperfine value can be obtained for the
79
[+/-1/2> ground state for high-spin Co(II) complexes. This is the first Co site for which we have
80
resolved both S-band and L-band hyperfine spectra. Thus, these spectra for Co-doped BZT serve as
81
a model for Co complexes where Co hyperfine is resolved at L-band but not S-band, as is usually
82
found in other complexes [11, 12]. It is suggested that EPR values for A-mid will be a more sensitive
83
parameter for determining the coordination of and differences in the coordination of high-spin Co
84
complexes.
85
Preprints (www.preprints.org) | NOT PEER-REVIEWED | Posted: 16 October 2018 doi:10.20944/preprints201810.0339.v1
3. Materials and Methods
86
The methods to obtain the microwave ceramic, Co-doped BZT, Co-doped Ba(Zn1/3Ta2/3)O3 are
87
given in ref. [8].
88
3.1 Molecular Structure
89
Co(2+) ions are substituted for Zn(2) in Ba(Zn1/3Ta2/3)O3 [8]. Co(2+) ions are in a slightly distorted
90
octahedral crystal field and the ground state has symmetry T1g.
91
3.2 EPR Spectrometers
92
Data were obtained from a low-frequency spectrometer station assembled at the National
93
Biomedical EPR Center at the Medical College of Wisconsin (Milwaukee, WI). The station
94
incorporates an in-house built L-band (1–2 GHz) bridge, a Varian 7200 Electromagnet, Varian
V-95
7700 Magnet Power Supply, and a Bruker BH-15 Magnetic Field Controller. The 100 KHz field
96
modulation and signal phase sensitive detection were provided by a Varian E-109 System EPR
97
console. EPR signals from the phase sensitive detector were recorded on a PC with Windows 7
98
running a custom LabVIEW program. The program also controlled the BH-15 Field Controller, and
99
perform multiple-scan signal averaging, when needed.
100
The L-band bridge in the spectrometer utilizes a low phase-noise mechanically and
101
electronically tunable fundamental transistor oscillator capable of 50 mW power output to the sample
102
resonator port at 0 dB main power attenuator setting. A loop-gap resonator was used to collect
103
samples [6,7]. The oscillator microwave frequency is locked to the sample resonator frequency by a
104
70 KHz AFC system in the bridge, operating through the electronic tuning port of the oscillator. A
105
low-noise amplifier in the microwave signal receiver prior to signal mixing improves the overall
106
bridge sensitivity.
107
S-band spectra (3.2 GHz) were acquired using a loop-gap resonator, which is one of the
108
spectrometers housed at the National Biomedical EPR Center at the Medical College of Wisconsin
109
[6,7].
110
X-band spectra were obtained at Marquette University (Milwaukee, WI) using an updated EMX
111
spectrometer and a Bruker cryogen-free system.
112
Simulations were completed using an online version of EasySpin [10].
113
Author Contributions: Shengke Zhang synthesized Co-doped Ba(CoyZn1/3-yTa2/3)O3 using conventional ceramic
114
powder processing methods at the Materials Program Lab at Arizona State University [8]. Justin Gonzales and
115
Nathan Newman initiated the EPR studies by sending several transition metal ion doped microwave ceramics.
116
William Antholine made the EPR measurements at low microwave frequencies and wrote the original draft of
117
the manuscript. Justin Gonzales and Nathan Newman added insight, added details, and completed the writing
118
of the manuscript.
119
Funding: This research was funded by NIH NIBIB, grant number P41 EB001980.
120
Acknowledgments: Timothy Thelaner resurrected the low-temperature cryostat for L-band. Theodore
121
Camenisch rebuilt and keeps the L-band spectrometer operational (see Materials and Methods). The X-band
122
spectra were obtained thanks to Prof. Brian Bennett, Marquette University.
123
Conflicts of Interest: The authors declare no conflict of interest.
124
Abbreviations
125
Co cobalt
5 of 5
References
126
1. Krzystek, J.; Zvyagin, S.A.; Ozarowdki, A.; Fiedler, A.T.; Brunold, T.C.; and Telser, J. Definitive
127
spectroscopic determination of zero-field splitting in high-spin cobalt(II). J. Am. Chem. Soc. 2004, 126,
2148-128
2155, 10.1021/ja039257y.
129
2. Bennett, B., EPR of cobalt-substituted zinc enzymes, in metals in biology: Applications of high-resolution
130
EPR in metalloenzymes. In Biological Magnetic Resonance; Hanson, G. and Berliner, L., Eds.; Springer: New
131
York, USA, 2010; Volume 29, pp. 345-370, 978-1-4419-1139-1.
132
3. Marts, A.R.; Greer, S.M.; Whitehead, D.R.; Woodruff, T.M.; Breece, R.M.; Shim, S.W.; Oseback, S.N.; Papish,
133
E.T.; Jacobsen, F.E.; Cohen, S.M.; Tierney, D.L. Dual mode EPR studies of a Kramers ion: high-spin Co(II)
134
in 4-,5- and 6- coordination. Appl. Magn. Reson. 2011, 40, 501-511, 10.1007/s00723-011-0225-5.
135
4. Antholine, W. E.. Eaton S.S., Eaton G.R., and Berliner L.J., Eds.; Springer: New York, USA, 2005; Volume
136
23, pp. 417-454, 978-0-306-48506-0.
137
5. Antholine, W.E.; Bennett, B.; Hanson, G. Copper coordination environments. In Multifrequency Electron
138
Paramagnetic Resonance: Theory and Applications; Misra, S., Ed.; Wiley, Weinheim, Germany, 2011; pp.
647-139
718, 9783527407798.
140
6. Froncisz, W.; Hyde, J.S. The loop-gap resonator: a new microwave lumped circuit ESR sample structure, J.
141
Magn. Reson. 1982, 47, 515-521, 10.1016/0022-2364(82)90221-9.
142
7. Froncisz, W.; Hyde, J.S. Broadening by strains of lines in the g-parallel region of Cu2+ EPR spectra. J. Chem.
143
Phys., 1980, 73, 3123-3131, 10.1063/1.440548.
144
8. Zhang, S.; Devonport, A.; Newman, N. Main source of microwave loss in transition-metal-doped
145
Ba(Zn1/3Ta2/3)O3 and Ba(Zn1/3Nb2/3)O3 at cryogenic temperatures. J. Am. Ceram. Soc. 2015, 98, 1188-1194,
146
10.1111/jace.13419.
147
9. Hagen, W.R. EPR spectroscopy of iron sulfur proteins, Adv. Inorg. Chem. 1982, 38, 165-222,
10.1007/s00775-148
018-1543-y.
149
10. Stoll, S.; Schweiger, A. EasySpin, a comprehensive software package for spectral simulation and analysis
150
in EPR. J. Magn. Reson. 2006, 178, 42, 10.1016/j.jmr.2005.08.013.
151
11. Antholine, W.E.; Ross, M.O.; Hoffman, B.M.; Rosenzweig, A.C. Better Resolution at Low Frequency:
152
CoEDTA, a Model for Obtaining Co Hyperfine in High Spin Complexes of Biological Interest Like the
153
Transmembrane Metal Binding Site for CzcP. American Chemical Society Meeting, Division of Inorganic
154
Chemistry, Section: Bioinorganic Chemistry: Proteins and Enzymes and Model Systems, New Orleans,
155
Louisiana, USA, 2018.
156
12. Antholine, W.E.; Mahim, A.; Petering, D.H. Better Resolution of High Spin Co Hyperfine at Low Frequency,
157
L-band: Co-bovine Serum Albumin, A Model for Obtaining Co Hyperfine in High Spin Complexes of
158
Biological Interest. 59th Annual Rocky Mountain Conference on Magnetic Resonance, Snowbird, Utah,
159
USA, 2018; Abstract Number 203.
160
Preprints (www.preprints.org) | NOT PEER-REVIEWED | Posted: 16 October 2018 doi:10.20944/preprints201810.0339.v1