1
Understanding the Spread of COVID-19 in Japan: Preliminary Results from a System Dynamics Model Takuro Uehara
College of Policy Science, Ritsumeikan University, Osaka, Japan, [email protected]
Abstract
This study developed a system dynamics model to understand the spread of coronavirus disease (COVID-19) in Japan. The model is built on the generic SEIR (Susceptible, Exposed, Infected, and Recovered) framework adopted by Ghaffarzadegan and Rahmandad (2020) to build a system dynamics model for the spread of COVID-19 in Iran. Japan seems to be successful in containing the spread compared with other countries, and its first peak has passed. However, because this also leaves a large population still susceptible to the virus, it could cause a second and potentially higher peak of infection after the state of emergency aimed at reducing contact rate is lifted. As the government has proposed the “New Lifestyle,” it is critical to behave cautiously so as not to be infected. While the model focuses on the SEIR structure, the reflection of other sub-structures such as economy and hospital capacity that have tradeoffs with reducing contact rate should be beneficial. However, before extending the model, it is also critical to conduct estimates using confidence
intervals rather than point estimates to better reflect uncertainties.
Keywords
COVID-19; SARS-CoV-2; System dynamics; Japan; SEIR
1.
Introduction
This study adopts a modeling-in-real-time approach to understand the spread of coronavirus disease (COVID-19) in Japan, how it has spread, and what changes influence the spread. Although there is great uncertainty in estimating parameters given the limitation of data available, we cannot wait for the sufficient data to be available. Rather, it is critical to keep making decisions by updating the model and our understanding of the issue as we obtain more data.
This study adopts a system dynamics model built on the generic SEIR (Susceptible, Exposed, Infected, and Recovered) framework developed by Ghaffarzadegan and Rahmandad [1]. Their model was developed and parameterized in Iran. As explained below, this study adjusted their model by changing parameters and structures to fit Japan.
It should be noted that the purpose of this preprint is not to provide reliable point estimates. Rather, it intends to share the complete model information for its replicability and make it extendable or polishable by other scholars, address the potential uniqueness of the Japanese situation with corresponding implications for tackling the spread in Japan, and identifying the aspects of the model that need further investigation.
2.
Materials and Methods
2.1 COVID-19 in Japan
COVID-19 has spread around the globe, and Japan is no exception [2]. The first case was reported on January 15, 2020, and the patient returned from Wuhan in China [3]. Since then, the number of people infected has increased, and thus far, 714 cases have tested positive using the polymerase chain reaction (PCR) test on April 12, 2020, was the peak of the outbreak [4]. The Japanese government established New Coronavirus Infectious Disease Control Headquarters on January 30,
2
2020, and implemented measures to tackle the outbreak of the disease [5]. Measures include the declaration of a state of emergency, to the delivery of masks to households, to subsidiaries to companies suspending their operations. The relative mortality has been smaller than that in other countries (5 per million people in Japan, 58 per million in the US, 94 per million in Germany, and 584 per million in Spain), although it is not clear why Japan has been successful in keeping the number of deaths relatively low [6].
2.2 Key Model Structure
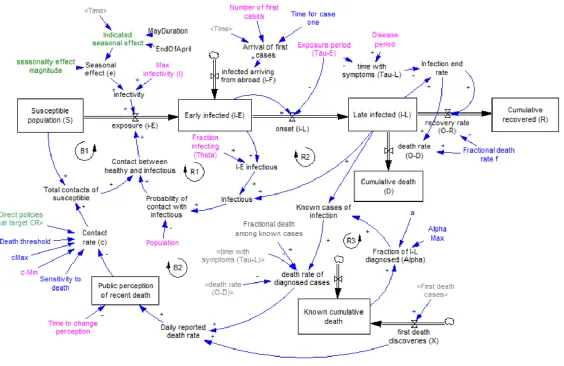
Figure 1 shows the stock-and-flow diagram built on the model developed by Ghaffarzadegan and Rahmandad [1]. The model development and its simulation used Vensim Professional for Windows 8.0.9 Double Precision x64 (Ventana Systems, Inc., www.vensim.com). Details of the model can be found in the supplementary material in [1]. The full model in the Vensim format is provided as part of the supplementary materials. The key stocks are expressed by the following integral equations [1]:
𝑆 = ∫ (−𝑖𝐸)𝑑𝑡 + 𝑆0 𝑡
0 (1)
𝐼𝐸 = ∫ (𝑖𝐸+ 𝑖𝐹− 𝑖𝐿)𝑑𝑡 + 𝐼𝐸,0 𝑡
0 (2)
𝐼𝐿= ∫ (𝑖𝐿− 𝑂𝑅− 𝑂𝐷)𝑑𝑡 + 𝐼𝐿,0 𝑡
0 (3)
𝑅 = ∫ 𝑂𝑅𝑑𝑡 + 𝑅𝐸0 𝑡
0 (4)
𝐷 = ∫ 𝑂𝐷𝑑𝑡 + 𝐷0 𝑡
0 (5)
where, S Susceptible Population [individual]; 𝑖𝐸: Exposure [individual/day]; 𝑆0: Initial value for 𝑆 [individual]; 𝐼𝐸: Early infected [individual]; 𝑖𝐹: Infected arriving from abroad at time 𝑡0
[individual/day] ; 𝑖𝐿: Onset [individual/day]; 𝐼𝐸,0: Initial value for 𝐼𝐸 [individual]; 𝐼𝐿: Late infected [individual]; 𝑂𝑅: Recovery rate [individual/day]; 𝑂𝐷: Death rate [individua/day]; 𝐼𝐿,0: Initial value for
𝐼𝐿; 𝑅: Cumulative recovered [individual]; 𝑅𝐸,0: Initial value for 𝑅 [individual]; 𝐷: Cumulative death [individual]; D0: Initial value for 𝐷.
The contact rate is one of the key characteristics that stipulates the dynamics of pandemic and characterizes Ghaffarzadegan and Rahmandad’s [1] model. It is a combination of policy intervention exogenously given and endogenously changing public perception of recent deaths.
𝑐 = 𝜌𝑐𝑚𝑎𝑥(1 − 1
1+𝑒𝑠(𝑂𝐷∗ −𝑂𝐷̿̿̿̿̿)) (6)
3 Figure 1. Key stock-and-flow diagram of the model.
4
2.3 Model Adjustments
2.3.1 Model Structure
Except for the treatment of fatalities, no major changes were made to Ghaffarzadegan and
Rahmandad’s [1] model for Iran. Due to the potential gap between official reports and actual deaths in Iran, their model embedded the structure to reflect the gap (see Supplementary material to accompany [1]). However, the official report of deaths due to COVID-19 seems to be accurate [7], and this study assumes no gap between them.
2.3.2 Parameter Value Estimates
There are three types of parameters: those taken from other sources and best guesses (pink in Figure 1), those estimated through calibration (blue in Figure 1), and those exogenously given (green in Figure 1).
Parameters taken from other sources and best guesses are the same as those in Ghaffarzadegan and Rahmandad [1] because at this moment, there are no better values fitting Japan available. As more data are reported, they are updated accordingly.
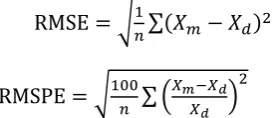
The parameters in blue were estimated through calibration using Powell, which is an optimization method available in Vensim [8]. The parameters were optimized such that the set of parameter choices produced the dynamics of infected, recovered, and dead as close as possible to the actual data available up to May 15, 2020. In the calibration, in contrast to Ghaffarzadegan and Rahmandad [1], policy changes were induced in its effect because the historical data are a reflection of the policies. For model fit, the actual data were measured by mean-square error (RMSE) and root-mean-square-percentage error (RMSPE), as shown below.
RMSE = √1
𝑛∑(𝑋𝑚− 𝑋𝑑)
2 (7)
RMSPE = √100
𝑛 ∑ ( 𝑋𝑚−𝑋𝑑
𝑋𝑑 )
2
(8) where 𝑋𝑑 is the data series and 𝑋𝑚 is the model output.
There are two types of parameters in green: policies and seasonal effects. This study assumes that there is no seasonal effect, as there has been no indication of its effect thus far. The Japanese government has implemented measures to tackle the outbreak of the COVID-19 pandemic [5]. Among others, the government declared a state of emergency effective on April 7, 2020, and applied it to seven prefectures (Saitama, Chiba, Tokyo, Kanagawa, Osaka, and Hyogo); this was later
expanded to all prefectures on April 16, 2020 [5]. The state of emergency is not a lockdown but a request to businesses and citizens to reduce the contact rate by 70% or 80% if possible [9]. The state of emergency was lifted on May 14 in 39 prefectures after a decline in the number of new infections. While the data directly describing contract rate are not available, there are several proxy data
5
The impact of the declarations of the state of emergency was reflected 𝜌 in Eq. (1), which was set to 1 when there was no policy impacting the contact rate implemented. The state of emergency was first declared on April 7 (t = 68) and applied to seven prefectures, it was then expanded to all prefectures on April 16 (t=77). The key target of the declaration was to reduce the contact rate by 70% or 80%, if possible, through social distancing [9]. To reflect this 2-step process of declaration and corresponding target contact rates, 𝜌 was set to 0.65 (35% reduction) at t = 68 by applying a weighted average according to the targeted population and then 0.2 (80% reduction) at t = 77.
3.
Results
3.1 Simulation Results
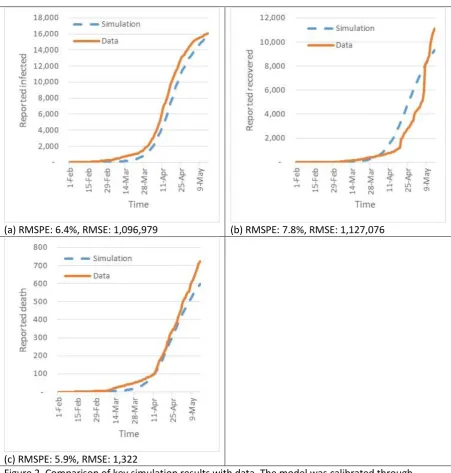
Figure 2 (a) – (c) show the fitness of the model in terms of historical data from December 31, 2019 to May 15, 2020. The RMSPE varies from 5.9% to 7.8%.
(a) RMSPE: 6.4%, RMSE: 1,096,979 (b) RMSPE: 7.8%, RMSE: 1,127,076
(c) RMSPE: 5.9%, RMSE: 1,322
6
Note: RMSPE: Root-mean-square percentage error, RMSE: Root-mean-square error
3.2 Policy analyses
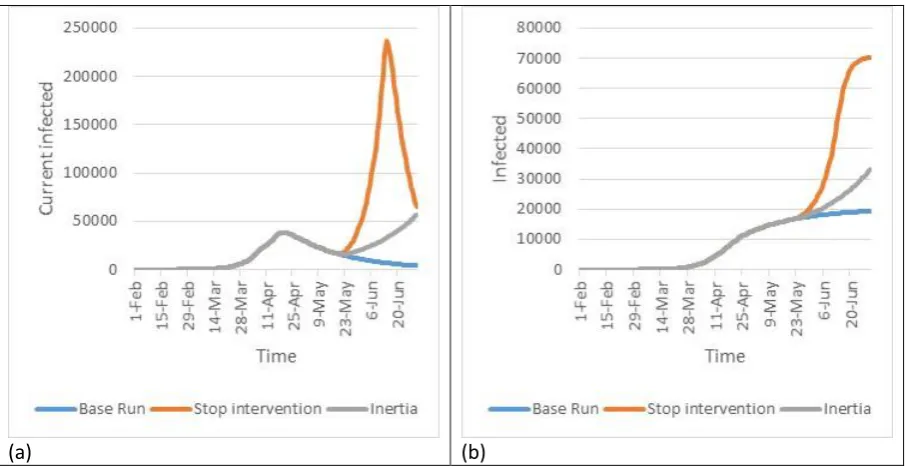
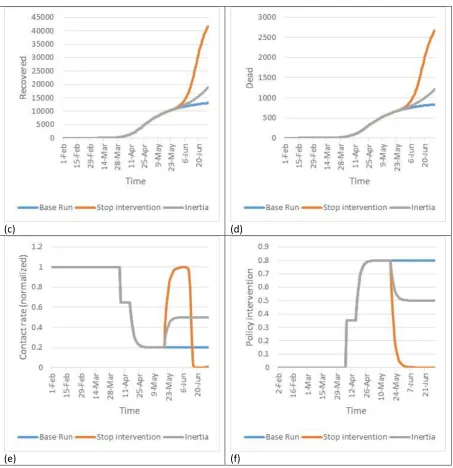
To explore the potential impact of policy intervention, the impacts of two scenarios were compared with the base run as shown in Figure 3; “Stop intervention” and “Inertia.” The only difference made to the model is the policy intervention (that is, 𝜌 in Eq. (6)), as shown in Figure 3 (f). For the base run, policy intervention remains the same until the end of June. “Stop intervention” assumes that policy intervention is lifted on May 14 as the government actually implemented [12]. However, “Inertia” assumes that the impact of policy intervention lasts to some degree even after it was lifted. The “Inertia” scenario seems to be more plausible. For example, Google COVID-19 Community Mobility Reports showed that people are still restraining their movements even after the state of emergency lifted [11]. The mobility trends for retail and recreation Japan were −31% (May 13), −30% (May 14), −32% (May 15), and −40% (May 16) compared with the baseline [11]. The 𝜌 for “Inertia” was chosen arbitrarily because of the limited information available at this moment.
Figure 3 (a) to (d) show the key dynamics of the pandemic. The contact rate (Fig. 3 (e)), which is influenced by policy intervention (Fig. 3 (f)), is key to explaining the differences in Fig. (a) – (d) across different scenarios. The current infection rate continues to decline if the policy intervention
continues (blue curves in Fig. 3). However, if the policy intervention is lifted, there may be a second peak of infections, which is higher than the first, peak that occurred on April 12, 2020. When the impact of policy intervention lingers after the intervention is lifted, there may be a second peak but slower and lower than the case without the inertia.
7
(c) (d)
(e) (f)
Figure 3. Key results of policy analyses
4.
Discussion and Conclusion
It is critical to begin this section with the limitation of this study to avoid misusing the simulation results. First, in addition to commonly used model tests [13], it is highly recommended to improve the model parameter by applying more sophisticated techniques. This study employed point estimates commonly employed for model parameters, but it provides very limited insights [14]. Instead, it would be desirable to adopt a method that could further reflect uncertainty such as conventional Monte Carlo (MC) or Markov Chain Monte Carlo (MCMC) [15]. MCMC generates samples from the posterior distribution [14]. For example, Ghaffarzadegan and Rahmandad [1] adopted MCMC to calibrate their model and show their estimates with confidence intervals. Wu et al. [16] used a similar method to examine the COVID-19 epidemic in and beyond China.
8
would be better to restrict our discussion on qualitative changes, especially regarding what will happen up to the end of June 2020 (Figure 3).
9
10
In addition to improving the reliability of the simulation results through further model testing, it is critical for future studies to reflect tradeoffs in the model by tackling epidemics. While it seems to be evident that the simplest and most effective measure to stop the spread is to reduce the contact rate to zero, such an approach could greatly influence economic activities. A research institute projected that the growth rate of GDP in Japan may decline by 6.3% to 9.0% [20]. Because the impact of lockdown may not be even across industries, it would be desirable to extend the model such that it can simulate the economic impact on an individual industry level. For example, the model can be coupled with an input-output model [21,22]. For example, while sales at grocery stores have increased by 10.7% in April compared with April last year, sales at department stores dropped by 75.2% in April compared with April last year [23,24]. Due to the huge economic impacts of lockdown, some countries such as Sweden have opted against a lockdown to contain the spread of the coronavirus [25]. However, such an approach could lead to a higher number of deaths [25]. Another problem is that the number of patients needing to be hospitalized outweighs hospital capacity [26].
Acknowledgement
I am grateful to Dr. Navid Ghaffarzadegan and Dr. Hazhir Rahmandad for generously sharing their model with me. In particular, Dr. Navid Ghaffarzadegan offered me technical assistance to adjust their model to the Japan case. Any remaining errors and omissions are, of course, my sole responsibility.
References
1. Ghaffarzadegan, N., Rahmandad, H. Simulation-based Estimation of the Spread of COVID-19 in Iran. medRxiv 2020.
2. WHO Coronavirus disease (COVID-19): Situation report - 123; Geneva, 2020.
3. Ministry of Health, Labour, and Welfare. About occurence of a patient with pneumonia associated with new coronavirus (the 1st case) Available online:
https://www.mhlw.go.jp/stf/newpage_08906.html (accessed on May 23, 2020).
4. Ministry of Health, Labour, and Welfare. About the present situation of new coronavirus infectious disease (April 12, 2012 version) Available online:
https://www.mhlw.go.jp/stf/newpage_10814.html (accessed on May 23, 2020).
5. Prime Minister’s Office of Japan. New Coronavirus Infectious Disease Control Headquarters Available online: https://www.kantei.go.jp/jp/singi/novel_coronavirus/taisaku_honbu.html (accessed on May 23, 2020).
6. Sposato, W. Japan’s Halfhearted Coronavirus Measures Are Working Anyway. Available online: https://foreignpolicy.com/2020/05/14/japan-coronavirus-pandemic-lockdown-testing/ (accessed on May 23, 2020).
7. THE PAGE Although the PCR test is not sufficient, the number of deaths is accurate. Yahoo! JAPAN 2020. Available online: https://headlines.yahoo.co.jp/hl?a=20200504-00010011-wordleafv-soci (accessed on May 17, 2020)
8. Vensim Optimization Options Available online:
https://www.vensim.com/documentation/optimizationoptions.htm (accessed on May 24, 2020).
11 State of Emergency 2020.
10. Agoop. Analysis of changes in human flow in the diffusion of new coronavirus: January 1st to May 22, 2020; Tokyo, 2020.
11. Google LLC Google COVID-19 Community Mobility Reports; 2020.
12. Abe, S. COVID-19 Press Conference by the Prime Minister regarding the Novel Coronavirus May 14, 2020 2020.
13. Sterman, J.D. Business dynamics: Systems thinking and modeling for a complex world; Irwin/McGraw-Hill Boston: Boston, MA., 2000; Vol. 19.
14. Osgood, N., Liu, J. Combining Markov chain Monte Carlo approaches and dynamic modeling. In Analytical methods for dynamic modelers. Rahmandad, H., Oliva, R., Osgood, N.D., Eds.; The MIT Press: Cambridge, Mass., 2015; pp. 125–169.
15. Wakeland, W., Homer, J. Addressing parameter uncertainty in SD models with fit-to-history and Monte-Carlo sensitivity methods; Portland, 2019;
16. Wu, J.T., Leung, K., Leung, G.M. Nowcasting and forecasting the potential domestic and international spread of the 2019-nCoV outbreak originating in Wuhan, China: a modelling study. Lancet2020, 395, 689–697.
17. Kamikubo, Y.; Takahashi, A. Paradoxical dynamics of SARS-CoV-2 by herd immunity and antibody-dependent enhancement. Cambridge Open Engag.2020.
18. Office for Novel Coronavirus Disease Control, Cabinet Secretariat, G. of J. Basic countermeasure policy for new coronavirus infection control; Tokyo, 2020. 19. Ministry of Health, Labour, and Welfare. New lifestyle Available online:
https://www.mhlw.go.jp/stf/seisakunitsuite/bunya/0000121431_newlifestyle.html (accessed on May 26, 2020).
20. Mitsubishi Research Institute. Impact of new coronavirus infectious disease on the world and Japanese economy; Tokyo, 2020.
21. Uehara, T., Cordier, M., Hamaide, B. Fully dynamic input-output/system dynamics modeling for ecological-economic system analysis. Sustainability2018, 10, 1765.
22. Cordier, M., Uehara, T., Weih, J., Hamaide, B. An input-output economic model integrated within a system dynamics ecological model: Feedback loop methodology applied to fish nursery restoration. Ecol. Econ.2017, 140, 46–57.
23. The Kyoto Shimbun Department store sales have dropped by up to 75% in the past, direct hits by corona, temporary closures in April Kyoto 2020. Available online: https://www.kyoto-np.co.jp/articles/-/253599 (accessed on May 23, 2020).
24. Nikkei Food super sales increased by 10.7% at existing stores in April, hoarding at corona 2020. Available online: https://www.nikkei.com/article/DGXLASFL21HEV_R20C20A5000000/ (accessed on May 23, 2020).
![Figure 4. Examples of practicing “New Lifestyle” adopted from the Ministry of Health, Labour, and Welfare [19]](https://thumb-us.123doks.com/thumbv2/123dok_us/8068061.1345341/9.595.74.525.56.718/figure-examples-practicing-lifestyle-adopted-ministry-health-welfare.webp)
